







Order Blocks Volume indicator
Introduction
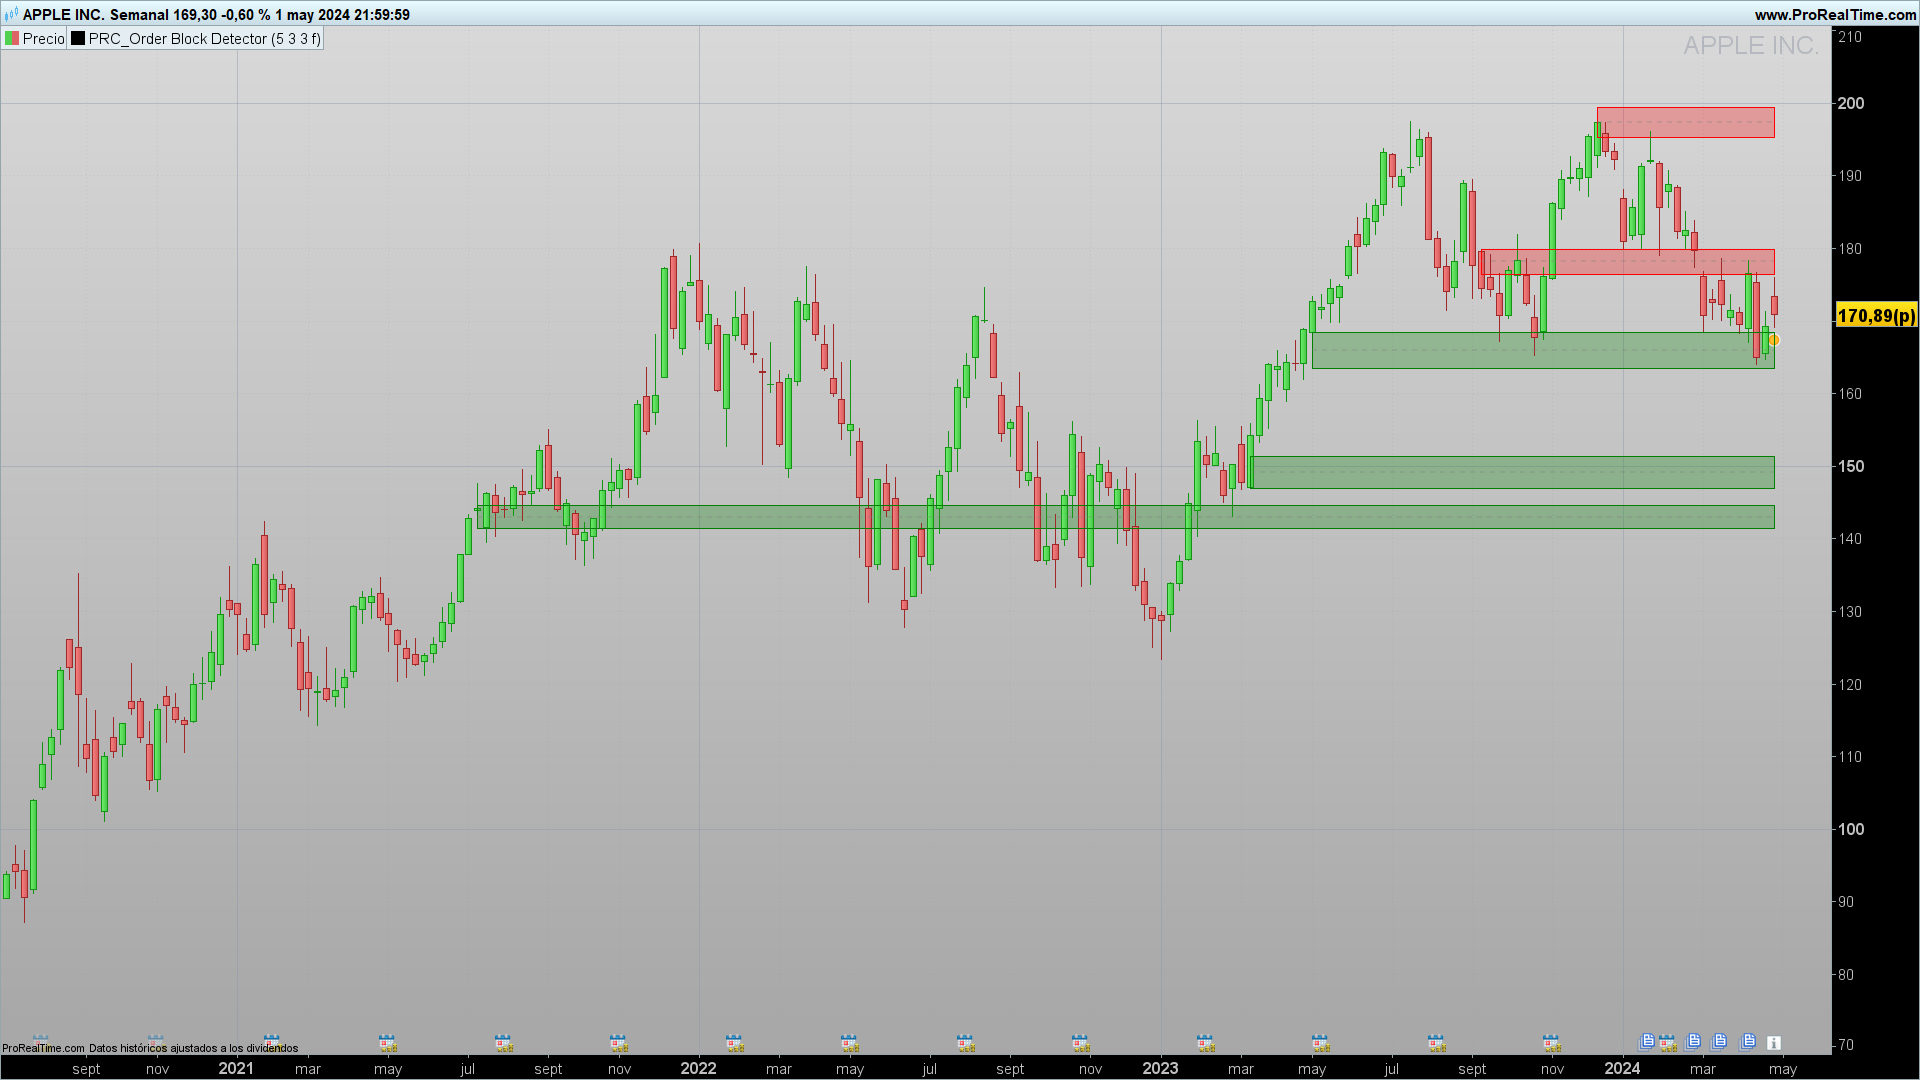
Order Blocks are critical concepts in technical analysis that help traders identify key areas where major market players have conducted significant buying or selling activities. These order blocks represent price levels at which there has been significant consolidation by institutional operators before a substantial price change. Identifying these can be crucial for determining efficient entry and exit points.
Theory of Order Blocks
An Order Block is essentially an accumulation of buy or sell orders that occur within a compact price range and can signal future price direction. These blocks are primarily categorized into two types:
- Bullish Order Block: Forms after a downward movement, indicating an area where prices may be undervalued and where buyers might start to dominate.
- Bearish Order Block: Develops after an upward movement and suggests an area where prices might be overvalued, attracting sellers.
The formation of these blocks indicates a pause before the market makes a significant move, making them strategic points for trading operations. There are several methodologies to calculate Order Blocks:
- Volume-based pivots: Identify blocks where there is a significant increase in volume, suggesting an accumulation of orders.
- Price-based pivots: Use price extremes to identify zones where the price has reacted strongly, suggesting a possible order accumulation.
- Combination of volume and price: Analyzes both changes in volume and price for a more robust signal.
In the provided code, a volume-based pivot approach is used, where a peak in volume coinciding with a price direction change indicates the formation of an Order Block.
Indicator Configuration
The Order Block Detector indicator uses several settings to identify and visualize these important market levels:
- length: Defines the number of bars to consider to identify a volume peak or trough, essential for determining an “Order Block”.
- bullextlast and bearextlast: Set the number of bullish or bearish blocks to display, respectively.
- mitigation: Decides whether the block is evaluated by the closing price or by the wick’s extreme, affecting the accuracy of the detected block.
Code of the Indicator
The code for ProRealTime facilitates the automatic implementation of the Order Block Detector. The script is designed to analyze market data and highlight areas where Order Blocks may be forming. It uses a combination of volume and price comparisons to detect these critical levels.
//----------------------------------------------------------------------//
//PRC_Order Block Detector
//version = 0
//30.04.24
//Iván González @ www.prorealcode.com
//Sharing ProRealTime knowledge
//----------------------------------------------------------------------//
//-----Settings---------------------------------------------------------//
length = 5 //Volume Pivot Length
bullextlast = 3 //Bullish OB
bearextlast = 3 //Bearish OB
mitigation = 0 //0=Wick 1=Close
//----------------------------------------------------------------------//
//-----Global elements--------------------------------------------------//
n=barindex

upper = highest[length](high)
lower = lowest[length](low)

if mitigation then
targetbull = lowest[length](close)
targetbear = highest[length](close)
else
targetbull = lower
targetbear = upper
endif

if high[length] > upper then
os = 0
elsif low[length] < lower then
os = 1
else
os = os[1]
endif
//----------------------------------------------------------------------//
//-----Pivot Points - Volume--------------------------------------------//
if volume < volume[length] and highest[length](volume)<volume[length] and volume[length]>highest[length](volume)[length+1] then
$phvol[t+1]=volume[length]
$phvolx[t+1]=barindex[length]
t=t+1
endif
phv = $phvol[t]
//----------------------------------------------------------------------//
//-----Get bullish/bearish order blocks coordinates---------------------//
//-----Bullish OB
if isset($phvol[t]) and phv<>phv[1] and os=1 then
$bulltop[m+1] = (high[length]+low[length])/2
$bullbtm[m+1] = low[length]
$bullavg[m+1] = ((high[length]+low[length])/2+low[length])/2
$bullleft[m+1] = barindex-length
$bullob[m+1] = low[length]
m=m+1
endif
//-----Bearish OB
if isset($phvol[t]) and phv<>phv[1] and os=0 then
$beartop[r+1] = high[length]
$bearbtm[r+1] = (high[length]+low[length])/2
$bearavg[r+1] = ((high[length]+low[length])/2+high[length])/2
$bearleft[r+1] = barindex-length
$bearob[r+1] = high[length]
r=r+1
endif
//----------------------------------------------------------------------//
//-----Remove mitigated order blocks------------------------------------//
if islastbarupdate then
//-----Set only last x Bullish OB not mitigated
t=0
for i=m downto 0 do
if targetbull > $bullbtm[i] then
$bullishTOP[T+1] = $bulltop[i]
$bullishBOT[T+1] = $bullbtm[i]
$bullishAVG[T+1] = $bullavg[i]
$bullishLEFT[T+1] = $bullleft[i]
t=t+1
drawrectangle($bullishLEFT[t],$bullishTOP[t],barindex,$bullishBOT[t])coloured("green")fillcolor("green",70)
drawsegment($bullishLEFT[t],$bullishAVG[t],barindex,$bullishAVG[t]) coloured("grey",70)style(dottedline,2)
if t >= bullextlast then
break
endif
endif
next
//-----Set only last x Bearish OB not mitigated
k=0
for j=r downto 0 do
if targetbear < $beartop[j] then
$bearishtop[k+1]=$beartop[j]
$bearishbot[k+1]=$bearbtm[j]
$bearishavg[k+1]=$bearavg[j]
$bearishleft[k+1]=$bearleft[j]
k=k+1
drawrectangle($bearishleft[k],$bearishtop[k],barindex,$bearishbot[k])coloured("red")fillcolor("red",70)
drawsegment($bearishleft[k],$bearishavg[k],barindex,$bearishavg[k]) coloured("grey",70)style(dottedline,2)
if k >= bearextlast then
break
endif
endif
next
endif
//----------------------------------------------------------------------//
return
Interpretation of Results
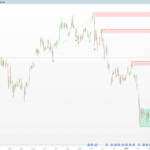
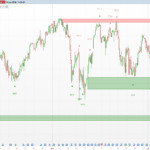
Interpreting detected Order Blocks is straightforward: a bullish block suggests a potential support area and an entry point for long positions, while a bearish block indicates resistance and an entry point for short positions. The trader should observe these blocks in conjunction with other technical analysis signals to validate and strengthen trading decisions.
Conclusions
Order Blocks are powerful tools for any technical trading arsenal. Their correct identification and analysis can provide traders with a significant advantage, offering entry and exit points based on the historical activity of the market’s most influential operators. With practice and integration of this indicator, traders can significantly improve their accuracy and operational efficiency.
![Probabilistic ICT Order Blocks [3D]](https://www.prorealcode.com/wp-content/uploads/2026/08/EURUSDXXXX-1-hora-150x150.png)
Comments
You must be logged in to post a comment.



Ciao Ivan, ti faccio ancora una domanda e precisamente "Quanti blocchi visualizzare per avere una corretta indicazione" Grazie


finaly the screener could be something like this for green blocks but it probably could be better ////// length = 5 //Volume Pivot Length bullextlast = 3 //Bullish OB mitigation = 0 //0=Wick 1=Close //----------------------------------------------------------------------// //-----Global elements--------------------------------------------------// upper = highest[length](high) lower = lowest[length](low) if mitigation then targetbull = lowest[length](close) else targetbull = lower endif if high[length] > upper then os = 0 elsif low[length] < lower then os = 1 else os = os[1] endif //----------------------------------------------------------------------// //-----Pivot Points - Volume--------------------------------------------// if volume < volume[length] and highest[length](volume)highest[length](volume)[length+1] then $phvol[t+1]=volume[length] $phvolx[t+1]=barindex[length] t=t+1 endif phv = $phvol[t] //----------------------------------------------------------------------// //-----Get bullish/bearish order blocks coordinates---------------------// //-----Bullish OB if isset($phvol[t]) and phvphv[1] and os=1 then $bulltop[m+1] = (high[length]+low[length])/2 $bullbtm[m+1] = low[length] $bullavg[m+1] = ((high[length]+low[length])/2+low[length])/2 $bullleft[m+1] = barindex-length $bullob[m+1] = low[length] m=m+1 endif //-----Remove mitigated order blocks------------------------------------// if islastbarupdate then //-----Set only last x Bullish OB not mitigated t=0 inside = 0 zone = 0 for i=m downto 0 do if targetbull > $bullbtm[i] then $bullishTOP[T+1] = $bulltop[i] $bullishBOT[T+1] = $bullbtm[i] $bullishAVG[T+1] = $bullavg[i] $bullishLEFT[T+1] = $bullleft[i] t=t+1 Zone = 1 if close > min($bullishTOP [t],$bullishBOT[T]) and close = bullextlast then break endif endif next endif //----------------------------------------------------------------------// screener [Zone = 1 and inside = 1]


Congratulations Ivan, this indicator seems to me to be very useful and much quicker than the offer and demand areas published in the past on PRT. I'm trying to use it to create an automatic entry and exit strategy, but I can't read it in the actual bar if I'm looking for a red block (possible short or wide lock) or looking for a green band (possible wide or short lock). Could we create an entry strategy on this basis, so that at some point one can add other entry filters according to one's philosophy? ¡¡¡Thanks in advance!!! Franco
Felicitaciones Ivan, este indicador me parece muy útil y mucho más rápido que las zonas de oferta y demanda publicadas en el pasado en PRT. Estoy intentando usarlo para crear una estrategia automática de entrada y salida, pero no puedo entender en la barra actual si estoy cerca de un bloque rojo (posible cierre corto o largo) o cerca de una banda verde (posible cierre largo o corto). ¿Podrías crear una estrategia de entrada sobre esta base, para que luego cada uno pueda añadir otros filtros de entrada según su propia filosofía? ¡¡¡Gracias de antemano!!! Franco

Félicitation Yvan. Cet indicateur est le plus intéressant et le plus pertinent que j'ai vu depuis longtemps. Il apporte une information précieuse sur la probabilité de réussite au moment de placer un trade short ou long. Il a une capabilité de prédiction sur l'évolution d'un cours bien meilleure que bien d'autres indicateur.

Estimado Iván, gracias por publicar estos indicadores, ¡gran trabajo! Dos indicadores que realmente echo de menos de TradingView son: Chandelier Exit de Alex Orekhov y Nadaraya-Watson Envelope de LuxAlgo. Incluyo los códigos por si te gustaría programarlos en PRT, ¡gracias! //................................................................................................................................// //@version=5 // Copyright (c) 2019-present, Alex Orekhov (everget) // Chandelier Exit script may be freely distributed under the terms of the GPL-3.0 license. indicator('Chandelier Exit', shorttitle='CE', overlay=true) var string calcGroup = 'Calculation' length = input.int(title='ATR Period', defval=22, group=calcGroup) mult = input.float(title='ATR Multiplier', step=0.1, defval=3.0, group=calcGroup) useClose = input.bool(title='Use Close Price for Extremums', defval=true, group=calcGroup) var string visualGroup = 'Visuals' showLabels = input.bool(title='Show Buy/Sell Labels', defval=true, group=visualGroup) highlightState = input.bool(title='Highlight State', defval=true, group=visualGroup) var string alertGroup = 'Alerts' awaitBarConfirmation = input.bool(title="Await Bar Confirmation", defval=true, group=alertGroup) atr = mult * ta.atr(length) longStop = (useClose ? ta.highest(close, length) : ta.highest(length)) - atr longStopPrev = nz(longStop[1], longStop) longStop := close[1] > longStopPrev ? math.max(longStop, longStopPrev) : longStop shortStop = (useClose ? ta.lowest(close, length) : ta.lowest(length)) + atr shortStopPrev = nz(shortStop[1], shortStop) shortStop := close[1] shortStopPrev ? 1 : close math.exp(-(math.pow(x, 2)/(h * h * 2))) //-----------------------------------------------------------------------------} //Append lines //-----------------------------------------------------------------------------{ n = bar_index var ln = array.new_line(0) if barstate.isfirst and repaint for i = 0 to 499 array.push(ln,line.new(na,na,na,na)) //-----------------------------------------------------------------------------} //End point method //-----------------------------------------------------------------------------{ var coefs = array.new_float(0) var den = 0. if barstate.isfirst and not repaint for i = 0 to 499 w = gauss(i, h) coefs.push(w) den := coefs.sum() out = 0. if not repaint for i = 0 to 499 out += src[i] * coefs.get(i) out /= den mae = ta.sma(math.abs(src - out), 499) * mult upper = out + mae lower = out - mae //-----------------------------------------------------------------------------} //Compute and display NWE //-----------------------------------------------------------------------------{ float y2 = na float y1 = na nwe = array.new(0) if barstate.islast and repaint sae = 0. //Compute and set NWE point for i = 0 to math.min(499,n - 1) sum = 0. sumw = 0. //Compute weighted mean for j = 0 to math.min(499,n - 1) w = gauss(i - j, h) sum += src[j] * w sumw += w y2 := sum / sumw sae += math.abs(src[i] - y2) nwe.push(y2) sae := sae / math.min(499,n - 1) * mult for i = 0 to math.min(499,n - 1) if i%2 line.new(n-i+1, y1 + sae, n-i, nwe.get(i) + sae, color = upCss) line.new(n-i+1, y1 - sae, n-i, nwe.get(i) - sae, color = dnCss) if src[i] > nwe.get(i) + sae and src[i+1] < nwe.get(i) + sae label.new(n-i, src[i], '▼', color = color(na), style = label.style_label_down, textcolor = dnCss, textalign = text.align_center) if src[i] nwe.get(i) - sae label.new(n-i, src[i], '▲', color = color(na), style = label.style_label_up, textcolor = upCss, textalign = text.align_center) y1 := nwe.get(i) //-----------------------------------------------------------------------------} //Dashboard //-----------------------------------------------------------------------------{ var tb = table.new(position.top_right, 1, 1 , bgcolor = #1e222d , border_color = #373a46 , border_width = 1 , frame_color = #373a46 , frame_width = 1) if repaint tb.cell(0, 0, 'Repainting Mode Enabled', text_color = color.white, text_size = size.small) //-----------------------------------------------------------------------------} //Plot //-----------------------------------------------------------------------------} plot(repaint ? na : out + mae, 'Upper', upCss) plot(repaint ? na : out - mae, 'Lower', dnCss) //Crossing Arrows plotshape(ta.crossunder(close, out - mae) ? low : na, "Crossunder", shape.labelup, location.absolute, color(na), 0 , text = '▲', textcolor = upCss, size = size.tiny) plotshape(ta.crossover(close, out + mae) ? high : na, "Crossover", shape.labeldown, location.absolute, color(na), 0 , text = '▼', textcolor = dnCss, size = size.tiny) //-----------------------------------------------------------------------------}
E quindi dovrebbe essere più preciso nell'indicare le zone?
Scusa, mi sembra molto simile al precedente indicatore postato da te "Demand/Supply Zone" , oppure sono diversi e io non capisco la differenza. Grazie
Infatti, il Volume profile, il POC, le VA il CVD sono finalmente disponibili su PRT V12. Secondo te, sarebbe possibile programmare (anche pagando :)) un indicatore tipo Order Flow? Grazie M