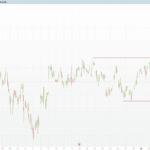
Probabilistic ICT Order Blocks [3D]
![Probabilistic ICT Order Blocks [3D]](https://www.prorealcode.com/wp-content/uploads/2026/08/EURUSDXXXX-1-hora.png)
Introduction
An order block tells you where institutional interest may sit. It does not tell you whether this particular one is worth trading. Every block gets the same rectangle, and the trader is left to sort them out by feel.
Probabilistic ICT Order Blocks [3D], by GainzAlgo, attacks that gap from an unusual angle. It detects order blocks the classical ICT way — through a market structure shift — and then stamps each one with a probability produced by a model the indicator trains on the chart itself. Not a fixed weighting, not a hand-tuned score: a supervised classifier that learns from recent price action, is retrained periodically, and outputs a calibrated number between 0 and 100%.
On top of that, the indicator keeps score. Every block goes through a two-stage life — first it must be tested, then it resolves as a win or a loss — and those outcomes feed a live dashboard. The blocks themselves are drawn with a pseudo-3D effect: a front face, a rear face offset in both axes, and four depth edges connecting them.
Theory Behind the Indicator
1. The trigger: a market structure shift
A bullish order block is born when the close crosses above the highest high of the last swingLen bars. That is a structure break: price has taken out the local resistance that had been containing it.
highLH  = highest[swingLen](high)
mssBull = close crosses over highLH[1]
The block is not the breakout candle. Following ICT convention, the indicator looks backwards across a window of swingLen × 2 bars and picks the bearish candle with the lowest low — the last significant supply before buyers took control. The block is that candle’s full high-to-low range. The bearish case mirrors it exactly: a close under the lowest low of the window, then the bullish candle with the highest high becomes the block.
A new block is discarded if it overlaps any live block, bullish or bearish. The chart never accumulates near-duplicate zones. A per-side cap keeps only the maxBlocks most recent, oldest evicted first.
2. The probabilistic engine — the distinctive part
This is what separates the indicator from every other order block tool. Four features are extracted on every bar:
- RSI(14) — momentum.
- MFI(14) on typical price — volume-weighted momentum.
- ATR(14) as a percentage of price — relative volatility.
- Volume z-score over 20 bars — is the current volume unusual for this market?
And a supervised target, defined with hindsight so it can be learned from: was price higher five bars later? For every historical bar in the training window the answer is known, so the model has a labelled dataset that the chart generates on its own, with no external data and no user input.
Every retrainF bars the model is retrained on the last trainLen bars. Its output on the current bar is the probability stamped on any block created there: p for bullish blocks, 1 - p for bearish ones.
The concept is sound, and it is worth stating what the number is honestly: it is the model’s estimate that price will be higher in five bars given the current momentum, volatility and volume conditions — not a probability that this particular block will hold. It is context, measured on the block’s birth conditions rather than eyeballed.
3. Life and death of a block: test, then resolve
Blocks are not decorations here; they are tracked positions in a scoreboard.
- Test. A bullish block becomes tested the first time a bar’s low reaches or drops below its ceiling. Price has come back to the zone.
- Win. A tested block resolves as a win when a bar closes above its ceiling — price returned to the zone and was pushed back out.
- Loss. A block resolves as a loss when a bar closes below its floor — price went straight through the whole zone.
The bearish case is the mirror. Resolved blocks are removed by default, which keeps the chart clean and frees space for new zones.
4. The dashboard, and what it actually measures
Wins and losses accumulate into a four-row panel: bullish win rate, bearish win rate, overall win rate, and the model’s current bullish probability. Each rate shows its sample size in brackets.
Read this panel with your eyes open, because the number is easy to misinterpret. The two barriers are not symmetric. A bullish block wins when price closes above its ceiling — but the block sits below price after an upward structure break, so closing above its ceiling is the default state. Any wick that touches the zone without piercing it counts as a win. Losing requires closing beyond the block’s entire range.
The win barrier is a wick; the loss barrier is the full zone. That asymmetry is why these figures typically land in the 70-90% region. It is a real and useful measurement — the proportion of zones that survived first contact — but it is not the hit rate of a trade. There is no target, no symmetric stop, no R multiple. Treat it as a robustness statistic for the zones on this instrument and timeframe, and do not carry it into an expectancy calculation without redefining the criteria.
5. The 3D rendering
Each block is drawn twice: a front face spanning from the origin candle to the current bar, and a rear face offset by depthShift bars to the right and tickShift ticks upward, with four segments joining the matching corners. It is a visual device — the depth carries no information — but it does make overlapping zones easier to separate at a glance.
Win and loss markers print on the chart at the bar where each block resolved: a triangle for a win, a cross for a loss, below price for bullish blocks and above for bearish ones.
How to Read the Indicator
- The percentage is context, not a verdict. It describes the momentum/volatility/volume regime when the block formed. A block born at 70% formed under conditions the model associates with continuation.
- A block only counts once it has been tested. An untouched zone is a hypothesis; the interesting moment is the return.
- Markers show what already happened. A triangle means the zone was defended, a cross means it was consumed. They are the record of the scoreboard, not entry signals.
- Overlap suppression means what you see is what is in play. If a zone is on the chart, it has not been resolved and it does not collide with any other.
- A closed break is final. Resolution requires a close beyond the relevant edge, so wicks through a zone do not kill it.
Practical Applications
- Ranking zones you would trade anyway. If you already trade order blocks, the probability provides a non-discretionary filter: take only blocks above a chosen threshold and let the rest go.
- Retest entries with a defined invalidation. The block gives both the entry area and the level beyond which the idea is wrong — the far edge, whose close is what resolves it as a loss.
- Instrument and timeframe screening. Run it across a watchlist and read the dashboard. Instruments where zones survive first contact reliably behave differently from those where price slices straight through, and that is worth knowing before choosing where to apply an order block strategy.
- Testing the model itself. The most interesting exercise: split resolved blocks by probability decile and compare outcomes. If the high-probability blocks do not resolve better than the low-probability ones, the engine is decoration on this market. If they do, you have a filter. The indicator gives you everything needed to run that check.
Indicator Configuration
swingLen(default 5): bars used for the structure break and for the backward search window (swingLen × 2).maxBlocks(default 4): simultaneous blocks kept per side.deleteOnBreak(default 1): remove a block once it resolves.trainLen(default 200): training window, in bars.retrainF(default 30): retrain every N bars.epochs(default 4): passes over the window per retraining. This is the cost dial — lower it if the chart is slow to paint.lrate(default 0.05) /l2reg(default 0.001): learning rate and L2 regularisation.horizon(default 5): bars ahead that define the target.depthShift(default 2) /tickShift(default 3): 3D depth in bars and in ticks.showText,showDash,showMarkers(default on): layer toggles.maxMarks(default 60): historical win/loss markers kept.
Code
//----------------------------------------------------------------------//
// PRC_Probabilistic ICT Order Blocks [3D] (by GainzAlgo)
// version = 1
// 31.07.2026
// Ivan Gonzalez @ www.prorealcode.com
// Sharing ProRealTime knowledge
//----------------------------------------------------------------------//
DEFPARAM drawonlastbaronly = true
//----------------------------------------------------------------------//
//-----ICT Order Block Settings-----------------------------------------//
swingLen      = 5     // Swing Detection Length (>= 2)
maxBlocks     = 4     // Bloques mostrados por tipo (1..10)
deleteOnBreak = 1     // 1 = borrar el bloque al invalidarse por completo

//-----Motor de aprendizaje---------------------------------------------//
trainLen  = 200       // Ventana de entrenamiento (barras)
retrainF  = 30        // Reentrenar cada N barras
epochs    = 4         // Pasadas sobre la ventana en cada reentrenamiento
lrate     = 0.05      // Learning rate
l2reg     = 0.001     // Regularizacion L2 (weight decay)
horizon   = 5         // Barras a futuro que define el target
atrBaseLen = 100      // Ventana de referencia para normalizar la volatilidad

//-----3D Rendering Visuals---------------------------------------------//
depthShift = 2        // Profundidad en barras (1..5)
tickShift  = 3        // Profundidad en ticks (subir mucho si el tick es fino)
showText   = 1        // 1 = etiqueta con la probabilidad dentro del bloque

//-----Win Rate Dashboard-----------------------------------------------//
showDash    = 1       // 1 = panel de win rate (esquina superior derecha)
showMarkers = 1       // 1 = marcadores de acierto/fallo en el grafico
maxMarks    = 60      // Marcadores conservados en el historico

//-----Colours----------------------------------------------------------//
bullR = 0             // #00e5ff
bullG = 229
bullB = 255
bearR = 255           // #ff1744
bearG = 23
bearB = 68
txtR  = 125           // texto de la etiqueta del bloque
txtG  = 125
txtB  = 125
dashR = 215           // texto del panel
dashG = 221
dashB = 230

//-----Features del clasificador (series completas)---------------------//
// Las mismas 4 del original, normalizadas a un rango comparable para que
// el gradiente converja (el boosting original es invariante a escala; una
// logistica no lo es).
f1 = rsi[14](close)
f2 = moneyflowindex[14]
atrPct = averagetruerange[14](close) / (close + 0.000001) * 100
atrBase = average[atrBaseLen](atrPct)
volSma = average[20](volume)
volSd = std[20](volume)

x1 = f1 / 50 - 1
x2 = f2 / 50 - 1

x3 = 0
IF atrBase > 0 THEN
   x3 = atrPct / atrBase - 1
ENDIF
IF x3 > 2 THEN
   x3 = 2
ENDIF
IF x3 < 0 - 1 THEN
   x3 = 0 - 1
ENDIF

volZ = 0
IF volume > 0 AND volSd > 0 THEN
   volZ = (volume - volSma) / volSd
ENDIF
IF volZ > 3 THEN
   volZ = 3
ENDIF
IF volZ < 0 - 3 THEN
   volZ = 0 - 3
ENDIF
x4 = volZ / 3

//-----Estructura de mercado (MSS)--------------------------------------//
highLH = highest[swingLen](high)
lowLL = lowest[swingLen](low)
atrRaw = averagetruerange[14](close)

//-----Estado persistente en ARRAYS-------------------------------------//
// $gS[0] ultima barra procesada (guard antitick)
// $gS[1] nBull   $gS[2] nBear   $gS[3] bullWin   $gS[4] bullLos
// $gS[5] bearWin $gS[6] bearLos $gS[7] nMark     $gS[8] modelReady
// $gS[9] currentProb
// $gW[0..4] pesos de la regresion logistica (bias + 4 features)
IF barindex = 0 THEN
   $gS[0] = 0 - 1
   $gS[1] = 0
   $gS[2] = 0
   $gS[3] = 0
   $gS[4] = 0
   $gS[5] = 0
   $gS[6] = 0
   $gS[7] = 0
   $gS[8] = 0
   $gS[9] = 0.5
   $gW[0] = 0
   $gW[1] = 0
   $gW[2] = 0
   $gW[3] = 0
   $gW[4] = 0
ENDIF

//-----GUARD: una sola pasada por barra, sobre la barra CERRADA----------//
IF barindex > $gS[0] THEN
   $gS[0] = barindex

   pIdx = barindex - 1
   pH = high[1]
   pL = low[1]
   pC = close[1]

   nBull = $gS[1]
   nBear = $gS[2]
   bullWin = $gS[3]
   bullLos = $gS[4]
   bearWin = $gS[5]
   bearLos = $gS[6]
   nMark = $gS[7]

   //-----(0) Entrenamiento del clasificador----------------------------//
   // Warmup: x3[trainLen+1] necesita atrBase, que tarda atrBaseLen barras.
   warmNeed = trainLen + atrBaseLen + horizon + 5
   IF pIdx > warmNeed AND pIdx MOD retrainF = 0 THEN
      w0 = $gW[0]
      w1 = $gW[1]
      w2 = $gW[2]
      w3 = $gW[3]
      w4 = $gW[4]
      decay = 1 - lrate * l2reg
      FOR ep = 1 TO epochs DO
         FOR ofs = horizon + 1 TO trainLen + 1 DO
            a1 = x1[ofs]
            a2 = x2[ofs]
            a3 = x3[ofs]
            a4 = x4[ofs]
            fut = ofs - horizon
            yTr = 0
            IF close[fut] > close[ofs] THEN
               yTr = 1
            ENDIF
            zTr = w0 + w1 * a1 + w2 * a2 + w3 * a3 + w4 * a4
            IF zTr > 30 THEN
               zTr = 30
            ENDIF
            IF zTr < 0 - 30 THEN
               zTr = 0 - 30
            ENDIF
            pTr = 1 / (1 + exp(0 - zTr))
            gTr = pTr - yTr
            w0 = w0 - lrate * gTr
            w1 = w1 * decay - lrate * gTr * a1
            w2 = w2 * decay - lrate * gTr * a2
            w3 = w3 * decay - lrate * gTr * a3
            w4 = w4 * decay - lrate * gTr * a4
         NEXT
      NEXT
      $gW[0] = w0
      $gW[1] = w1
      $gW[2] = w2
      $gW[3] = w3
      $gW[4] = w4
      $gS[8] = 1
   ENDIF

   //-----(0b) Prediccion sobre la barra cerrada------------------------//
   IF $gS[8] = 1 THEN
      zNow = $gW[0] + $gW[1] * x1[1] + $gW[2] * x2[1] + $gW[3] * x3[1] + $gW[4] * x4[1]
      IF zNow > 30 THEN
         zNow = 30
      ENDIF
      IF zNow < 0 - 30 THEN
         zNow = 0 - 30
      ENDIF
      $gS[9] = 1 / (1 + exp(0 - zNow))
   ENDIF
   curProb = $gS[9]

   //-----(1) Bloques alcistas: test, acierto, fallo--------------------//
   bullWinSig = 0
   bullLosSig = 0
   IF nBull > 0 THEN
      FOR i = 1 TO nBull DO
         IF $buDn[i] = 0 THEN
            IF $buTst[i] = 0 AND pL <= $buTop[i] THEN
               $buTst[i] = 1
            ENDIF
            IF $buTst[i] = 1 AND pC > $buTop[i] THEN
               bullWin = bullWin + 1
               bullWinSig = 1
               $buDn[i] = 1
            ELSIF pC < $buBot[i] THEN
               bullLos = bullLos + 1
               bullLosSig = 1
               $buDn[i] = 1
            ENDIF
         ENDIF
      NEXT
   ENDIF

   //-----(1b) Bloques bajistas-----------------------------------------//
   bearWinSig = 0
   bearLosSig = 0
   IF nBear > 0 THEN
      FOR i = 1 TO nBear DO
         IF $beDn[i] = 0 THEN
            IF $beTst[i] = 0 AND pH >= $beBot[i] THEN
               $beTst[i] = 1
            ENDIF
            IF $beTst[i] = 1 AND pC < $beBot[i] THEN
               bearWin = bearWin + 1
               bearWinSig = 1
               $beDn[i] = 1
            ELSIF pC > $beTop[i] THEN
               bearLos = bearLos + 1
               bearLosSig = 1
               $beDn[i] = 1
            ENDIF
         ENDIF
      NEXT
   ENDIF

   //-----(2) Compactar: retirar los resueltos si asi se pide-----------//
   IF deleteOnBreak = 1 THEN
      wB = 0
      IF nBull > 0 THEN
         FOR i = 1 TO nBull DO
            IF $buDn[i] = 0 THEN
               wB = wB + 1
               $buTop[wB] = $buTop[i]
               $buBot[wB] = $buBot[i]
               $buX[wB] = $buX[i]
               $buPr[wB] = $buPr[i]
               $buTst[wB] = $buTst[i]
               $buDn[wB] = 0
            ENDIF
         NEXT
      ENDIF
      nBull = wB

      wS = 0
      IF nBear > 0 THEN
         FOR i = 1 TO nBear DO
            IF $beDn[i] = 0 THEN
               wS = wS + 1
               $beTop[wS] = $beTop[i]
               $beBot[wS] = $beBot[i]
               $beX[wS] = $beX[i]
               $bePr[wS] = $bePr[i]
               $beTst[wS] = $beTst[i]
               $beDn[wS] = 0
            ENDIF
         NEXT
      ENDIF
      nBear = wS
   ENDIF

   //-----(3) MSS alcista: nuevo order block----------------------------//
   mssBull = 0
   IF pC > highLH[2] AND close[2] <= highLH[3] THEN
      mssBull = 1
   ENDIF

   IF mssBull = 1 AND pIdx > swingLen * 2 + 2 THEN
      // Vela bajista con el minimo mas bajo de la ventana de ruptura.
      // El original arranca en la barra 1 sin comprobar que sea bajista:
      // aqui solo entran velas bajistas de verdad.
      lowIdx = 0
      lowVal = 0
      FOR i = 1 TO swingLen * 2 DO
         ofs = i + 1
         IF close[ofs] < open[ofs] THEN
            IF lowIdx = 0 OR low[ofs] < lowVal THEN
               lowIdx = i
               lowVal = low[ofs]
            ENDIF
         ENDIF
      NEXT

      IF lowIdx > 0 THEN
         seed = lowIdx + 1
         newTop = high[seed]
         newBot = low[seed]

         ovl = 0
         IF nBull > 0 THEN
            FOR i = 1 TO nBull DO
               IF newTop >= $buBot[i] AND newBot <= $buTop[i] THEN
                  ovl = 1
               ENDIF
            NEXT
         ENDIF
         IF nBear > 0 THEN
            FOR i = 1 TO nBear DO
               IF newTop >= $beBot[i] AND newBot <= $beTop[i] THEN
                  ovl = 1
               ENDIF
            NEXT
         ENDIF

         IF ovl = 0 THEN
            WHILE nBull >= maxBlocks DO
               FOR i = 1 TO nBull - 1 DO
                  $buTop[i] = $buTop[i+1]
                  $buBot[i] = $buBot[i+1]
                  $buX[i] = $buX[i+1]
                  $buPr[i] = $buPr[i+1]
                  $buTst[i] = $buTst[i+1]
                  $buDn[i] = $buDn[i+1]
               NEXT
               nBull = nBull - 1
            WEND
            nBull = nBull + 1
            $buTop[nBull] = newTop
            $buBot[nBull] = newBot
            $buX[nBull] = pIdx - lowIdx
            $buPr[nBull] = curProb
            $buTst[nBull] = 0
            $buDn[nBull] = 0
         ENDIF
      ENDIF
   ENDIF

   //-----(3b) MSS bajista: nuevo order block---------------------------//
   mssBear = 0
   IF pC < lowLL[2] AND close[2] >= lowLL[3] THEN
      mssBear = 1
   ENDIF

   IF mssBear = 1 AND pIdx > swingLen * 2 + 2 THEN
      highIdx = 0
      highVal = 0
      FOR i = 1 TO swingLen * 2 DO
         ofs = i + 1
         IF close[ofs] > open[ofs] THEN
            IF highIdx = 0 OR high[ofs] > highVal THEN
               highIdx = i
               highVal = high[ofs]
            ENDIF
         ENDIF
      NEXT

      IF highIdx > 0 THEN
         seed = highIdx + 1
         newTop = high[seed]
         newBot = low[seed]

         ovl = 0
         IF nBear > 0 THEN
            FOR i = 1 TO nBear DO
               IF newTop >= $beBot[i] AND newBot <= $beTop[i] THEN
                  ovl = 1
               ENDIF
            NEXT
         ENDIF
         IF nBull > 0 THEN
            FOR i = 1 TO nBull DO
               IF newTop >= $buBot[i] AND newBot <= $buTop[i] THEN
                  ovl = 1
               ENDIF
            NEXT
         ENDIF

         IF ovl = 0 THEN
            WHILE nBear >= maxBlocks DO
               FOR i = 1 TO nBear - 1 DO
                  $beTop[i] = $beTop[i+1]
                  $beBot[i] = $beBot[i+1]
                  $beX[i] = $beX[i+1]
                  $bePr[i] = $bePr[i+1]
                  $beTst[i] = $beTst[i+1]
                  $beDn[i] = $beDn[i+1]
               NEXT
               nBear = nBear - 1
            WEND
            nBear = nBear + 1
            $beTop[nBear] = newTop
            $beBot[nBear] = newBot
            $beX[nBear] = pIdx - highIdx
            $bePr[nBear] = 1 - curProb
            $beTst[nBear] = 0
            $beDn[nBear] = 0
         ENDIF
      ENDIF
   ENDIF

   //-----(4) Ring buffer de marcadores---------------------------------//
   // Un marcador por tipo y barra, como los plotshape del original.
   // Con drawonlastbaronly un dibujo en la barra del evento no sobrevive:
   // se guardan las coordenadas y se repintan todas en la ultima barra.
   markOff = atrRaw[1] * 0.35
   IF markOff <= 0 THEN
      markOff = (pH - pL) * 0.35
   ENDIF
   mkFlag = 0
   mrkY = 0
   mrkT = 0

   IF showMarkers = 1 THEN
      IF bullWinSig = 1 THEN
         mkFlag = 1
         mrkY = pL - markOff
         mrkT = 1
      ELSIF bullLosSig = 1 THEN
         mkFlag = 1
         mrkY = pL - markOff
         mrkT = 2
      ENDIF
   ENDIF
   IF mkFlag = 1 THEN
      WHILE nMark >= maxMarks DO
         FOR i = 1 TO nMark - 1 DO
            $mkX[i] = $mkX[i+1]
            $mkY[i] = $mkY[i+1]
            $mkT[i] = $mkT[i+1]
         NEXT
         nMark = nMark - 1
      WEND
      nMark = nMark + 1
      $mkX[nMark] = pIdx
      $mkY[nMark] = mrkY
      $mkT[nMark] = mrkT
   ENDIF

   mkFlag = 0
   IF showMarkers = 1 THEN
      IF bearWinSig = 1 THEN
         mkFlag = 1
         mrkY = pH + markOff
         mrkT = 3
      ELSIF bearLosSig = 1 THEN
         mkFlag = 1
         mrkY = pH + markOff
         mrkT = 4
      ENDIF
   ENDIF
   IF mkFlag = 1 THEN
      WHILE nMark >= maxMarks DO
         FOR i = 1 TO nMark - 1 DO
            $mkX[i] = $mkX[i+1]
            $mkY[i] = $mkY[i+1]
            $mkT[i] = $mkT[i+1]
         NEXT
         nMark = nMark - 1
      WEND
      nMark = nMark + 1
      $mkX[nMark] = pIdx
      $mkY[nMark] = mrkY
      $mkT[nMark] = mrkT
   ENDIF

   //-----Volcar estado-------------------------------------------------//
   $gS[1] = nBull
   $gS[2] = nBear
   $gS[3] = bullWin
   $gS[4] = bullLos
   $gS[5] = bearWin
   $gS[6] = bearLos
   $gS[7] = nMark
ENDIF

//-----(5) Render en la ultima barra (solo lee estado)------------------//
IF islastbarupdate THEN
   dBull = $gS[1]
   dBear = $gS[2]
   dMark = $gS[7]
   tShift = pointsize * tickShift
   rightX = barindex
   backX = barindex + depthShift

   IF dBull > 0 THEN
      FOR i = 1 TO dBull DO
         bTop = $buTop[i]
         bBot = $buBot[i]
         leftX = $buX[i]
         backL = leftX + depthShift
         // cara trasera primero, luego aristas, luego cara frontal
         DRAWRECTANGLE(backL, bTop + tShift, backX, bBot + tShift) COLOURED(bullR, bullG, bullB, 128) FILLCOLOR(bullR, bullG, bullB, 15)
         DRAWSEGMENT(leftX, bTop, backL, bTop + tShift) COLOURED(bullR, bullG, bullB, 153)
         DRAWSEGMENT(rightX, bTop, backX, bTop + tShift) COLOURED(bullR, bullG, bullB, 153)
         DRAWSEGMENT(leftX, bBot, backL, bBot + tShift) COLOURED(bullR, bullG, bullB, 153)
         DRAWSEGMENT(rightX, bBot, backX, bBot + tShift) COLOURED(bullR, bullG, bullB, 153)
         DRAWRECTANGLE(leftX, bTop, rightX, bBot) COLOURED(bullR, bullG, bullB, 255) FILLCOLOR(bullR, bullG, bullB, 38)
         IF showText = 1 THEN
            pvB = round($buPr[i] * 1000) / 10
            DRAWTEXT("Bullish OB (#pvB#%)", (leftX + rightX) / 2, (bTop + bBot) / 2) COLOURED(txtR, txtG, txtB, 255)
         ENDIF
      NEXT
   ENDIF

   IF dBear > 0 THEN
      FOR i = 1 TO dBear DO
         bTop = $beTop[i]
         bBot = $beBot[i]
         leftX = $beX[i]
         backL = leftX + depthShift
         DRAWRECTANGLE(backL, bTop + tShift, backX, bBot + tShift) COLOURED(bearR, bearG, bearB, 128) FILLCOLOR(bearR, bearG, bearB, 15)
         DRAWSEGMENT(leftX, bTop, backL, bTop + tShift) COLOURED(bearR, bearG, bearB, 153)
         DRAWSEGMENT(rightX, bTop, backX, bTop + tShift) COLOURED(bearR, bearG, bearB, 153)
         DRAWSEGMENT(leftX, bBot, backL, bBot + tShift) COLOURED(bearR, bearG, bearB, 153)
         DRAWSEGMENT(rightX, bBot, backX, bBot + tShift) COLOURED(bearR, bearG, bearB, 153)
         DRAWRECTANGLE(leftX, bTop, rightX, bBot) COLOURED(bearR, bearG, bearB, 255) FILLCOLOR(bearR, bearG, bearB, 38)
         IF showText = 1 THEN
            pvS = round($bePr[i] * 1000) / 10
            DRAWTEXT("Bearish OB (#pvS#%)", (leftX + rightX) / 2, (bTop + bBot) / 2) COLOURED(txtR, txtG, txtB, 255)
         ENDIF
      NEXT
   ENDIF

   IF showMarkers = 1 AND dMark > 0 THEN
      FOR i = 1 TO dMark DO
         IF $mkT[i] = 1 THEN
            DRAWTEXT("▲", $mkX[i], $mkY[i]) COLOURED(bullR, bullG, bullB, 255)
         ELSIF $mkT[i] = 2 THEN
            DRAWTEXT("✕", $mkX[i], $mkY[i]) COLOURED(bullR, bullG, bullB, 255)
         ELSIF $mkT[i] = 3 THEN
            DRAWTEXT("▼", $mkX[i], $mkY[i]) COLOURED(bearR, bearG, bearB, 255)
         ELSE
            DRAWTEXT("✕", $mkX[i], $mkY[i]) COLOURED(bearR, bearG, bearB, 255)
         ENDIF
      NEXT
   ENDIF

   //-----(6) Panel de win rate-----------------------------------------//
   IF showDash = 1 THEN
      wBull = $gS[3]
      lBull = $gS[4]
      wBear = $gS[5]
      lBear = $gS[6]
      tBull = wBull + lBull
      tBear = wBear + lBear
      tAll = tBull + tBear
      wAll = wBull + wBear

      rBull = 0
      IF tBull > 0 THEN
         rBull = round(wBull / tBull * 1000) / 10
      ENDIF
      rBear = 0
      IF tBear > 0 THEN
         rBear = round(wBear / tBear * 1000) / 10
      ENDIF
      rAll = 0
      IF tAll > 0 THEN
         rAll = round(wAll / tAll * 1000) / 10
      ENDIF
      pML = round($gS[9] * 1000) / 10
      xoffpan = 170
      DRAWTEXT("PROBABILISTIC ICT OB", 0 - xoffpan, 0 - 20, SansSerif, Bold, 11) COLOURED(dashR, dashG, dashB) ANCHOR(TOPRIGHT, XSHIFT, YSHIFT)
      DRAWTEXT("Bull OB win rate: #rBull#% (#tBull#)", 0 - xoffpan, 0 - 42, SansSerif, Standard, 10) COLOURED(bullR, bullG, bullB) ANCHOR(TOPRIGHT, XSHIFT, YSHIFT)
      DRAWTEXT("Bear OB win rate: #rBear#% (#tBear#)", 0 - xoffpan, 0 - 60, SansSerif, Standard, 10) COLOURED(bearR, bearG, bearB) ANCHOR(TOPRIGHT, XSHIFT, YSHIFT)
      DRAWTEXT("Overall win rate: #rAll#% (#tAll#)", 0 - xoffpan, 0 - 78, SansSerif, Bold, 10) COLOURED(dashR, dashG, dashB) ANCHOR(TOPRIGHT, XSHIFT, YSHIFT)
      DRAWTEXT("ML bull probability: #pML#%", 0 - xoffpan, 0 - 96, SansSerif, Standard, 10) COLOURED(dashR, dashG, dashB) ANCHOR(TOPRIGHT, XSHIFT, YSHIFT)
   ENDIF
ENDIF

RETURN
![[SMC] Clean Liquidity Heatmap](https://www.prorealcode.com/wp-content/uploads/2026/03/TSLA-Diario-3-150x150.png)