

Order Block and Fibonacci Extension
Introduction
This indicator brings two of the most widely used Smart-Money concepts together in a single tool: Order Blocks and a real-time Fibonacci retracement anchored to the last meaningful block. It detects the candle that precedes an impulsive move (the order block), draws it as a zone that automatically extends until price comes back to mitigate it, and overlays a live Fibonacci grid on the most recent block that is still active.
Theory Behind the Indicator
What is an Order Block
An order block is the last opposite-coloured candle before an impulsive sequence. The reasoning behind the concept: institutions accumulate a position inside a tight area before pushing price away from it; that last candle marks the footprint of that accumulation. Price often returns to that zone later to “mitigate” the remaining resting orders before continuing in the impulse direction.
The detection logic is purely structural:
lastDown = close[barsReq] < open[barsReq]   // candidate is a down candle
lastUp   = close[barsReq] > open[barsReq]   // candidate is an up candle
A bullish order block is confirmed when the candidate (the candle barsReq bars ago) is bearish and is followed by barsReq consecutive bullish candles. The zone of that bearish candle (its high and low) becomes the bullish OB. The mirror logic produces a bearish order block.
Two optional gates refine the detection:
percGain— the move measured from the OB extreme to the current close must exceed a minimum percentage. Computed per side (gainBullfor bullish blocks,gainBearfor bearish ones), so the magnitude filter is never contaminated by the opposite direction. Default0disables it.volFilter— when enabled, the order-block candle must trade at leastvolMulttimes the 20-bar average volume. Genuine institutional candles tend to print abnormal volume, so this filters out cosmetic blocks.
The opposites flag adds a regime constraint: when set, two consecutive blocks of the same colour are not allowed, forcing the indicator to alternate bullish/bearish — a more selective behaviour.
Auto-Mitigation and the Active / Broken State
Each detected block is stored and drawn as a rectangle starting at its formation bar. Its right edge is not fixed: for every block the code walks forward from its creation looking for the first candle that closes inside the block:
// bullish block: first candle that closes below its top "breaks" it
if close[k] < $ObBullTop[i] then
    x2 = barindex - k
    broken = 1
    break
endif
If such a candle exists, the rectangle stops there and the block is flagged broken (mitigated). If no candle violates the block, the rectangle extends to the current bar and the block stays active. Active blocks are painted in solid green/red; broken blocks are dimmed to light grey, so the chart instantly communicates which zones are still in play.
To keep the chart readable, only the most recent maxOBs blocks per side are rendered — years of history no longer flood the screen with stale boxes.
The Real-Time Fibonacci Layer
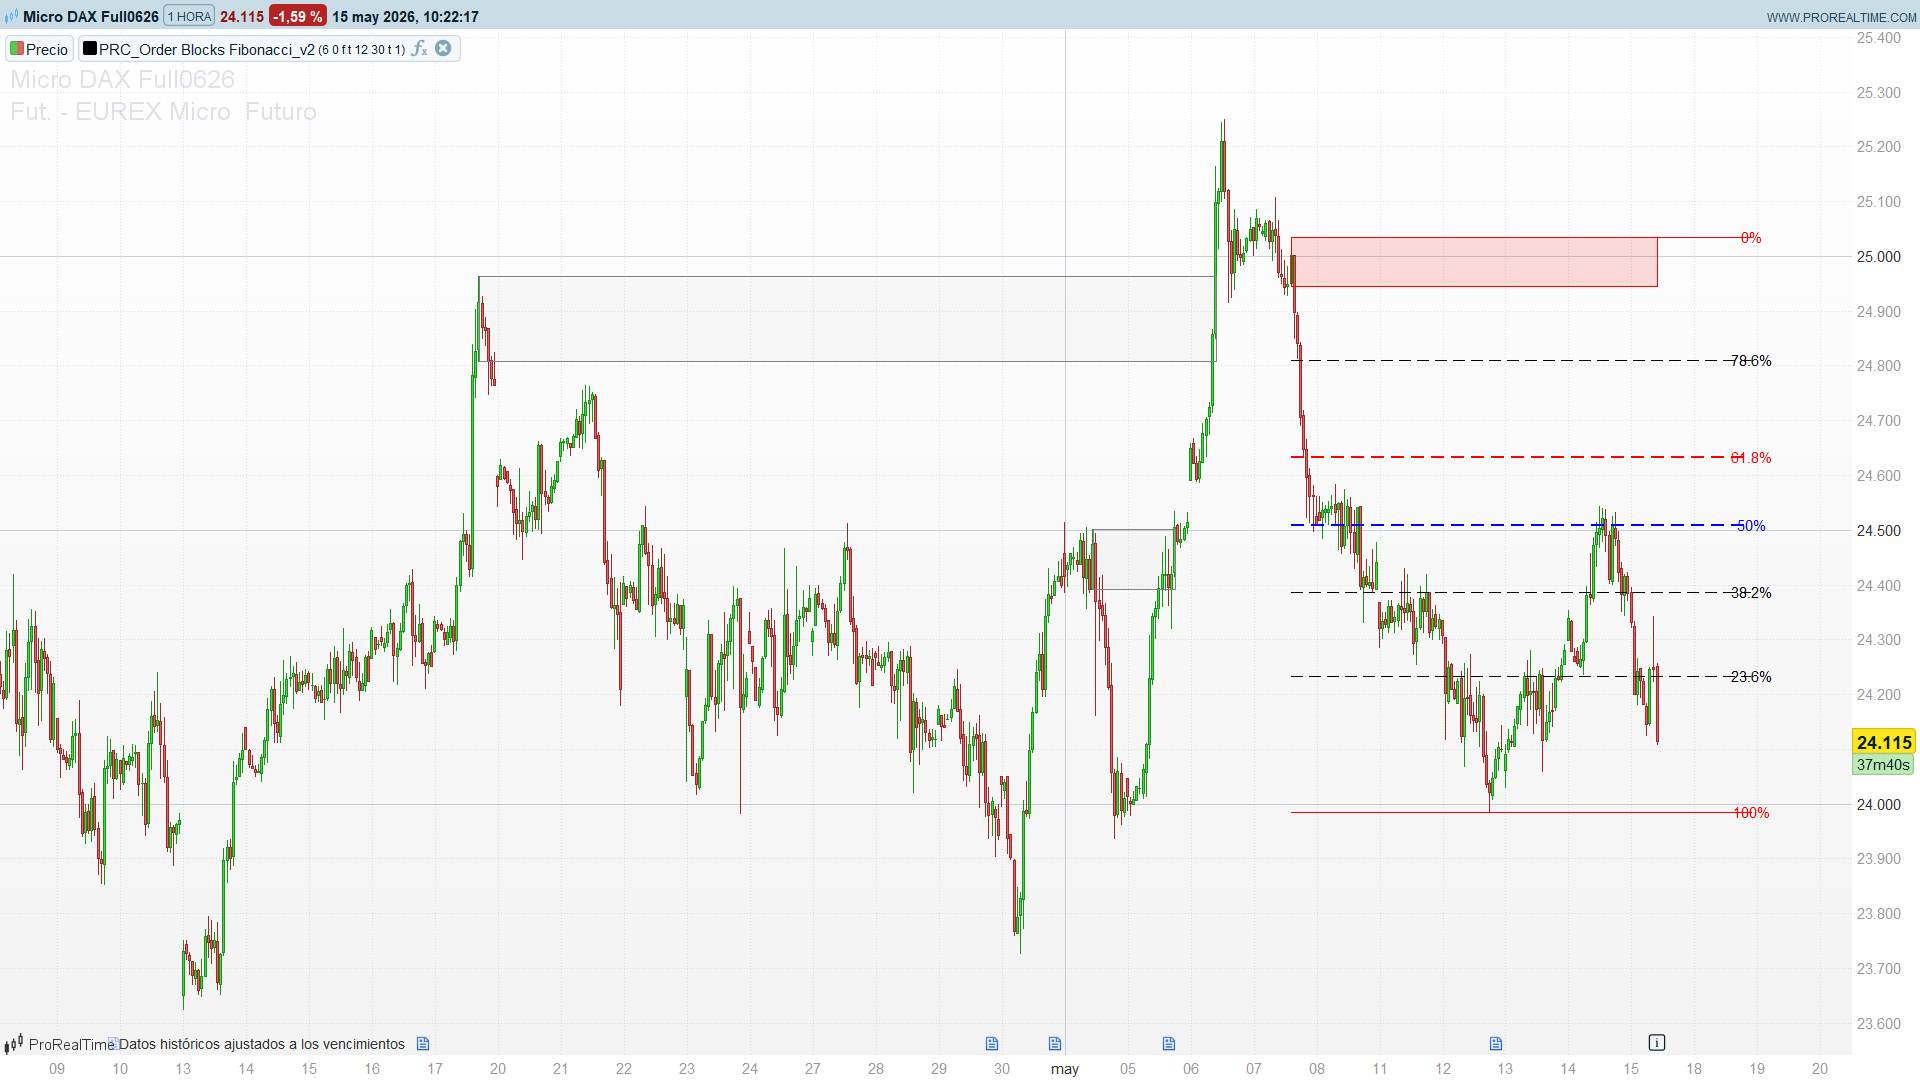
The indicator draws a Fibonacci retracement on the most recent block that is still active (not simply the last block formed — the last one may already be broken). Whichever active block is more recent in time, bullish or bearish, wins the grid.
For a bullish block:
lev0  = highest(high) since the block formed     // 100% — the swing extreme
lev1  = OB bottom                                 // 0%  — the order block
fibTotal = lev0 - lev1
lev618 = lev0 - fibTotal * 0.618                   // golden retracement
The 0 / 23.6 / 38.2 / 50 / 61.8 / 78.6 / 100 levels are projected from the order block to the extreme reached since its formation, every level is labelled, and the whole grid is extended extendBars bars to the right of the block on both bullish and bearish sides (the v1 only extended the bullish side). A guard skips the drawing when the block was created on the current bar, avoiding an undefined highest[0].
Key Features at a Glance
FeatureBehaviourOB detectionOpposite candle followed by barsReq impulse candlesMagnitude filterPer-side gainBull / gainBear vs percGainVolume filterOptional — OB candle volume vs volMult× SMA(20)Auto-mitigationBox extends until a close violates the blockState colouringActive = solid green/red, Broken = faded greyOn-screen limitLast maxOBs blocks per sideFibonacciLive grid on the most recent active blockFib labels0 / 23.6 / 38.2 / 50 / 61.8 / 78.6 / 100 %Alternation modeopposites forces bull/bear alternation
How to Read the Indicator
- Solid boxes are live. A green box is an unmitigated bullish order block — a demand zone where price has not returned yet. A red box is an unmitigated supply zone. Grey boxes have already been tested and carry far less weight.
- Watch for mitigation. Price returning into a solid block is the textbook setup: the block is being tested. A reaction away from it confirms the zone; a clean close through it turns the box grey and invalidates it.
- Use the Fibonacci grid for entries. When the active block aligns with the trend, the
50and61.8(golden) levels of the live grid are the natural pull-back entry zone. The0line marks the order block itself; the100line marks the swing target reached so far. - Confluence is the edge. The strongest setups appear when a solid order block sits on top of the
61.8–78.6retracement of the active leg — structure and ratio agreeing on the same price. oppositesfor cleaner charts. Turn it on to keep only alternating blocks if the default mode prints too many same-side zones in strong trends.
Practical Applications
- Mitigation entries. Wait for price to return into a solid order block in the direction of the higher-timeframe trend, and use a reaction candle as the trigger with the stop just beyond the block.
- Golden-zone pull-backs. Combine the order block with the live
61.8Fibonacci level; enter on confluence, target the0/100extremes of the grid. - Trend filter for systems. Allow long setups only while the most recent active block is bullish (and vice-versa) — an objective structural regime filter.
- Volume-validated blocks. Enable
volFilterfor instruments with reliable volume (futures, stocks) to keep only blocks born on abnormal participation. - Multi-timeframe mapping. Run the indicator on the daily to map the dominant blocks, then drop to the intraday chart to time the mitigation inside those zones.
Indicator Configuration
| `barsReq` | 6 | Consecutive opposite candles required after the OB candle |
| `percGain` | 0.0 | Minimum % impulse from the OB extreme (0 = filter off) |
| `opposites` | 0 | Boolean. Require blocks to alternate bull/bear |
| `showFib` | 1 | Boolean. Draw the Fibonacci grid on the most recent active OB |
| `maxOBs` | 12 | Maximum number of blocks displayed per side |
| `extendBars` | 20 | Bars the Fibonacci lines extend beyond the block's right edge |
| `volFilter` | 0 | Boolean. Require above-average volume on the OB candle |
| `volMult` | 1.5 | Volume multiplier vs the 20-bar average (used if `volFilter`=1) |
The volume reference is a fixed 20-bar simple average; edit the average[20](volume) line if a different lookback is preferred. The Fibonacci ratios are hard-coded to the classical set and can be changed inside the rendering block.
Code
//--------------------------------------------------------//
//PRC_Order Blocks & Fibonacci
//version = 2
//2026-05-15
//Iván González @ www.prorealcode.com
//Sharing ProRealTime knowledge
//--------------------------------------------------------//
defparam drawonlastbaronly = true
//-----Inputs---------------------------------------------//
barsReq=6//Consecutive Bars Required
percGain=0.0//Percent Gain Required
opposites=0//Boolean//Require Opposite Order Block
showFib=1//Boolean//Draw Fibonacci on most recent active OB
maxOBs=12//Max OBs displayed per side
extendBars=20//Bars to extend Fib lines beyond OB
volFilter=0//Boolean//Require above-average volume on OB candle
volMult=1.5//Volume multiplier vs 20-bar average
//--------------------------------------------------------//
once bu=0
once be=0
once z=0
once t=0
//-----Calculations---------------------------------------//
gainBull=abs(low[barsReq]-close)/low[barsReq]*100
gainBear=abs(high[barsReq]-close)/high[barsReq]*100

lastDown=close[barsReq]<open[barsReq]
lastUp=close[barsReq]>open[barsReq]

barsCount1=0
if lastDown then
   for i=0 to barsReq-1 do
      if close[i]>open[i] then
         barsCount1=barsCount1+1
      endif
   next
endif
barsCount=0
if lastUp then
   for j=0 to barsReq-1 do
      if close[j]<open[j] then
         barsCount=barsCount+1
      endif
   next
endif

volOK=1
if volFilter then
   refVol=average[20](volume)
   if volume[barsReq]<refVol[barsReq]*volMult then
      volOK=0
   endif
endif
//-----Conditions-----------------------------------------//
if opposites then
   bullish=lastDown and barsCount1>=barsReq and gainBull>=percGain and volOK and not bu
   bearish=lastUp and barsCount>=barsReq and gainBear>=percGain and volOK and not be
else
   bullish=lastDown and barsCount1>=barsReq and gainBull>=percGain and volOK
   bearish=lastUp and barsCount>=barsReq and gainBear>=percGain and volOK
endif
//-----Append new OBs-------------------------------------//
if bullish then
   bu=1
   be=0
   z=z+1
   $ObBullTop[z]=high[barsReq]
   $ObBullBot[z]=low[barsReq]
   $ObBullX[z]=barindex[barsReq]
endif

if bearish then
   bu=0
   be=1
   t=t+1
   $ObBearTop[t]=high[barsReq]
   $ObBearBot[t]=low[barsReq]
   $ObBearX[t]=barindex[barsReq]
endif
//-----Rendering (last bar only)--------------------------//
if islastbarupdate then
   firstBull=z-maxOBs+1
   if firstBull<1 then
      firstBull=1
   endif
   firstBear=t-maxOBs+1
   if firstBear<1 then
      firstBear=1
   endif

   //-----Bullish OBs--------------------------------------//
   for i=firstBull to z do
      broken=0
      x2=barindex
      limK=barindex-$ObBullX[i]-barsReq-1
      if limK<0 then
         limK=0
      endif
      for k=limK downto 0 do
         if close[k]<$ObBullTop[i] then
            x2=barindex-k
            broken=1
            break
         endif
      next
      $ObBullX2[i]=x2
      $ObBullBroken[i]=broken
      if broken then
         drawrectangle($ObBullX[i],$ObBullBot[i],x2,$ObBullTop[i])coloured("gray")fillcolor("gray",10)
      else
         drawrectangle($ObBullX[i],$ObBullBot[i],x2,$ObBullTop[i])coloured("green")fillcolor("green",35)
      endif
   next

   //-----Bearish OBs--------------------------------------//
   for j=firstBear to t do
      brokenB=0
      x2b=barindex
      limW=barindex-$ObBearX[j]-barsReq-1
      if limW<0 then
         limW=0
      endif
      for w=limW downto 0 do
         if close[w]>$ObBearTop[j] then
            x2b=barindex-w
            brokenB=1
            break
         endif
      next
      $ObBearX2[j]=x2b
      $ObBearBroken[j]=brokenB
      if brokenB then
         drawrectangle($ObBearX[j],$ObBearBot[j],x2b,$ObBearTop[j])coloured("gray")fillcolor("gray",10)
      else
         drawrectangle($ObBearX[j],$ObBearBot[j],x2b,$ObBearTop[j])coloured("red")fillcolor("red",35)
      endif
   next

   //-----Fibonacci on most recent ACTIVE OB---------------//
   if showFib then
      lastActiveBull=0
      for i=z downto firstBull do
         if $ObBullBroken[i]=0 then
            lastActiveBull=i
            break
         endif
      next
      lastActiveBear=0
      for j=t downto firstBear do
         if $ObBearBroken[j]=0 then
            lastActiveBear=j
            break
         endif
      next

      drawBullFib=0
      drawBearFib=0
      if lastActiveBull>0 and lastActiveBear>0 then
         if $ObBullX[lastActiveBull]>$ObBearX[lastActiveBear] then
            drawBullFib=1
         else
            drawBearFib=1
         endif
      else
         if lastActiveBull>0 then
            drawBullFib=1
         else
            if lastActiveBear>0 then
               drawBearFib=1
            endif
         endif
      endif

      if drawBullFib then
         barsFibBull=barindex-$ObBullX[lastActiveBull]
         if barsFibBull>0 then
            lev0bu=highest[barsFibBull](high)
            lev1bu=$ObBullBot[lastActiveBull]
            fibTotalbu=lev0bu-lev1bu
            lev236bu=lev0bu-(fibTotalbu*0.236)
            lev382bu=lev0bu-(fibTotalbu*0.382)
            lev50bu=lev0bu-(fibTotalbu*0.500)
            lev618bu=lev0bu-(fibTotalbu*0.618)
            lev786bu=lev0bu-(fibTotalbu*0.786)
            xL=$ObBullX[lastActiveBull]
            xR=$ObBullX2[lastActiveBull]+extendBars
            drawsegment(xL,lev0bu,xR,lev0bu)style(line)coloured("green")
            drawsegment(xL,lev236bu,xR,lev236bu)style(dottedline2)
            drawsegment(xL,lev382bu,xR,lev382bu)style(dottedline2)
            drawsegment(xL,lev50bu,xR,lev50bu)style(dottedline2,2)coloured("blue")
            drawsegment(xL,lev618bu,xR,lev618bu)style(dottedline2,2)coloured("red")
            drawsegment(xL,lev786bu,xR,lev786bu)style(dottedline2)
            drawsegment(xL,lev1bu,xR,lev1bu)style(line)coloured("green")
            drawtext("100%",xR,lev0bu)coloured("green")
            drawtext("78.6%",xR,lev786bu)
            drawtext("61.8%",xR,lev618bu)coloured("red")
            drawtext("50%",xR,lev50bu)coloured("blue")
            drawtext("38.2%",xR,lev382bu)
            drawtext("23.6%",xR,lev236bu)
            drawtext("0%",xR,lev1bu)coloured("green")
         endif
      endif

      if drawBearFib then
         barsFibBear=barindex-$ObBearX[lastActiveBear]
         if barsFibBear>0 then
            lev0be=lowest[barsFibBear](low)
            lev1be=$ObBearTop[lastActiveBear]
            fibTotalbe=lev1be-lev0be
            lev236be=lev0be+(fibTotalbe*0.236)
            lev382be=lev0be+(fibTotalbe*0.382)
            lev50be=lev0be+(fibTotalbe*0.500)
            lev618be=lev0be+(fibTotalbe*0.618)
            lev786be=lev0be+(fibTotalbe*0.786)
            xL=$ObBearX[lastActiveBear]
            xR=$ObBearX2[lastActiveBear]+extendBars
            drawsegment(xL,lev0be,xR,lev0be)style(line)coloured("red")
            drawsegment(xL,lev236be,xR,lev236be)style(dottedline2)
            drawsegment(xL,lev382be,xR,lev382be)style(dottedline2)
            drawsegment(xL,lev50be,xR,lev50be)style(dottedline2,2)coloured("blue")
            drawsegment(xL,lev618be,xR,lev618be)style(dottedline2,2)coloured("red")
            drawsegment(xL,lev786be,xR,lev786be)style(dottedline2)
            drawsegment(xL,lev1be,xR,lev1be)style(line)coloured("red")
            drawtext("100%",xR,lev0be)coloured("red")
            drawtext("78.6%",xR,lev786be)
            drawtext("61.8%",xR,lev618be)coloured("red")
            drawtext("50%",xR,lev50be)coloured("blue")
            drawtext("38.2%",xR,lev382be)
            drawtext("23.6%",xR,lev236be)
            drawtext("0%",xR,lev1be)coloured("red")
         endif
      endif
   endif
endif
return
