

Price Action Toolkit
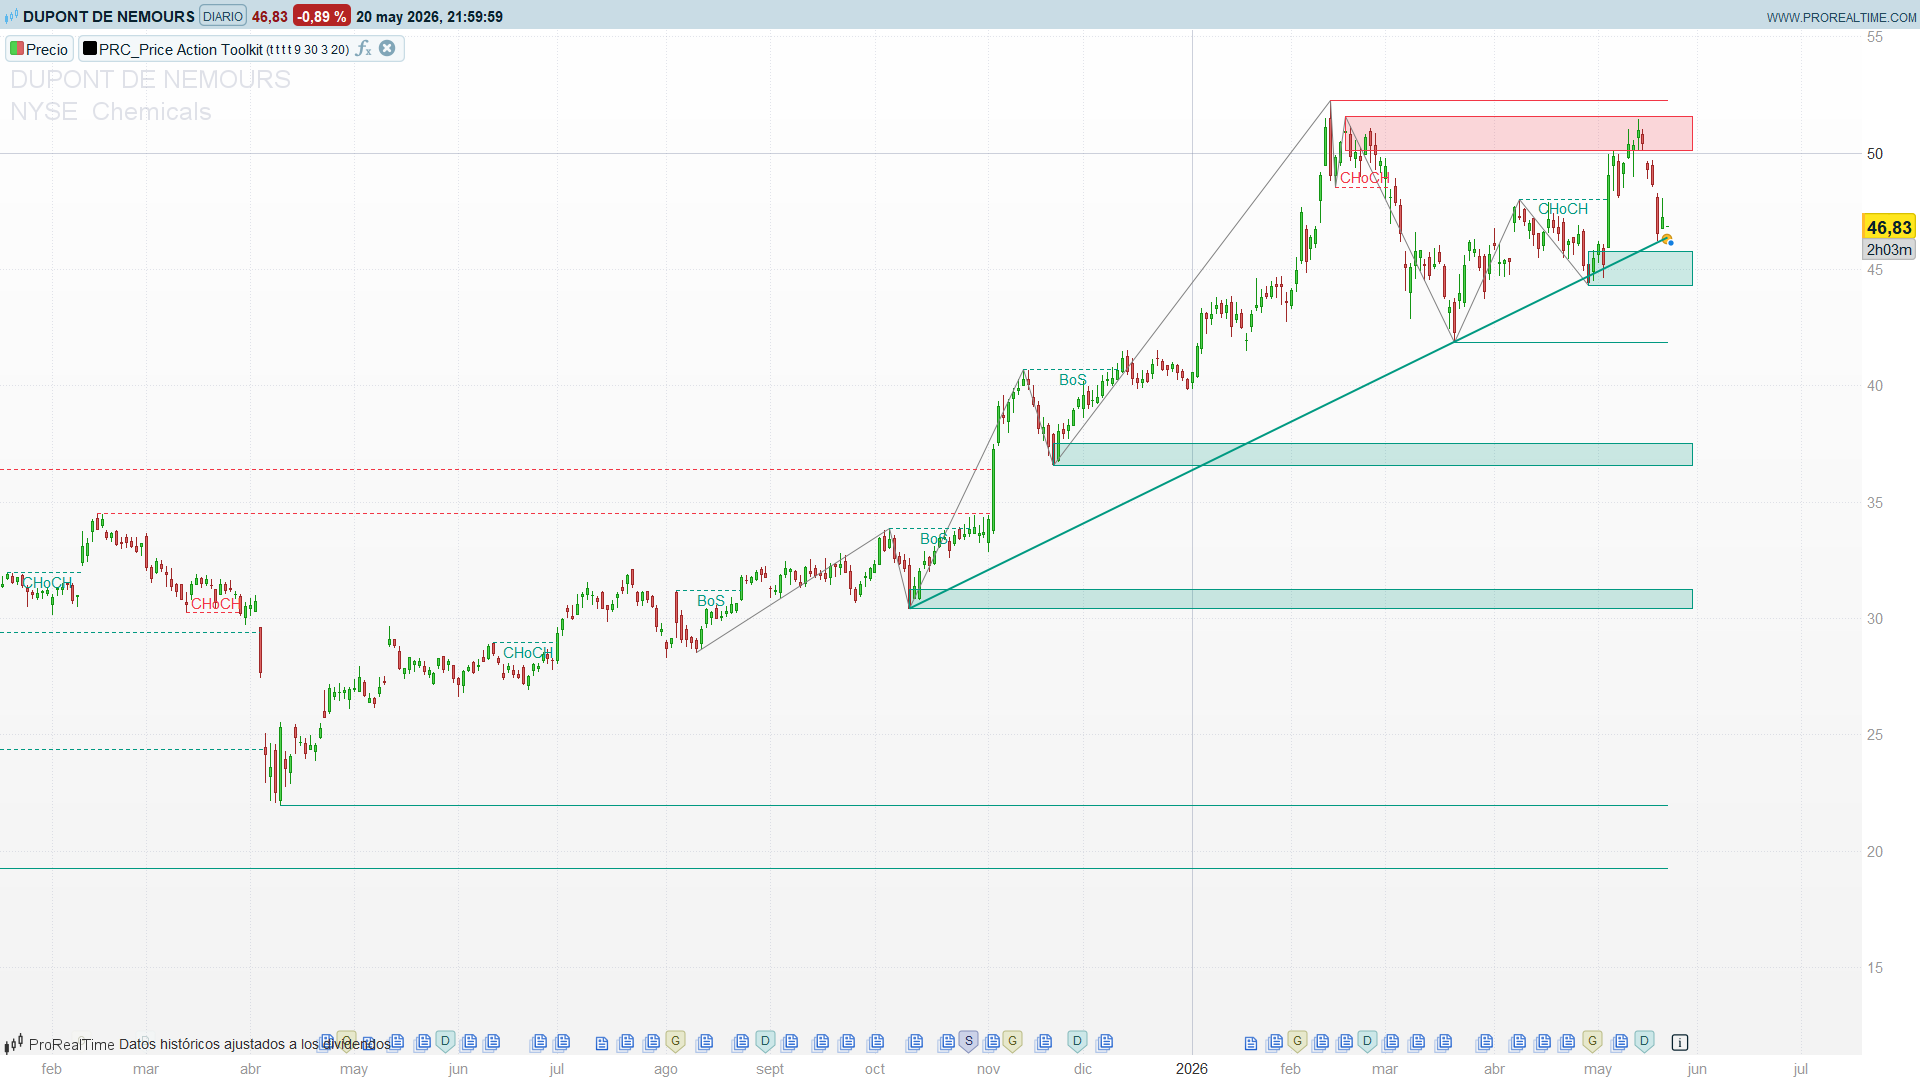
UAlgo’s Price Action Toolkit is one of those indicators that puts every flavour of modern price-action analysis into a single overlay: zig-zag market structure with CHoCH and BoS labels, horizontal liquidity levels with sweep detection, ATR-sized order blocks and dynamically-drawn trend lines.
Theory Behind the Indicator
The toolkit groups four well-known price-action concepts under one roof. Each one is driven by a different pivot detector and a different state machine, but all four sit on top of the same trendDir zig-zag.
1. Market Structure — Zig-Zag, CHoCH and BoS
The structural engine is a unilateral zig-zag with confirmation window zzLen = 9. A bar at offset zzLen is recognised as a swing high when its high is the maximum of the previous zzLen bars; mirrored for swing lows. Swings alternate via a state variable trendDir (1 = up, −1 = down) that flips whenever a swing of the opposite type appears. The flip is detected on the bar it happens with trendChanged = (trendDir <> trendDir[1]).
On top of that zig-zag, the indicator classifies every close-through of the most recent swing into one of two cases via a second state variable stateDir:
- CHoCH (Change of Character) — the break goes against the previous bias, or appears from a neutral state. The structure is changing direction.
- BoS (Break of Structure) — the break continues the previous bias. The structure is being confirmed.
A horizontal dotted segment is drawn at the broken level, coloured by direction (teal = bullish break, red = bearish break), and a small CHoCH or BoS label is placed at the midpoint of that segment, offset by 0.3 × ATR to keep it readable.
2. Liquidity — Active, Broken and Swept
Independent of the zig-zag, the toolkit detects liquidity pivots with a different geometry: a centred / symmetric window of length 2·liqLen + 1 (where liqLen = 30). A bar at offset liqLen is a liquidity high when its high equals the maximum of the window centred on it, and the same with mirroring for liquidity lows.
Each detected pivot becomes a horizontal segment with three possible states:
- Active — the level has not been touched. Drawn as a solid line, coloured red (bearish liquidity above price) or teal (bullish liquidity below).
- Broken — price has pierced the level. The line stops at the bar of the break and is redrawn as a dotted segment.
- Swept — special case of “broken”: price crossed the level but closed back on the original side. This is a liquidity grab (mecha that runs the stops and reverses). It gets the same dotted line as a regular break plus a small x marker in violet at the sweep bar.
The sweep distinction is the most useful information in this module — it separates a clean breakout from a liquidity raid, two visually similar events with very different intent.
3. Order Blocks — The Extreme Candle of the Move
An order block is created at every structural break. The logic is: look back across the entire range from the broken swing to the current bar, and pick the candle whose extreme (highest high for bearish breaks, lowest low for bullish breaks) capped the move. That candle becomes the anchor of an ATR-tall box, drawn semi-transparent in the direction of the eventual break.
Each block is tagged with whether it has subsequently been broken (a close on the opposite side); only unbroken blocks are shown, capped at maxOBShow = 3 per side. The display loop iterates the array in reverse to keep the most recent blocks visible.
4. Trend Lines — Two Pivots, One Direction Filter
The trend lines connect the last two pivot highs (bearish line) or last two pivot lows (bullish line) detected with the same centred geometry as the liquidity module, but tighter sensitivity (tlSens = 20). Each new pivot shifts the “previous” slot into the “second-previous” slot — the classic valuewhen pattern of keeping the two most recent occurrences.
The line is extended linearly from its starting pivot all the way to the current bar via point-and-slope:
extVal = endVal + slope · (barindex − endBar)
…and it is only drawn if the slope has the right sign: bearish lines need slope < 0, bullish lines need slope > 0. This filter is what stops the indicator from drawing nonsensical lines through unrelated pivots (e.g. a bearish line that slopes up because the second pivot is higher than the first).
Key Features at a Glance
| Module | Pivot geometry | Output | Toggle |
|---|---|---|---|
| Market Structure | Unilateral zig-zag (`zzLen = 9`) | CHoCH / BoS labels + dotted break line | `showMS = 1` |
| Liquidity | Centred (`2 · liqLen + 1 = 61`) | Active / broken / swept horizontal lines | `showLiq = 1` |
| Order Blocks | Derived from MS module | ATR-tall semi-transparent boxes | `showOB = 1` |
| Trend Lines | Centred (`2 · tlSens + 1 = 41`) | Linearly-projected diagonal lines | `showTL = 1` |
All four modules can be turned off independently to keep the chart legible; the cost of evaluation is mostly spent on the modules whose toggle is on, since the per-module computation blocks check the toggle before populating arrays.
How to Read the Indicator
- The zig-zag (grey thin segments) is context. It tells you the swing skeleton the rest of the toolkit hangs from. It is not a signal.
- A CHoCH is a regime change. If you were trading the previous swing direction, a CHoCH is the first signal to stand down. A BoS is a continuation — useful for adding to a position, not for initiating a new one.
- The break line (dotted, horizontal) is the level price just pierced, drawn from the broken swing to the bar that broke it. The line is information, not a signal — it shows you what price had to defeat to get the label.
- Active liquidity (solid line) is unfinished business. Most liquidity gets either broken or swept; an active level sitting close to price tends to attract attention.
- A swept liquidity (dotted line + x marker) is the most actionable signal in the indicator. It says: price ran the stops, then reversed. The bar of the x is the sweep bar; the trade idea — if you trade them — is on the close that confirms the reversal.
- Order blocks are zones, not levels. Use them as decision regions for entries and stops: a long that retraces into a bullish OB and rejects upwards is a textbook setup; one that closes through the OB invalidates the block (the box would also stop being drawn on subsequent bars, since the indicator only shows unbroken blocks).
- Trend lines are slope-filtered. A bearish trend line means the last two pivot highs are descending — i.e. there is actually a downtrend in the highs. If you do not see a line, the geometry is not there. This is by design.
Practical Applications
- SMC entry framework. Wait for an LTF (lower-timeframe) CHoCH against the HTF bias to qualify a reversal; let the resulting order block fill on a retrace; enter on a close inside the block; stop on a close through.
- Sweep-and-reverse trades. Use the active liquidity lines as targets / triggers. When an x appears (a sweep), evaluate the very next close: a close confirming the side that swept is a high-probability mean-reversion entry, especially when it lands inside an opposite-side order block.
- Trend-line break confluences. A bullish trend line breaking down at the same place as a bearish CHoCH gives you two independent signals pointing the same way. Wait for both before acting; either alone tends to be noisier.
- Multi-module sanity check. Run all four modules simultaneously and look for agreement. If price is breaking a CHoCH bearish, sweeping bullish liquidity below, sitting under a bearish trend line and producing a bearish order block all at once, the structural read is unanimous. If only one module fires, treat it as weak evidence.
Indicator Configuration
| Parameter | Default | Description |
|---|---|---|
| `showMS` | 1 | Toggle Market Structure module (CHoCH/BoS labels and break lines) |
| `showLiq` | 1 | Toggle Liquidity module (active/broken/swept horizontal lines) |
| `showOB` | 1 | Toggle Order Block module (ATR-tall semi-transparent boxes) |
| `showTL` | 1 | Toggle Trend Lines module (slope-filtered diagonals) |
| `zzLen` | 9 | Zig-zag confirmation length (bars) |
| `liqLen` | 30 | Half-window for centred liquidity pivots (full window = `2 · liqLen + 1 = 61` bars) |
| `maxOBShow` | 3 | Maximum unbroken order blocks displayed per side |
| `tlSens` | 20 | Half-window for centred trend-line pivots (full window = `2 · tlSens + 1 = 41` bars) |
| `bR / bG / bB` | 0 / 153 / 129 | Bullish colour (teal) |
| `sR / sG / sB` | 242 / 54 / 69 | Bearish colour (red) |
Code
//--------------------------------------------
// PRC_Price Action Toolkit (by UAlgo)
// version = 0
// 17.03.2026
// Iván González @ www.prorealcode.com
// Sharing ProRealTime knowledge
//--------------------------------------------
defparam drawonlastbaronly = true
//--------------------------------------------
// ── PARAMETERS ──
//--------------------------------------------
// Toggle modules: 1=show, 0=hide
showMS = 1
showLiq = 1
showOB = 1
showTL = 1
// Settings
zzLen = 9
liqLen = 30
maxOBShow = 3
tlSens = 20
// ── COLORS (RGB) ──
// Bullish: teal
bR = 0
bG = 153
bB = 129
// Bearish: red
sR = 242
sG = 54
sB = 69
//--------------------------------------------
// CALCULATION SECTION
//--------------------------------------------
myATR = averagetruerange[14](close)
// ── STATE VARIABLES ──
once trendDir = 1
once drewUp = 0
once drewDown = 0
once stateDir = 0
once swCount = 0
once msCount = 0
once obCount = 0
once blCount = 0
once ulCount = 0
once lastSHPrice = -1
once lastSHBar = -1
once lastSLPrice = -1
once lastSLBar = -1
// ── ZIGZAG TREND DETECTION ──
toUp = 0
toDown = 0
if barindex >= 2 * zzLen then
   if high[zzLen] >= highest[zzLen](high) then
      toUp = 1
   endif
   if low[zzLen] <= lowest[zzLen](low) then
      toDown = 1
   endif
endif
// Trend flip
if trendDir = 1 and toDown = 1 then
   trendDir = -1
elsif trendDir = -1 and toUp = 1 then
   trendDir = 1
endif
if barindex > zzLen then
   trendChanged = (trendDir <> trendDir[1])
else
   trendChanged = 0
endif
// ── NEW SWING HIGH (trend flipped from -1 to 1) ──
if trendChanged and trendDir = 1 then
   lastSHPrice = high[zzLen]
   lastSHBar = barindex - zzLen
   $swBar[swCount] = barindex - zzLen
   $swPrice[swCount] = high[zzLen]
   $swType[swCount] = 1
   swCount = swCount + 1
   drewUp = 0
endif
// ── NEW SWING LOW (trend flipped from 1 to -1) ──
if trendChanged and trendDir = -1 then
   lastSLPrice = low[zzLen]
   lastSLBar = barindex - zzLen
   $swBar[swCount] = barindex - zzLen
   $swPrice[swCount] = low[zzLen]
   $swType[swCount] = -1
   swCount = swCount + 1
   drewDown = 0
endif
// ── BEARISH BREAK (close < last swing low) ──
if lastSLPrice > 0 and drewDown = 0 then
   if close < lastSLPrice then
      if stateDir = 0 or stateDir = 1 then
         mType = 1
      else
         mType = 2
      endif
      stateDir = -1
      drewDown = 1

      // Store CHoCH/BoS label
      $msBar[msCount] = round((lastSLBar + barindex) / 2)
      $msPrice[msCount] = lastSLPrice
      $msType[msCount] = mType
      $msDir[msCount] = -1
      $msLineBar1[msCount] = lastSLBar
      $msLineBar2[msCount] = barindex
      msCount = msCount + 1

      // Bearish Order Block: highest candle in the range
      if showOB = 1 then
         dist = barindex - lastSLBar
         maxVal = -1
         obLoc = barindex
         if dist > 0 then
            for i = 0 to dist do
               if high[i] > maxVal then
                  maxVal = high[i]
                  obLoc = barindex - i
               endif
            next
         else
            maxVal = high
            obLoc = barindex
         endif
         $obVal[obCount] = maxVal
         $obBar[obCount] = obLoc
         $obSide[obCount] = -1
         $obBrk[obCount] = 0
         $obATR[obCount] = myATR
         obCount = obCount + 1
      endif
   endif
endif
// ── BULLISH BREAK (close > last swing high) ──
if lastSHPrice > 0 and drewUp = 0 then
   if close > lastSHPrice then
      if stateDir = 0 or stateDir = -1 then
         mType = 1
      else
         mType = 2
      endif
      stateDir = 1
      drewUp = 1

      // Store CHoCH/BoS label
      $msBar[msCount] = round((lastSHBar + barindex) / 2)
      $msPrice[msCount] = lastSHPrice
      $msType[msCount] = mType
      $msDir[msCount] = 1
      $msLineBar1[msCount] = lastSHBar
      $msLineBar2[msCount] = barindex
      msCount = msCount + 1

      // Bullish Order Block: lowest candle in the range
      if showOB = 1 then
         dist = barindex - lastSHBar
         minVal = 999999999
         obLoc = barindex
         if dist > 0 then
            for i = 0 to dist do
               if low[i] < minVal then
                  minVal = low[i]
                  obLoc = barindex - i
               endif
            next
         else
            minVal = low
            obLoc = barindex
         endif
         $obVal[obCount] = minVal
         $obBar[obCount] = obLoc
         $obSide[obCount] = 1
         $obBrk[obCount] = 0
         $obATR[obCount] = myATR
         obCount = obCount + 1
      endif
   endif
endif
// ── UPDATE ORDER BLOCKS (mark broken) ──
if obCount > 0 then
   for i = 0 to obCount - 1 do
      if $obBrk[i] = 0 then
         if $obSide[i] = 1 and close < $obVal[i] then
            $obBrk[i] = 1
         elsif $obSide[i] = -1 and close > $obVal[i] then
            $obBrk[i] = 1
         endif
      endif
   next
endif
// ── LIQUIDITY DETECTION ──
if barindex >= 2 * liqLen and showLiq = 1 then
   // Bearish liquidity (pivot high)
   if high[liqLen] = highest[2 * liqLen + 1](high) then
      $blVal[blCount] = high[liqLen]
      $blBar[blCount] = barindex - liqLen
      $blBrk[blCount] = 0
      $blBrkBar[blCount] = 0
      $blSwept[blCount] = 0
      $blSwBar[blCount] = 0
      blCount = blCount + 1
   endif

   // Bullish liquidity (pivot low)
   if low[liqLen] = lowest[2 * liqLen + 1](low) then
      $ulVal[ulCount] = low[liqLen]
      $ulBar[ulCount] = barindex - liqLen
      $ulBrk[ulCount] = 0
      $ulBrkBar[ulCount] = 0
      $ulSwept[ulCount] = 0
      $ulSwBar[ulCount] = 0
      ulCount = ulCount + 1
   endif
endif

// ── UPDATE LIQUIDITY (detect sweeps) ──
if blCount > 0 then
   for i = 0 to blCount - 1 do
      if $blBrk[i] = 0 then
         if high > $blVal[i] then
            $blBrk[i] = 1
            $blBrkBar[i] = barindex
            if close < $blVal[i] then
               $blSwept[i] = 1
               $blSwBar[i] = barindex
            endif
         endif
      endif
   next
endif

if ulCount > 0 then
   for i = 0 to ulCount - 1 do
      if $ulBrk[i] = 0 then
         if low < $ulVal[i] then
            $ulBrk[i] = 1
            $ulBrkBar[i] = barindex
            if close > $ulVal[i] then
               $ulSwept[i] = 1
               $ulSwBar[i] = barindex
            endif
         endif
      endif
   next
endif

// ── TREND LINES (valuewhen pattern) ──
once tlBearEnd = -1
once tlBearEndVal = 0
once tlBearStart = -1
once tlBearStartVal = 0
once tlBullEnd = -1
once tlBullEndVal = 0
once tlBullStart = -1
once tlBullStartVal = 0

if barindex >= 2 * tlSens and showTL = 1 then
   if high[tlSens] = highest[2 * tlSens + 1](high) then
      tlBearStart = tlBearEnd
      tlBearStartVal = tlBearEndVal
      tlBearEnd = barindex - tlSens
      tlBearEndVal = high[tlSens]
   endif
   if low[tlSens] = lowest[2 * tlSens + 1](low) then
      tlBullStart = tlBullEnd
      tlBullStartVal = tlBullEndVal
      tlBullEnd = barindex - tlSens
      tlBullEndVal = low[tlSens]
   endif
endif

//--------------------------------------------
// DRAWING SECTION
//--------------------------------------------
if islastbarupdate then

   // ── ZIGZAG SEGMENTS (last 10 swings) ──
   if showMS = 1 and swCount >= 2 then
      startSw = max(0, swCount - 11)
      for i = startSw to swCount - 2 do
         drawsegment($swBar[i], $swPrice[i], $swBar[i + 1], $swPrice[i + 1]) coloured(128, 128, 128) style(line, 1)
      next
   endif

   // ── MARKET STRUCTURE LABELS (last 10) ──
   if showMS = 1 and msCount > 0 then
      startMs = max(0, msCount - 10)
      for i = startMs to msCount - 1 do
         // Horizontal break line (colored by direction)
         if $msDir[i] = -1 then
            drawsegment($msLineBar1[i], $msPrice[i], $msLineBar2[i], $msPrice[i]) coloured(sR, sG, sB) style(dottedline, 1)
         else
            drawsegment($msLineBar1[i], $msPrice[i], $msLineBar2[i], $msPrice[i]) coloured(bR, bG, bB) style(dottedline, 1)
         endif

         atrOff = myATR * 0.3
         // CHoCH bearish
         if $msType[i] = 1 and $msDir[i] = -1 then
            drawtext("CHoCH", $msBar[i], $msPrice[i] + atrOff) coloured(sR, sG, sB)
         endif
         // CHoCH bullish
         if $msType[i] = 1 and $msDir[i] = 1 then
            drawtext("CHoCH", $msBar[i], $msPrice[i] - atrOff) coloured(bR, bG, bB)
         endif
         // BoS bearish
         if $msType[i] = 2 and $msDir[i] = -1 then
            drawtext("BoS", $msBar[i], $msPrice[i] + atrOff) coloured(sR, sG, sB)
         endif
         // BoS bullish
         if $msType[i] = 2 and $msDir[i] = 1 then
            drawtext("BoS", $msBar[i], $msPrice[i] - atrOff) coloured(bR, bG, bB)
         endif
      next
   endif

   // ── ORDER BLOCKS (last N unbroken per side) ──
   if showOB = 1 and obCount > 0 then
      bullShown = 0
      bearShown = 0
      for j = 0 to obCount - 1 do
         i = obCount - 1 - j
         if $obBrk[i] = 0 then
            if $obSide[i] = 1 and bullShown < maxOBShow then
               drawrectangle($obBar[i], $obVal[i], barindex + 5, $obVal[i] + $obATR[i]) coloured(bR, bG, bB) fillcolor(bR, bG, bB, 50)
               bullShown = bullShown + 1
            endif
            if $obSide[i] = -1 and bearShown < maxOBShow then
               drawrectangle($obBar[i], $obVal[i] - $obATR[i], barindex + 5, $obVal[i]) coloured(sR, sG, sB) fillcolor(sR, sG, sB, 50)
               bearShown = bearShown + 1
            endif
         endif
         if bullShown >= maxOBShow and bearShown >= maxOBShow then
            break
         endif
      next
   endif

   // ── LIQUIDITY LINES ──
   if showLiq = 1 then
      // Bearish liquidity (active = solid, broken = dashed)
      blShown = 0
      blBrkShown = 0
      if blCount > 0 then
         for j = 0 to blCount - 1 do
            i = blCount - 1 - j
            if $blBrk[i] = 0 and blShown < 7 then
               drawsegment($blBar[i], $blVal[i], barindex, $blVal[i]) coloured(sR, sG, sB) style(line, 1)
               blShown = blShown + 1
            endif
            if $blBrk[i] = 1 and blBrkShown < 7 then
               drawsegment($blBar[i], $blVal[i], $blBrkBar[i], $blVal[i]) coloured(sR, sG, sB) style(dottedline, 1)
               if $blSwept[i] = 1 then
                  drawtext("x", $blSwBar[i], $blVal[i] + myATR * 0.2) coloured(156, 39, 176)
               endif
               blBrkShown = blBrkShown + 1
            endif
         next
      endif

      // Bullish liquidity (active = solid, broken = dashed)
      ulShown = 0
      ulBrkShown = 0
      if ulCount > 0 then
         for j = 0 to ulCount - 1 do
            i = ulCount - 1 - j
            if $ulBrk[i] = 0 and ulShown < 7 then
               drawsegment($ulBar[i], $ulVal[i], barindex, $ulVal[i]) coloured(bR, bG, bB) style(line, 1)
               ulShown = ulShown + 1
            endif
            if $ulBrk[i] = 1 and ulBrkShown < 7 then
               drawsegment($ulBar[i], $ulVal[i], $ulBrkBar[i], $ulVal[i]) coloured(bR, bG, bB) style(dottedline, 1)
               if $ulSwept[i] = 1 then
                  drawtext("x", $ulSwBar[i], $ulVal[i] - myATR * 0.2) coloured(0, 128, 128)
               endif
               ulBrkShown = ulBrkShown + 1
            endif
         next
      endif
   endif

   // ── TREND LINES ──
   if showTL = 1 then
      // Bearish trend line (connecting last 2 pivot highs)
      if tlBearStart > 0 and tlBearEnd > tlBearStart then
         tlBearSlope = (tlBearEndVal - tlBearStartVal) / (tlBearEnd - tlBearStart)
         if tlBearSlope < 0 then
            tlBearExtVal = tlBearEndVal + tlBearSlope * (barindex - tlBearEnd)
            drawsegment(tlBearStart, tlBearStartVal, barindex, tlBearExtVal) coloured(sR, sG, sB) style(line, 2)
         endif
      endif

      // Bullish trend line (connecting last 2 pivot lows)
      if tlBullStart > 0 and tlBullEnd > tlBullStart then
         tlBullSlope = (tlBullEndVal - tlBullStartVal) / (tlBullEnd - tlBullStart)
         if tlBullSlope > 0 then
            tlBullExtVal = tlBullEndVal + tlBullSlope * (barindex - tlBullEnd)
            drawsegment(tlBullStart, tlBullStartVal, barindex, tlBullExtVal) coloured(bR, bG, bB) style(line, 2)
         endif
      endif
   endif

endif
//--------------------------------------------
return
