Dual RSI + Order Block Detector
Introduction
Two ideas that are usually kept in separate windows are stitched together here. The first is a dual-RSI momentum trigger: a fast RSI and a slow RSI, and the moment the fast one crosses the slow one — provided it is coming out of an extreme — is read as a shift in momentum. The second is a volume-based order block engine, the LuxAlgo-style detector that marks the candles where an unusual volume pivot printed and projects them forward as institutional supply and demand zones. On their own each is useful; the point of combining them is the optional filter that only lets an RSI signal through when price is actually sitting inside an order block of the right side.
Theory Behind the Indicator
1. The dual-RSI trigger
Instead of the usual “RSI crosses 30/70” the indicator uses two RSIs of different speeds. A fast RSI (default length 5) reacts quickly; a slow RSI (default length 14) is the smoother reference. The crossover of the two is the momentum event:
- Buy: the fast RSI crosses above the slow RSI, and the fast RSI has been below the oversold level (default 25) at some point in the last lookback bars (default 3).
- Sell: the fast RSI crosses below the slow RSI, and the fast RSI has been above the overbought level (default 75) in the last lookback bars.
The lookback condition is what keeps the signal honest: a crossover in the middle of the range is ignored; only crossovers that happen as momentum snaps back from an extreme are taken. It is a mean-reversion-into-momentum trigger, not a raw crossover.
2. The volume order block engine
This is the LuxAlgo detector. Rather than looking for price pivots, it looks for volume pivots: a bar whose volume stands out as a local peak versus the length bars on each side (default 5). When such a pivot is confirmed, the bar that produced it becomes an order block, and its side is decided by a running swing-direction state os:
- If the recent structure was bullish (os = 1), a bullish order block is drawn — a demand zone from the pivot’s midpoint down to its low.
- If the recent structure was bearish (os = 0), a bearish order block is drawn — a supply zone from the pivot’s high down to its midpoint.
Each block is a box that extends to the right until price mitigates it. Mitigation can be measured two ways, chosen by the mitigation input: by wick (the block dies as soon as a wick pierces it) or by close (the block survives until price closes beyond it). The indicator keeps the last bull_ext_last / bear_ext_last active blocks per side on screen (default 3 each), with a dotted midline marking the block’s average.
3. The confluence filter
The optional useOBFilter is what makes this more than two indicators sharing a pane. With it on, an RSI buy is only shown if the signal candle is tapping an active bullish order block (its range overlaps the zone), and an RSI sell only if it taps an active bearish block. The logic is momentum reversal at a level that matters — a fast/slow RSI crossover out of oversold, happening exactly where volume once printed a demand zone. With the filter off (the default) every qualifying RSI crossover is shown.
How to Read the Indicator
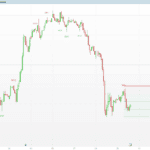
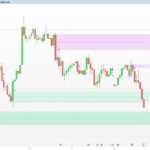
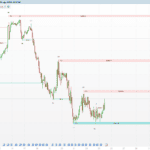
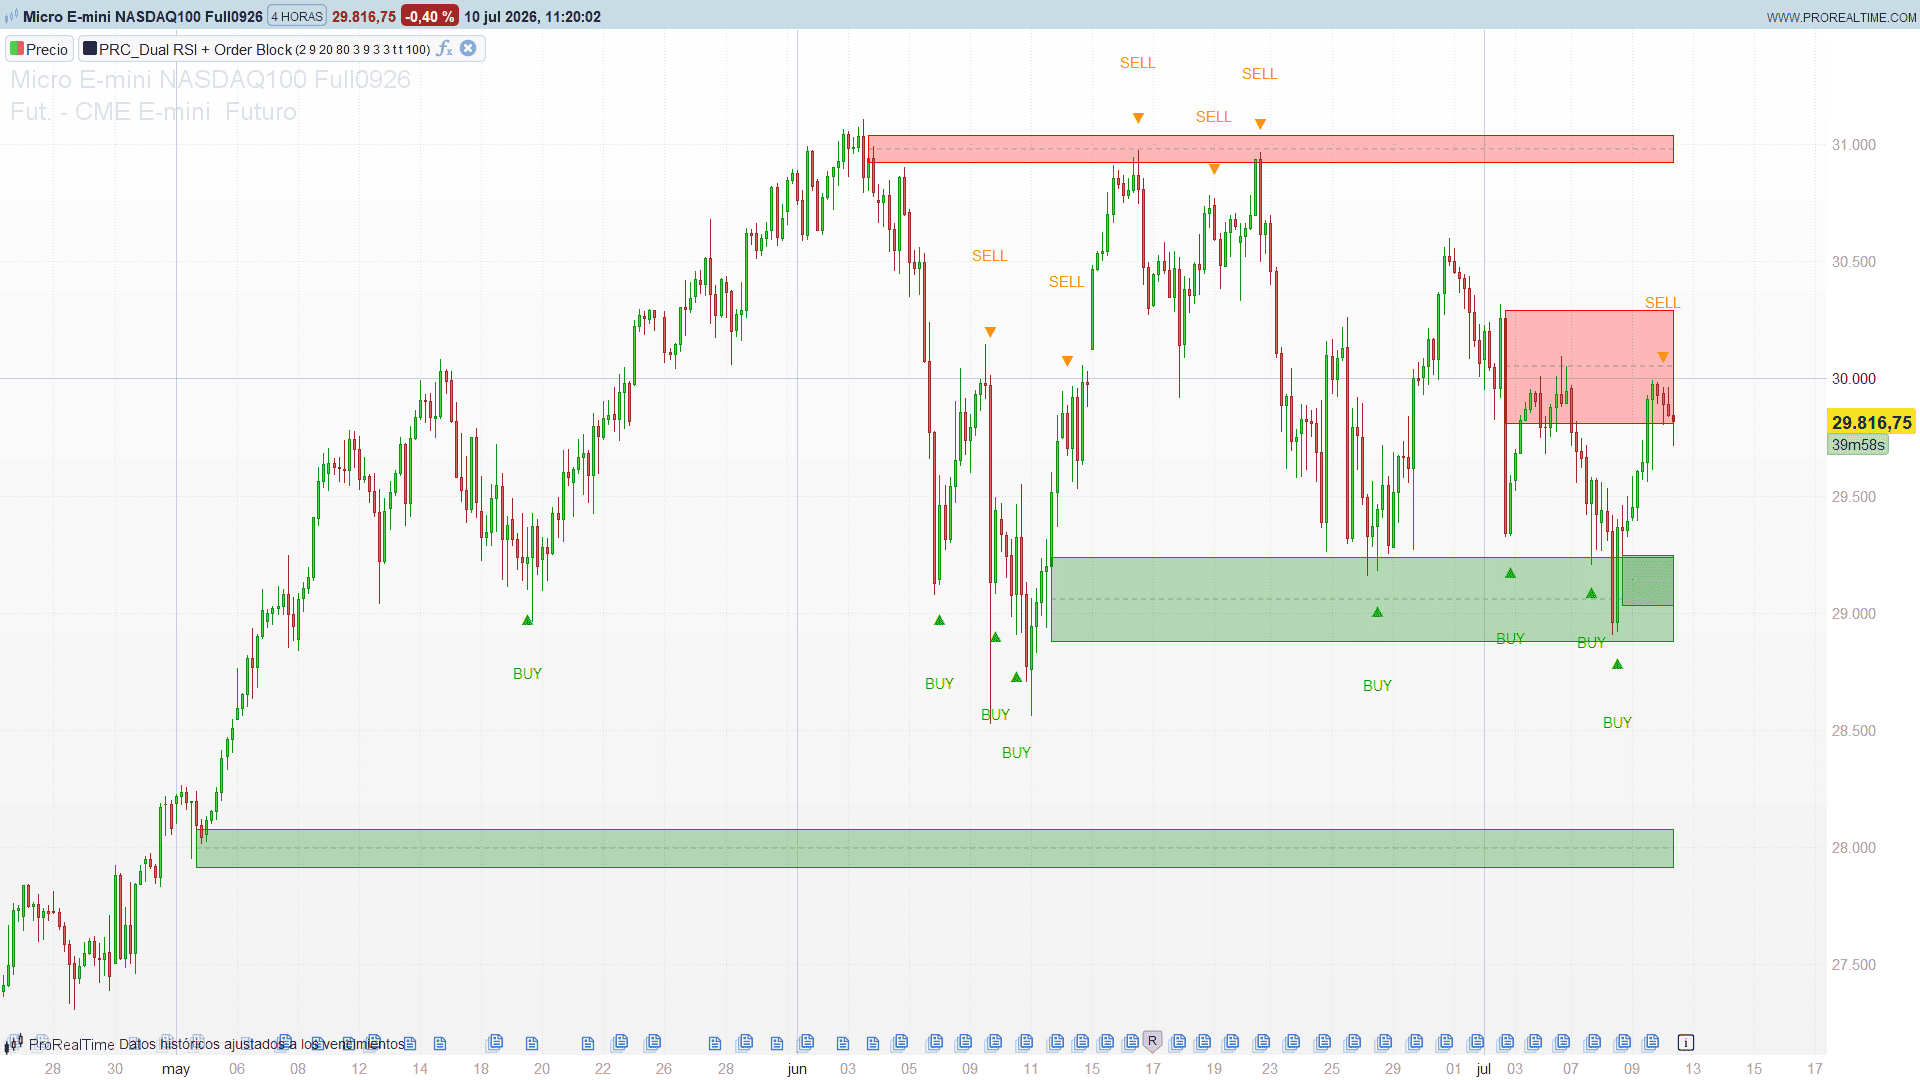
- Green and red boxes are the order blocks. Green = bullish (demand), red = bearish (supply). Each extends right until price mitigates it; the dotted grey line is the block’s midpoint.
- BUY / SELL arrows are the momentum triggers. A green ▲ below the bar is a fast-over-slow RSI crossover out of oversold; an orange ▼ above the bar is the mirror image out of overbought.
- Confluence is the high-value read. An arrow that fires inside a same-side box is momentum turning at a volume level — the setup the filter is built to isolate.
- Wick vs close changes the block lifetime. In wick mode blocks are fragile (a single spike kills them); in close mode they persist longer.
Practical Applications
- Zone-confirmed entries. Turn useOBFilter on and treat the filtered arrows as pullback entries: momentum reversing exactly at a demand/supply zone, rather than anywhere on the chart.
- Context for discretionary trading. Even with the filter off, the boxes give you the levels and the arrows give you the timing — a buy arrow approaching an untested green block is a different proposition from one in open space.
- Exit / stop reference. The bottom of a bullish block (or the top of a bearish one) is a natural invalidation level for a trade taken on its arrow.
- Regime awareness. Clusters of same-side blocks that keep holding map the side the volume is defending; arrows against that grain deserve more scepticism.
Indicator Configuration
- fastLength (default 5): fast RSI length.
- slowLength (default 14): slow RSI length — the smoother reference the fast one crosses.
- oversoldLevel / overboughtLevel (default 25 / 75): the extremes the fast RSI must have visited for a signal to qualify.
- lookback (default 3): how many bars back the oversold/overbought condition is allowed to have occurred.
- length (default 5): volume-pivot length. Higher = fewer, more significant order blocks.
- bullExtLast / bearExtLast (default 3): how many active blocks of each side to keep on screen (and to test in the filter).
- mitigation (default 0): 0 = Wick, 1 = Close. How a block is considered mitigated.
- useOBFilter (default 0): 0 = off (show every RSI signal), 1 = on (only signals tapping a same-side block).
- scanBack (default 100): performance cap — how many recent blocks the engine keeps mitigating and filtering against.
The indicator must be applied on the price chart (overlay).
Code
//----------------------------------------------------------------------//
//PRC_Dual RSI + Order Block Detector
//version = 0
//10.07.26
//Ivan Gonzalez @ www.prorealcode.com
//Sharing ProRealTime knowledge
//----------------------------------------------------------------------//
//-----Settings RSI-----------------------------------------------------//
fastLength = 5       //Fast RSI Length
slowLength = 14      //Slow RSI Length
oversoldLevel = 25   //Oversold Level
overboughtLevel = 75 //Overbought Level
lookback = 3         //Lookback bars for O/S - O/B condition
//-----Settings Order Blocks--------------------------------------------//
length = 5           //Volume Pivot Length
bullExtLast = 3      //Bullish OB shown
bearExtLast = 3      //Bearish OB shown
mitigation = 0       //0=Wick 1=Close
useOBFilter = 0      //0=Off 1=On (RSI signal only when price taps an OB)
scanBack = 100       //Active-OB tracking window (perf cap)
//----------------------------------------------------------------------//
once nbull = 0
once nbear = 0
//-----RSI signals------------------------------------------------------//
src = close
fastRSI = rsi[fastLength](src)
slowRSI = rsi[slowLength](src)

wasOversold = lowest[lookback](fastRSI) < oversoldLevel
wasOverbought = highest[lookback](fastRSI) > overboughtLevel

buySignal = (fastRSI crosses over slowRSI) and wasOversold
sellSignal = (fastRSI crosses under slowRSI) and wasOverbought
//-----Order Blocks: swing state----------------------------------------//
upper = highest[length](high)
lower = lowest[length](low)

if mitigation = 1 then
   targetBull = lowest[length](close)
   targetBear = highest[length](close)
else
   targetBull = lower
   targetBear = upper
endif

if high[length] > upper then
   os = 0
elsif low[length] < lower then
   os = 1
else
   os = os[1]
endif
//-----Volume pivot high (confirmed length bars back)-------------------//
newPivot = 0
if volume < volume[length] and highest[length](volume) < volume[length] and volume[length] > highest[length](volume)[length+1] then
   newPivot = 1
endif
//-----Create order blocks----------------------------------------------//
if newPivot = 1 and os = 1 then
   $bullTop[nbull] = (high[length]+low[length])/2
   $bullBtm[nbull] = low[length]
   $bullAvg[nbull] = ((high[length]+low[length])/2+low[length])/2
   $bullLeft[nbull] = barindex-length
   $bullAct[nbull] = 1
   nbull = nbull+1
endif

if newPivot = 1 and os = 0 then
   $bearTop[nbear] = high[length]
   $bearBtm[nbear] = (high[length]+low[length])/2
   $bearAvg[nbear] = ((high[length]+low[length])/2+high[length])/2
   $bearLeft[nbear] = barindex-length
   $bearAct[nbear] = 1
   nbear = nbear+1
endif
//-----Mitigation (bar by bar, capped window)---------------------------//
if nbull > 0 then
   startBull = max(0, nbull-scanBack)
   for i = startBull to nbull-1 do
      if $bullAct[i] = 1 and targetBull < $bullBtm[i] then
         $bullAct[i] = 0
      endif
   next
endif

if nbear > 0 then
   startBear = max(0, nbear-scanBack)
   for i = startBear to nbear-1 do
      if $bearAct[i] = 1 and targetBear > $bearTop[i] then
         $bearAct[i] = 0
      endif
   next
endif
//-----OB filter (bar by bar): candle taps a recent active OB?----------//
inBullOB = 0
inBearOB = 0
if useOBFilter = 1 then
   cnt = 0
   if nbull > 0 then
      loBull = max(0, nbull-scanBack)
      for i = nbull-1 downto loBull do
         if $bullAct[i] = 1 then
            if low <= $bullTop[i] and high >= $bullBtm[i] then
               inBullOB = 1
            endif
            cnt = cnt+1
            if cnt >= bullExtLast then
               break
            endif
         endif
      next
   endif
   cnt = 0
   if nbear > 0 then
      loBear = max(0, nbear-scanBack)
      for i = nbear-1 downto loBear do
         if $bearAct[i] = 1 then
            if low <= $bearTop[i] and high >= $bearBtm[i] then
               inBearOB = 1
            endif
            cnt = cnt+1
            if cnt >= bearExtLast then
               break
            endif
         endif
      next
   endif
endif
//-----Final signals (optional OB filter)-------------------------------//
if useOBFilter = 1 then
   showBuy = buySignal and (inBullOB = 1)
   showSell = sellSignal and (inBearOB = 1)
else
   showBuy = buySignal
   showSell = sellSignal
endif
//-----Draw RSI signals (arrows at the event bar)-----------------------//
atrOff = averagetruerange[14]
if showBuy then
   drawtext("▲", barindex, low-atrOff*0.5) coloured(0,180,0)
   drawtext("BUY", barindex, low-atrOff*1.4) coloured(0,180,0)
endif
if showSell then
   drawtext("▼", barindex, high+atrOff*0.5) coloured(255,140,0)
   drawtext("SELL", barindex, high+atrOff*1.4) coloured(255,140,0)
endif
//-----Draw order blocks (last bar only)--------------------------------//
if islastbarupdate then
   cnt = 0
   if nbull > 0 then
      for i = nbull-1 downto 0 do
         if $bullAct[i] = 1 then
            drawrectangle($bullLeft[i], $bullTop[i], barindex, $bullBtm[i]) coloured("green") fillcolor("green",70)
            drawsegment($bullLeft[i], $bullAvg[i], barindex, $bullAvg[i]) coloured("grey",70) style(dottedline,2)
            cnt = cnt+1
            if cnt >= bullExtLast then
               break
            endif
         endif
      next
   endif
   cnt = 0
   if nbear > 0 then
      for i = nbear-1 downto 0 do
         if $bearAct[i] = 1 then
            drawrectangle($bearLeft[i], $bearTop[i], barindex, $bearBtm[i]) coloured("red") fillcolor("red",70)
            drawsegment($bearLeft[i], $bearAvg[i], barindex, $bearAvg[i]) coloured("grey",70) style(dottedline,2)
            cnt = cnt+1
            if cnt >= bearExtLast then
               break
            endif
         endif
      next
   endif
endif

return
![Probabilistic ICT Order Blocks [3D]](https://www.prorealcode.com/wp-content/uploads/2026/08/EURUSDXXXX-1-hora-150x150.png)