







Breakout and Retest Signals
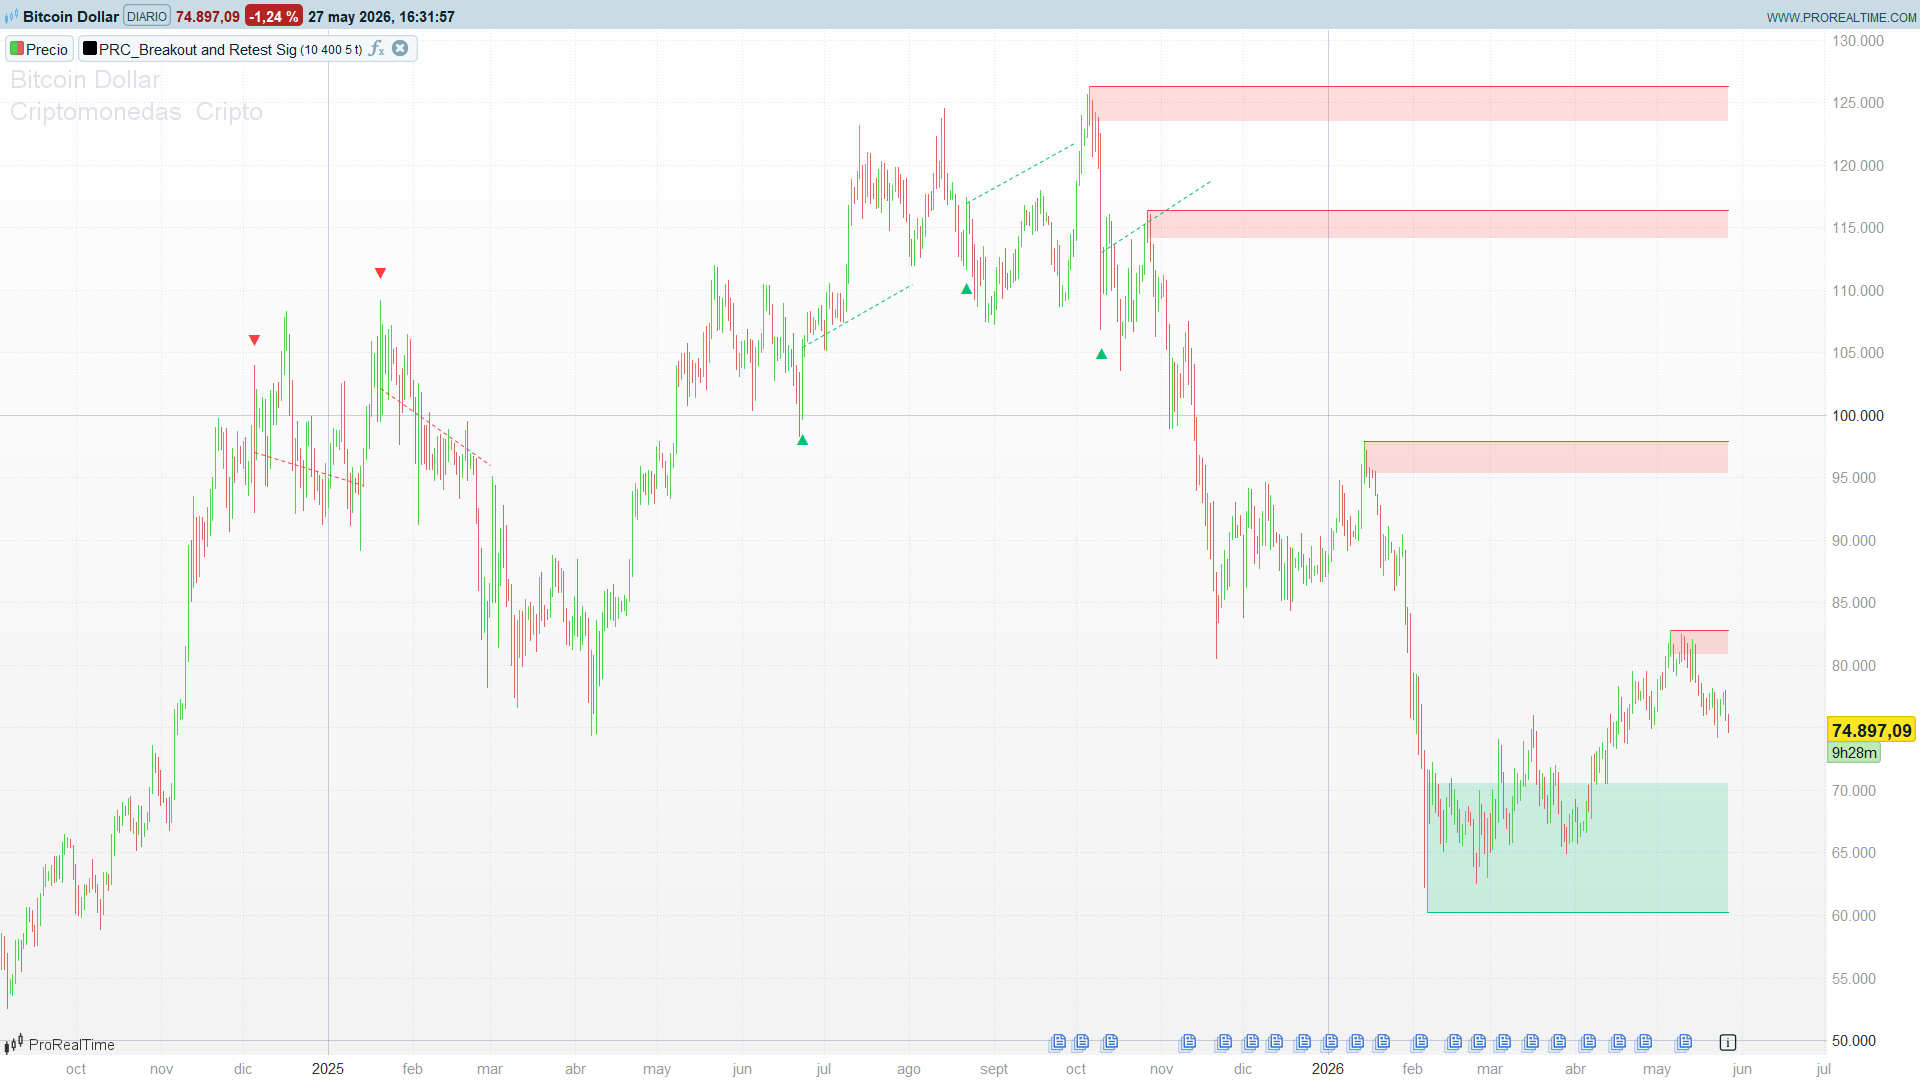
The Breakout and Retest Signals indicator, originally written by FloAlgo, is a price-action engine built around one very specific behaviour: a liquidity sweep followed by an immediate reclaim. Around every confirmed swing point it builds a demand or supply zone, then waits for price to spike through the zone’s extreme wick and close back inside the originating candle’s body. That sequence — stop-hunt then rejection — is what the indicator flags as a high-quality breakout-and-retest signal, complete with a measured-move target.
It is not a moving-average crossover dressed up as structure. The zones are anchored to the wick of the swing candle (the real liquidity pocket where stops rest) and the signal explicitly requires the wick to be violated and then denied on the close. Clean breaks that simply close through the level invalidate the zone instead of signalling — exactly the opposite of a naive breakout indicator.
Theory Behind the Indicator
Zone construction
On every confirmed pivot the indicator stores the geometry of the pivot candle:
- Demand zone (born on a swing low): top = body high of the pivot candle, bottom = the wick low. The wick low is the extreme — the liquidity level.
- Supply zone (born on a swing high): top = the wick high (the extreme), bottom = body low of the pivot candle.
Doji / bodyless pivot candles are skipped, and a de-duplication filter prevents a new zone from being created on top of an existing overlapping zone (including the opposite side), so the chart stays readable.
Pivots are detected with a centred window of 2·swingLen + 1 bars, so they only appear once fully confirmed — the indicator does not repaint.
The signal: sweep then reclaim
For an active demand zone, the bullish signal fires when, on the same bar:
- low < zone extreme (price wicks below the swing-low liquidity)
- close > zone body high (price closes back above the pivot body)
The mirror logic produces the bearish signal on a supply zone:
- high > zone extreme (price wicks above the swing-high liquidity)
- close < zone body low (price closes back below the pivot body)
A zone is invalidated (deleted, no signal) when price closes beyond the extreme — i.e. a genuine acceptance through the level rather than a rejection of it. A zone also expires automatically after maxLife bars, and only the most recent maxZones zones per side are kept.
The measured-move target
When a signal triggers, the indicator projects a target equal to the depth of the sweep:
bull target = entry close + (entry close − swept low)
bear target = entry close − (swept high − entry close)
This is a symmetric 1 : 1 measured move drawn 40 bars into the future as a dotted projection line.
Key Features at a Glance
| Feature | Behaviour |
|---|---|
| Zone anchor | Wick of the confirmed swing candle (true liquidity level) |
| Bull signal | Sweep below demand extreme **and** close back above body high |
| Bear signal | Sweep above supply extreme **and** close back below body low |
| Invalidation | Close beyond the extreme (acceptance, not rejection) |
| Target | 1 : 1 measured move = sweep depth, projected 40 bars |
| Memory control | `maxLife` expiry + `maxZones` FIFO cap per side |
| Repainting | None — centred pivots, confirmed before drawing |
| Output | On-chart ▲ / ▼ arrows + zones (bare `RETURN`, overlay-safe) |
How to Read the Indicator
- Zones are context, the arrow is the trigger. A shaded box only tells you where liquidity sits. Wait for the triangle that confirms the wick was swept and rejected on the close.
- A close through the box is bad, not good. Unlike a classic breakout tool, a clean close beyond the extreme deletes the zone. The edge is in the failed break.
- Use the dotted line as a first objective, not a guarantee. It is a symmetric projection of the sweep depth; partial profit there and trailing the rest is a sensible default.
- Higher swingLen = stronger structure. Small values produce many minor zones; larger values isolate the swings that actually hold institutional stops.
Practical Applications
- Stop-hunt entries. The signal is, by construction, an entry after the liquidity grab — the lowest-risk place to join a reversal with a tight stop just beyond the swept wick.
- Confluence filter. Only take your discretionary setups when a Breakout-and-Retest arrow agrees with them; the close-based rejection is a strong filter against false breakouts.
- Mean-reversion at swing extremes. In ranging conditions the sweep-and-reclaim pattern at range boundaries is a classic fade, and the measured move conveniently targets the opposite side of the range.
- Scan-driven workflow. The pattern is a discrete, late-confirmed event — port the sweep-and-reclaim condition into a ProScreener so the platform can hunt it across a whole watchlist.
Indicator Configuration
| Parameter | Default | Description |
|---|---|---|
| `swingLen` | 10 | Pivot length (left = right). Higher = more significant swings only |
| `maxLife` | 400 | Bars a zone stays active before automatic expiry |
| `maxZones` | 5 | Maximum simultaneous zones per side (oldest evicted) |
| `showTarget` | 1 | Draw the measured-move projection (1 = on, 0 = off) |
Code
//--------------------------------------------------------//
//PRC_Breakout and Retest Signals (by FloAlgo)
//version = 0
//18.05.2026
//Iván González @ www.prorealcode.com
//Sharing ProRealTime knowledge
//--------------------------------------------------------//
// Overlay indicator. Builds demand/supply zones on swing
// pivots and fires a signal when price sweeps the zone
// wick (liquidity) and closes back inside the candle body
// (breakout & retest = liquidity sweep + reclaim).
//--------------------------------------------------------//
//-----Inputs---------------------------------------------//
swingLen   = 10        // pivot length (left = right)
maxLife    = 400       // max bars a zone stays active
maxZones   = 5         // max zones per side (1..10)
showTarget = 1         // 1 = draw measured-move target
//--------------------------------------------------------//
MAXZ = 10              // physical slots per side (>= maxZones)
//--------------------------------------------------------//
bullSig = 0
bearSig = 0
L   = swingLen
win = 2 * L + 1
//-----Centred pivot detection (no repaint)---------------//
isPL = 0
isPH = 0
IF barindex >= win THEN
   IF low[L] = LOWEST[win](low) THEN
      isPL = 1
   ENDIF
   IF high[L] = HIGHEST[win](high) THEN
      isPH = 1
   ENDIF
ENDIF
pvBar  = barindex[L]
pvBHi  = MAX(open[L], close[L])
pvBLo  = MIN(open[L], close[L])
pvLow  = low[L]
pvHigh = high[L]
//--------------------------------------------------------//
//-----Spawn demand zone (on swing low)-------------------//
IF isPL = 1 AND pvBHi > pvLow THEN
   isDup = 0
   FOR i = 0 TO MAXZ - 1 DO
      IF $dAct[i] = 1 AND pvLow >= $dExt[i] AND pvLow <= $dBHi[i] THEN
         isDup = 1
      ENDIF
   NEXT
   IF isDup = 0 THEN
      FOR i = 0 TO MAXZ - 1 DO
         IF $sAct[i] = 1 AND pvBHi >= $sBLo[i] AND pvLow <= $sExt[i] THEN
            isDup = 1
         ENDIF
      NEXT
   ENDIF
   IF isDup = 0 THEN
      slot    = -1
      cnt     = 0
      oldIdx  = -1
      oldBorn = 0
      FOR i = 0 TO MAXZ - 1 DO
         IF $dAct[i] = 1 THEN
            cnt = cnt + 1
            IF oldIdx = -1 OR $dBorn[i] < oldBorn THEN
               oldBorn = $dBorn[i]
               oldIdx  = i
            ENDIF
         ELSE
            IF slot = -1 THEN
               slot = i
            ENDIF
         ENDIF
      NEXT
      IF cnt >= maxZones THEN
         slot = oldIdx
      ENDIF
      IF slot = -1 THEN
         slot = oldIdx
      ENDIF
      $dAct[slot]  = 1
      $dExt[slot]  = pvLow
      $dBHi[slot]  = pvBHi
      $dBLo[slot]  = pvBLo
      $dBorn[slot] = pvBar
   ENDIF
ENDIF
//-----Spawn supply zone (on swing high)------------------//
IF isPH = 1 AND pvHigh > pvBLo THEN
   isDup = 0
   FOR i = 0 TO MAXZ - 1 DO
      IF $sAct[i] = 1 AND pvHigh <= $sExt[i] AND pvHigh >= $sBLo[i] THEN
         isDup = 1
      ENDIF
   NEXT
   IF isDup = 0 THEN
      FOR i = 0 TO MAXZ - 1 DO
         IF $dAct[i] = 1 AND pvHigh >= $dExt[i] AND pvBLo <= $dBHi[i] THEN
            isDup = 1
         ENDIF
      NEXT
   ENDIF
   IF isDup = 0 THEN
      slot    = -1
      cnt     = 0
      oldIdx  = -1
      oldBorn = 0
      FOR i = 0 TO MAXZ - 1 DO
         IF $sAct[i] = 1 THEN
            cnt = cnt + 1
            IF oldIdx = -1 OR $sBorn[i] < oldBorn THEN
               oldBorn = $sBorn[i]
               oldIdx  = i
            ENDIF
         ELSE
            IF slot = -1 THEN
               slot = i
            ENDIF
         ENDIF
      NEXT
      IF cnt >= maxZones THEN
         slot = oldIdx
      ENDIF
      IF slot = -1 THEN
         slot = oldIdx
      ENDIF
      $sAct[slot]  = 1
      $sExt[slot]  = pvHigh
      $sBHi[slot]  = pvHigh
      $sBLo[slot]  = pvBLo
      $sBorn[slot] = pvBar
   ENDIF
ENDIF
//--------------------------------------------------------//
//-----Process demand zones-------------------------------//
FOR i = 0 TO MAXZ - 1 DO
   IF $dAct[i] = 1 THEN
      IF barindex > $dBorn[i] + maxLife THEN
         $dAct[i] = 0
      ELSIF close < $dExt[i] THEN
         $dAct[i] = 0
      ELSIF low < $dExt[i] AND close > $dBHi[i] THEN
         bullSig = 1
         tgtB = close + (close - $dExt[i])
         IF showTarget = 1 THEN
            DRAWSEGMENT(barindex, close, barindex + 40, tgtB) STYLE(dottedline) COLOURED(0, 193, 118)
         ENDIF
         $dAct[i] = 0
      ENDIF
   ENDIF
NEXT
//-----Process supply zones-------------------------------//
FOR i = 0 TO MAXZ - 1 DO
   IF $sAct[i] = 1 THEN
      IF barindex > $sBorn[i] + maxLife THEN
         $sAct[i] = 0
      ELSIF close > $sExt[i] THEN
         $sAct[i] = 0
      ELSIF high > $sExt[i] AND close < $sBLo[i] THEN
         bearSig = 1
         tgtS = close - ($sExt[i] - close)
         IF showTarget = 1 THEN
            DRAWSEGMENT(barindex, close, barindex + 40, tgtS) STYLE(dottedline) COLOURED(255, 61, 61)
         ENDIF
         $sAct[i] = 0
      ENDIF
   ENDIF
NEXT
//--------------------------------------------------------//
//-----Signals (historical, one per event)----------------//
atr = averagetruerange[14]
IF bullSig = 1 THEN
   DRAWTEXT("▲", barindex, low - atr * 0.5) COLOURED(0, 193, 118)
ENDIF
IF bearSig = 1 THEN
   DRAWTEXT("▼", barindex, high + atr * 0.5) COLOURED(255, 61, 61)
ENDIF
//-----Active zones (last bar only)-----------------------//
IF islastbarupdate THEN
   FOR i = 0 TO MAXZ - 1 DO
      IF $dAct[i] = 1 THEN
         rEndD = MIN(barindex, $dBorn[i] + maxLife)
         DRAWRECTANGLE($dBorn[i], $dBHi[i], rEndD, $dExt[i]) COLOURED(0, 193, 118, 0) FILLCOLOR(0, 193, 118, 45)
         DRAWSEGMENT($dBorn[i], $dExt[i], rEndD, $dExt[i]) COLOURED(0, 193, 118)
      ENDIF
      IF $sAct[i] = 1 THEN
         rEndS = MIN(barindex, $sBorn[i] + maxLife)
         DRAWRECTANGLE($sBorn[i], $sExt[i], rEndS, $sBLo[i]) COLOURED(255, 61, 61, 0) FILLCOLOR(255, 61, 61, 45)
         DRAWSEGMENT($sBorn[i], $sExt[i], rEndS, $sExt[i]) COLOURED(255, 61, 61)
      ENDIF
   NEXT
ENDIF
//--------------------------------------------------------//
RETURN
![Probabilistic ICT Order Blocks [3D]](https://www.prorealcode.com/wp-content/uploads/2026/08/EURUSDXXXX-1-hora-150x150.png)

Hello I'm getting an error