
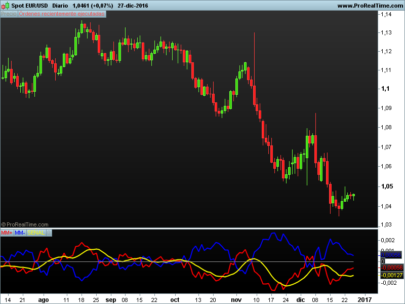
This Indicator was programmed by Nicolas on this website and as I saw that the idea was interesting I was testing it and I warned that with some instruments (depending on the volatility) or depending on the timeframe it was not the same as weekly programming with the MACD as oscillator trend with (12,26,9) and the Adx as a force oscillator in 14 periods in many occasions did not give the most correct information that could be expected, so try to improve it a bit so that each Trader or Investor can adjust it to your taste.
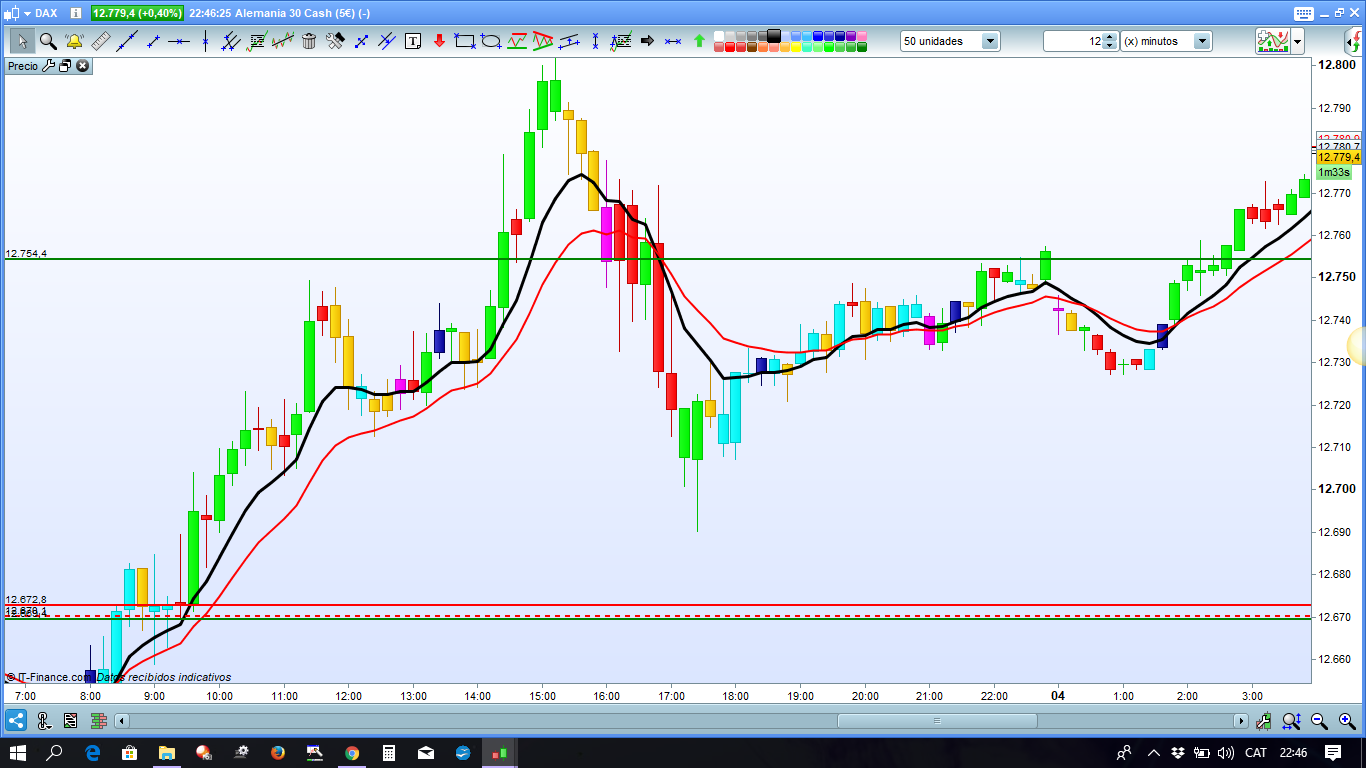
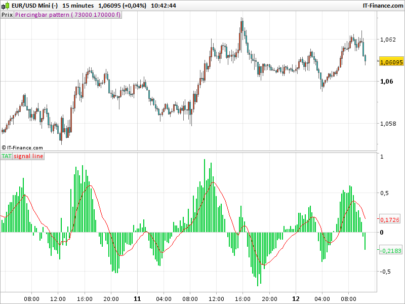
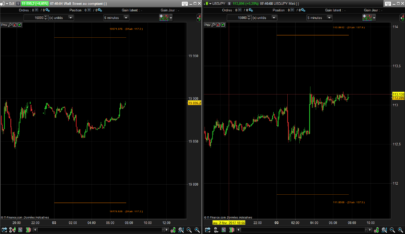
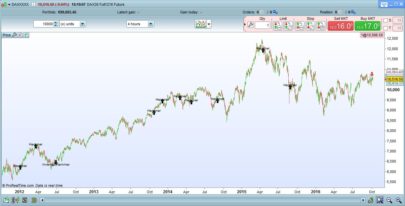
There is a whole system behind this indicator that is quite complex, the most important thing is that the candles do not have the opening and closing as the Japanese candles ; nevertheless it gives very good information when operating, since after a strong upward trend with many green candles the appearance of a red candle and make a new maximum usually warns of the immediate change of market. I also added two more colors that if we use a trend oscillator in this case to choose between MACD, Momentum or Di of the Adx, so that it would be interesting to know if the price was located above or below the level 0 with which I added the dark blue candle for when oscillator crosses the level 0 up and the pink candle to know when the candle crosses the 0 level down is very interesting to see the bounces on this level 0 with alternating candles of these colors and then follow the route If someone wants to know more information about how this indicator works I explain it in the video. (from the minute 24 or so, so you do not waste time).
It is an indicator to make more visual changing the colors of the candles the force that has a continuous movement of the Price.
It is not more than applying the information of a Moment or Tendency oscillator and an oscillator to determine the force of the movement in progress.
For this and because each Graphic Temporality requires its small adjustments and also the sensitivity of each Investor feels more comfortable with some more Aggressive information and others more Conservative I have configured this Indicator with different possibilities
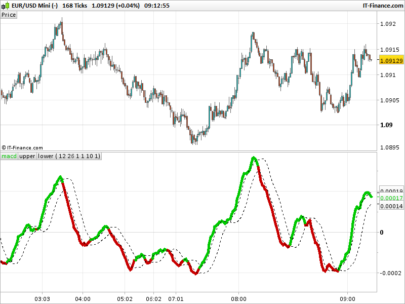
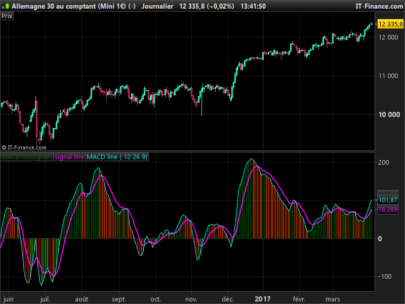
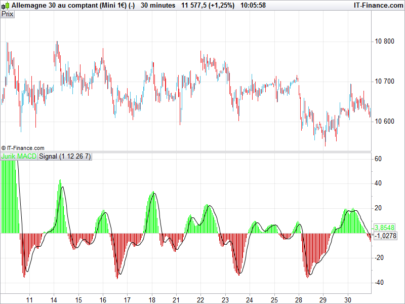
As Oscillators of Moment or Tendencies we have 3 options in Parameters we have: OscillatorTendenial = 1 the MACD = 2 the Momentum and the = 3 the DI (of the Adx) besides as you will see you can configure each one of the parameters of these oscillators with such get more or less sensitivity
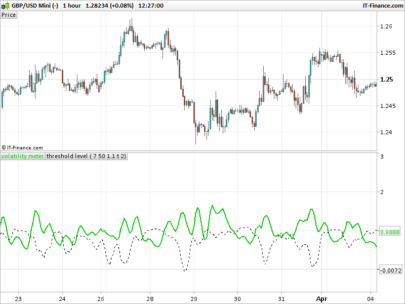
To have the information of the force of the movement in progress we will be able to use two Oscillators MetodoFuerza = 1 the ATR or AverageTrueRange and with the MetodoFerza = 2 the ADX as with the Trend oscillators here we can also adjust the different parameters of the period to get more or less Sensitivity
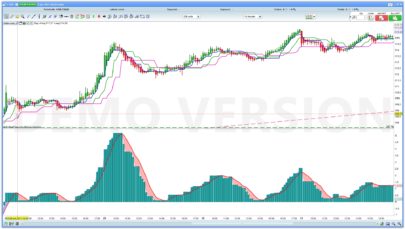
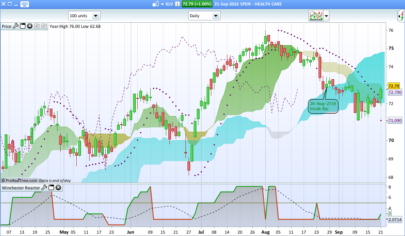
The operation of the oscillator is very basic if the trend oscillator is directed upwards where it is on its course and at the same time the market oscillator is also upwards we will have a green candle
In the case that the Tender Oscillator goes in an upward direction, however, the strength of the market is decreasing then a cyan or light blue colored candle will be drawn.
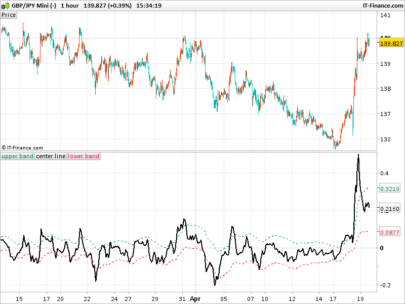
In the event that the Tendency Oscillator is decreasing or in a bearish direction and also the Force Oscillator is also decreasing then the candle will be drawn in gold if you notice it is usually the color of the candles in the minor corrections or at the beginning of major corrections
In case the Trend Oscillator draws in a bearish direction and the Force oscillator goes in a rising direction then draw the red candle
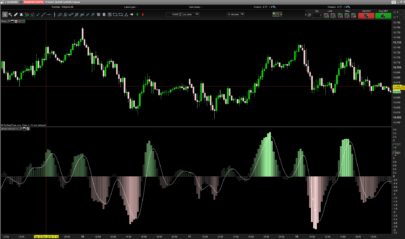
These are the main candles or the 4 main colors green cyan gold red however taking advantage of the information of Trend oscillators, I have also configured 2 additional colors that point to the crossing of the trend oscillator of level 0 understanding that this information is important both to locate the possible movement path and when the oscillator both above and below usually reach this level and there again bounces this type of movement is clearly reflected because usually draw together a candle of each color For when cross the level 0 upwards the candle is dark blue and for when it crosses the level 0 downwards then the candle drawn is fuchsia (electric rose)
Regardless of the information of these dark blue and fuchsia candles that is very valuable to be able to locate the possible movement the way to operate with these candles is the following
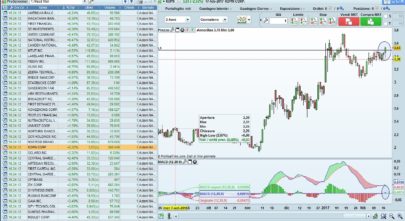
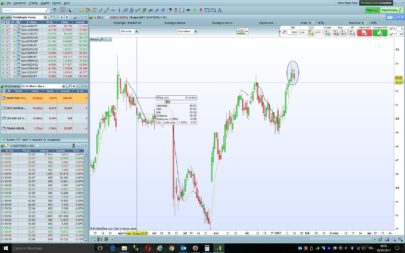
While doing an impulse green candles if it is bullish and red candles if you are bearish you will see that each candle gets a new maximum or minimum when this does not happen and a candle does not make new maximum in uptrend or new minimum in downtrend Lo what happens is that in this same candle or the next maximum the price should make a minimum correction to touch the EMA8 (Media mobil Exponential 8 periods or TLINE) with what is more usual to change the color of the candles
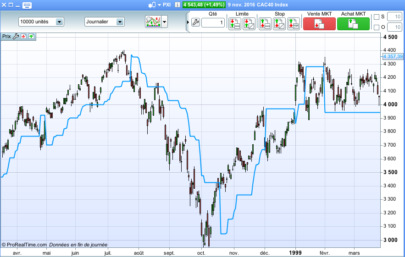
In the case of an upward trend with green candles depending on the sensitivity, we will surely obtain a first red candle and subsequently different golden candles
Depending on the importance of the correction this could be only with golden or even red candles the end of the correction will be marked by different cyan candles at the time of appearing the first green candle again can be the entry for the most prudent to follow the impulse
In case of bearish trend just the opposite after minimos with red candles a green candle appears and then several cyan candles, if the correction is greater even green candles may appear at the time that another red candle appears and a series of golden candles to which a new red candle appears after the impulse resumes
|
1 2 3 4 5 6 7 8 9 10 11 12 13 14 15 16 17 18 19 20 21 22 23 24 25 26 27 28 29 30 31 32 33 34 35 36 37 38 39 40 41 42 43 44 45 46 47 48 49 50 51 52 53 54 55 56 57 58 59 60 61 62 63 64 65 66 67 68 69 70 71 72 73 74 75 76 77 |
//Indicador programado por Domenec Suria 2018 //Indicador de Control de Direccion y Fuerza del Precio Programado por Domenec Suria //Se trata de un indicador para hacer mas visual cambiando los colores de las velas la fuerza que tiene un movimiento continuado del Precio //No es mas que aplicar la informacion de un oscilador de Momento o Tendencia y un oscilador para determinar la fuerza del movimiento en curso //Para ello y debido a que cada Temporalidad de Grafico precisa de sus pequeños ajustes y de que ademas la sensibilidad de cada Inversor se siente mas comodo con una informacion unos mas Agresiva y otros mas Conservadora He configurado este Indicador con diferentes posibilidades //Como Osciladores de Momento o Tendenciales tenemos 3 opciones en Parametros tenemos OsciladorTendencial =1 el MACD = 2 el Momentum y el =3 el DI (del Adx) ademas como vereis se pueden configurar cada uno de los parametros de estos osciladores con tal de conseguir mas o menos sensibilidad //Para tener la informacion de la fuerza del movimiento en curso vamos a poder utilizar dos Osciladores MetodoFuerza = 1 el ATR o AverageTrueRange y con el MetodoFuerza = 2 el ADX al igual que con los osciladores de Tendencia aqui tambien podremos ajustar los diferentes parametros del periodo para conseguir mas o menos Sensibilidad //El funcionamiento del Oscilador es muy basico si el oscilador de tendencia se dirige hacia arriba este donde este de su recorrido y al mismo tiempo el Oscilador de Fuerza de mercado tambien esta ascendente tendremos una vela de color verde //En el caso de que el Oscilador Tendencial vaya en direccion ascendente sin embargo la fuerza del mercado este decreciente entonces nos dibujara una vela de color cyan o azul claro //En el caso de que el Oscilador Tendencial este decreciente o en sentido bajista y ademas el Oscilador de Fuerza este tambien decreciente entonces la vela se dibujara de color dorado si os fijais suele ser el color de las velas en las correcciones menores o al principio de las correcciones mayores //En el caso de que el Oscilador de Tendencia dibuje en sentido bajista y el oscilador de Fuerza vaya en sentido creciente entonces dibujara la vela de color rojo //Estas son las velas principales o los 4 colores principales verde cyan dorado rojo sin embargo aprovechando que disponemos de la informacion de osciladores de Tendencia ademas he configurado 2 colores adicionales que lo que señalan es el cruce del oscilador tendencial de la cota 0 entendiendo que esta informacion es importante tanto para situar el posible recorrido del movimiento como cuando el oscilador tanto desde arriba como desde abajo suele llegar hasta esta cota y alli rebota de nuevo este tipo de movimiento queda claramente reflejado porque suele dibujar juntas una vela de cada color Para cuando cruza la cota 0 hacia arriba la vela es azul oscuro y para cuando cruza la cota 0 hacia abajo entonces la vela dibujada es de color fucsia (rosa electrico) //Independientemente de la informacion de estas velas azul oscuro y fucsia que es muy valiosa para poder situar el posible movimiento la forma de operar con estas velas es la siguiente //Mientras este haciendo un impulso Velas verdes si es alcista y Velas Rojas si es bajista vereis que cada vela consigue un nuevo maximo o minimo cuando esto no ocurre asi y una vela no hace nuevo maximo en tendencia alcista o nuevo minimo en tendencia bajista Lo que ocurre es que en esta misma vela o maximo la siguiente el precio deberia de hacer una correccion minimo hasta tocar la EMA8 (Media mobil Exponencial de 8 periodos o TLINE) con lo que lo mas habitual es que cambien el color de las velas //En el caso de tendencia alcista con velas verdes dependiendo de la sensibilidad seguro que obtendremos una primera vela roja y posteriormente diferentes velas doradas //Dependiendo de la importancia de la correccion esta podra ser solo con velas doradas o incluso rojas el final de la correccion vendra marcado por diferentes velas cyan en el momento de aparecer la primera vela verde de nuevo puede ser la entrada para los mas prudentes para seguir el impulso //En caso de Tendencia bajista justo al contrario despues de minimos con velas rojas aparece una vela verde y posteriormente varias velas cyan, si la correccion es mayor incluso pueden aparecer velas verdes en el momento que aparece otra vela roja y una serie de velas doradas a la que despues aparece una nueva vela roja se reemprende el impulso //---settings OsciladorTendencial=1 valormacd1=12 valormacd2=26 valormacd3=9 valormomentum = 14 valorDI = 14 MetodoFuerza = 1 valoratr = 14 valoradx = 14 //---end of settings If OsciladorTendencial =1 then OT=MACD[valormacd1,valormacd2,valormacd3] elsif OsciladorTendencial=2 then OT=Momentum[valormomentum] elsif OsciladorTendencial=3 then OT= DI[valorDI] endif if MetodoFuerza =1 then MF= AverageTrueRange[valoratr] elsif MetodoFuerza=2 then MF = ADX[valoradx] endif OT = OT MF= MF if MF>=MF[1] and OT>OT[1] then r = 0 g = 255 b = 0 elsif MF<=MF[1] and OT<OT[1] then r = 255 g = 200 b = 0 elsif MF>=MF[1] and OT<OT[1] then r = 255 g = 0 b = 0 elsif MF<=MF[1] and OT>OT[1] then r = 0 g = 255 b = 255 endif if OT crosses under 0 then r = 255 g = 0 b = 255 elsif OT crosses over 0 then r = 0 g = 0 b = 150 endif DRAWCANDLE(open,high,low,close) coloured(r,g,b) return |
Tened en cuenta que hay que añadir 9 variables
Share this
No information on this site is investment advice or a solicitation to buy or sell any financial instrument. Past performance is not indicative of future results. Trading may expose you to risk of loss greater than your deposits and is only suitable for experienced investors who have sufficient financial means to bear such risk.
ProRealTime ITF files and other attachments :
Find other exclusive trading pro-tools on ![]()
PRC is also on YouTube, subscribe to our channel for exclusive content and tutorials


Interesante, muy visual Doc. Felicidades!!!
simplemente impresionante Dom…te sigo en youtube. Me ha gustado tu canal. Gracias por compartir este indicador