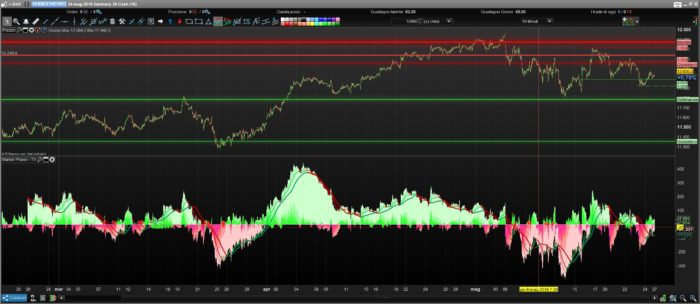
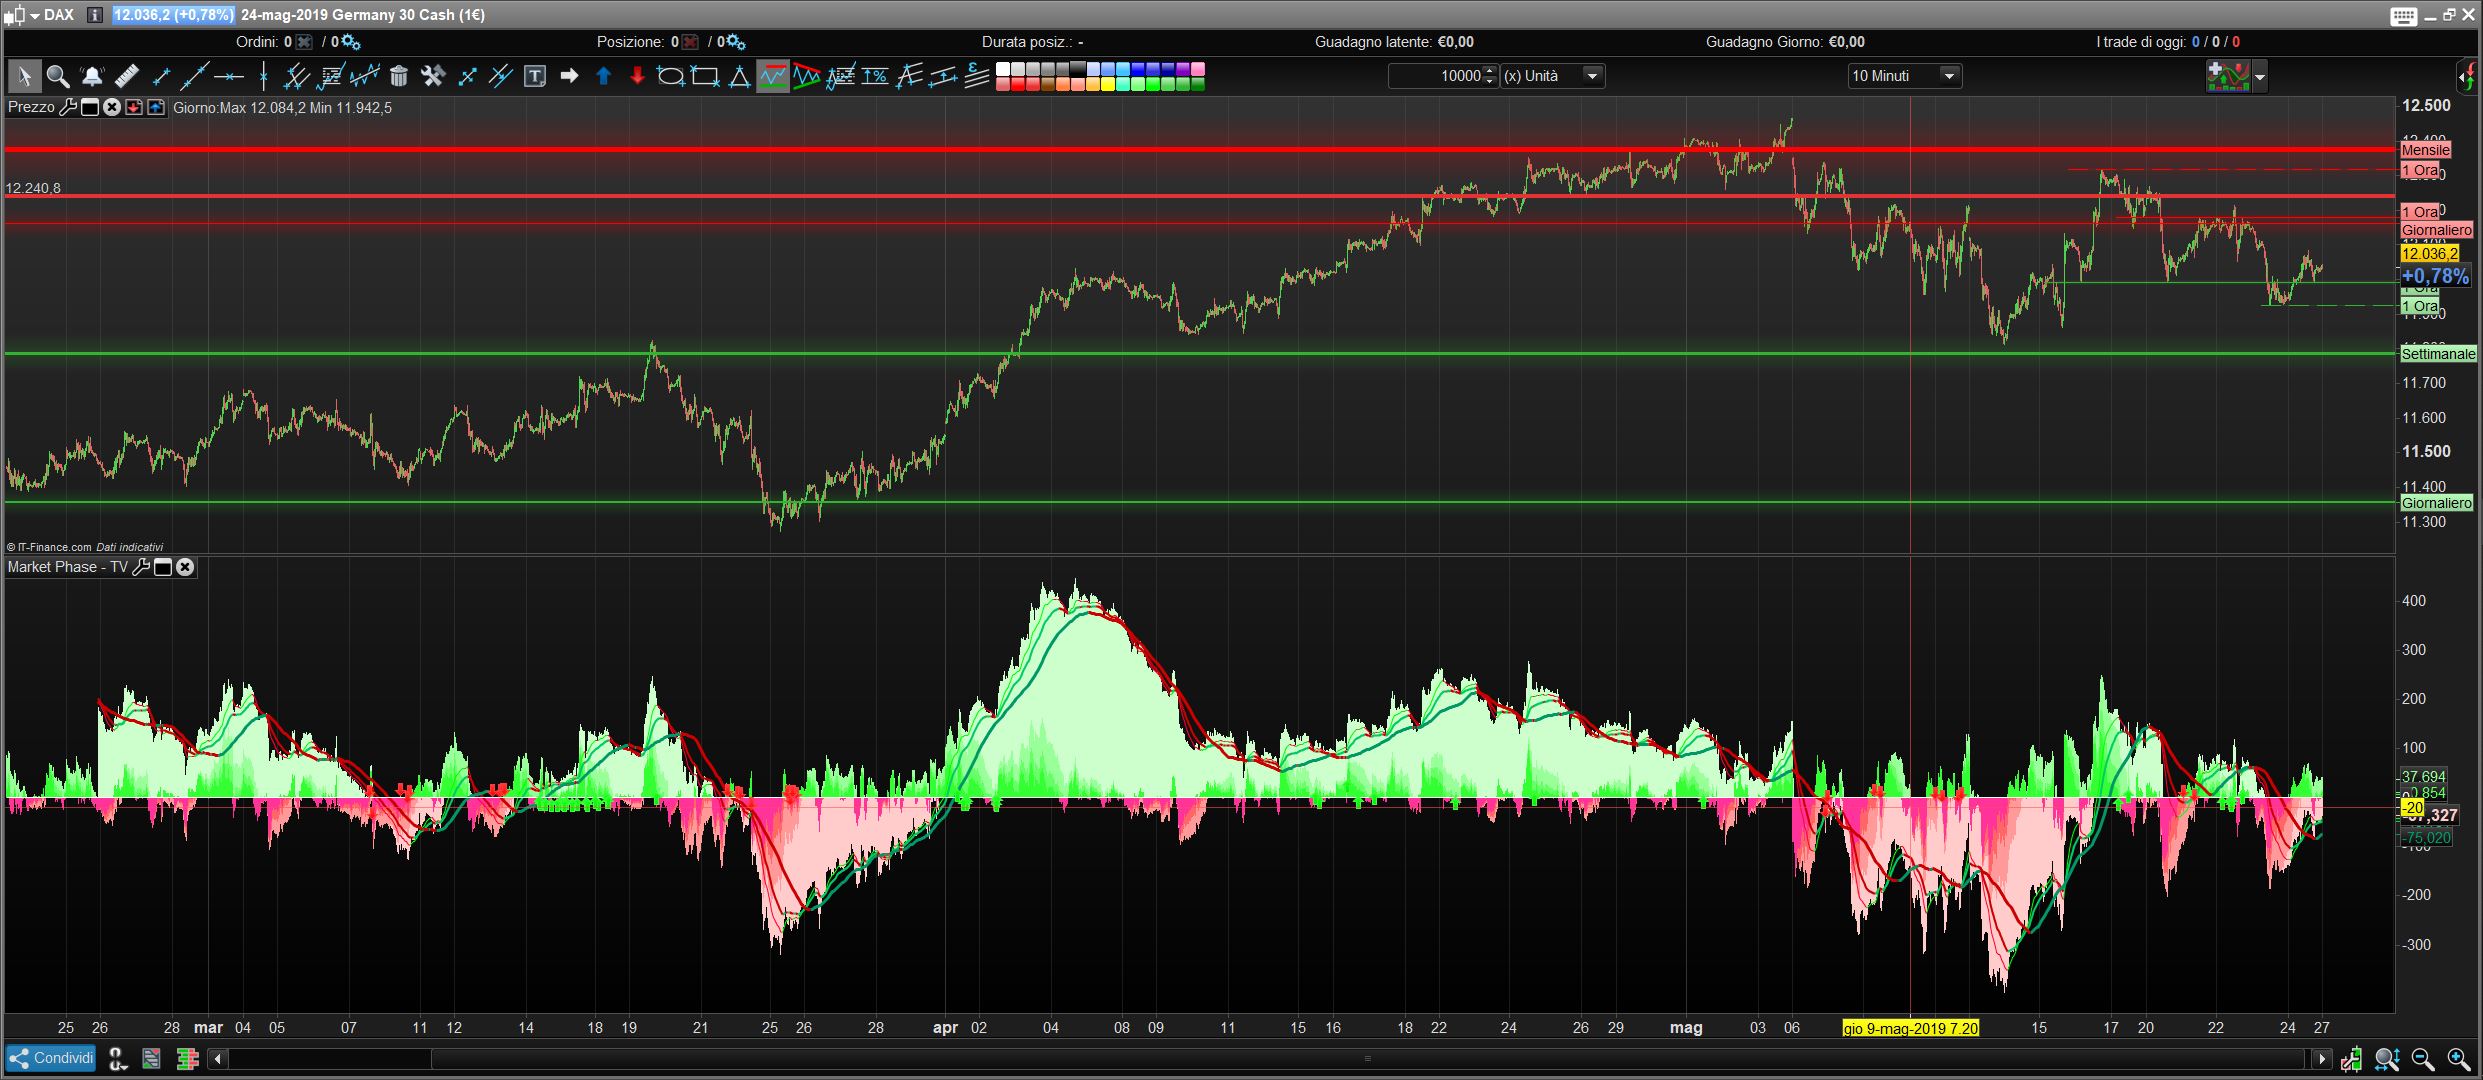
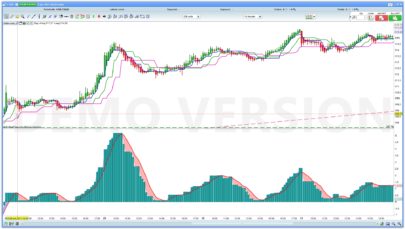
Inspired by a script seen on TradingView, I translated and adapted this indicator.
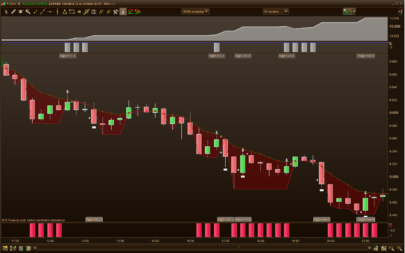
It shows the relation of price against different period moving averages.
The arrows indicates possible retracements in a general trend direction, so they can be used as entry point.
No ground breaking math here, but I am finding very useful and some algo based on it is giving good results in demo live.
|
1 2 3 4 5 6 7 8 9 10 11 12 13 14 15 16 17 18 19 20 21 22 23 24 25 26 27 28 29 30 31 32 |
// This indicator shows the relation of price against different period ma's. // When put in daily Timeframe it gives the 1400 Day (= 200 Weekly) and the 200 ,100 an 50 Daily. // Features: // - The lines show the 200,100 and 50 ma in relation to the 1400 ma. // - The arrows indicate possible (retracement) entry points // Coded by AlexF ma50=close-ExponentialAverage[50](close) ma100=close-ExponentialAverage[100](close) ma200=close-Average[200](close) ma1400=close-Average[1400](close) dma50=ma1400-ma50 dma100=ma1400-ma100 dma200=ma1400-ma200 if dma50<dma50[1] and dma100<dma100[1] and dma200<dma200[1] and ma50<0 and ma100<0 and ma200<0 and ma1400<0 then trend=-1 elsif dma50>dma50[1] and dma100>dma100[1] and dma200>dma200[1] and ma50>0 and ma100>0 and ma200>0 and ma1400>0 then trend=1 elsif trend<>1 or trend<>-1 then trend=0 endif if trend=-1 and ma50 crosses under 0 then drawarrowdown(barindex,ma50+5*pipsize)coloured(255,0,0) endif if trend=1 and ma50 crosses over 0 then drawarrowup(barindex,ma50-5*pipsize)coloured(0,255,0) endif return ma1400 as "1400 phase",ma200 as "200 phase", ma100 as "100 phase", ma50 as "50 phase", dma50 as "50", dma100 as "100", dma200 as "200", 0 as "zero" |
Share this
No information on this site is investment advice or a solicitation to buy or sell any financial instrument. Past performance is not indicative of future results. Trading may expose you to risk of loss greater than your deposits and is only suitable for experienced investors who have sufficient financial means to bear such risk.
ProRealTime ITF files and other attachments :PRC is also on YouTube, subscribe to our channel for exclusive content and tutorials



Please, could you tell me how can i to put yours colours on the indicator and how colour the zones.
Thanks and sorry for my english
AlexF, thanks for the market phase indicator; please, you could give an indication of how to set the resulting graph (color zones and line colors) in order to reproduce a visual effect similar to yours. Thanks again
Set the “phases” as histograms with different shades of green and red for above/below zero. Set the other ma values as lines.
Thanks for the post !
Have you tried it with the volume indicator, maybe it gives another good restriction /confirmation for a trading strategy?
At least I will try around with this indicator for a trendfollowing strategy.
KR Jan
I added the (boring) coloring coding to this indicator, see below, so the indicator will immediatly be colored when you add it,
// This indicator shows the relation of price against different period ma’s.
// When put in daily Timeframe it gives the 1400 Day (= 200 Weekly) and the 200 ,100 an 50 Daily.
// Features:
// – The lines show the 200,100 and 50 ma in relation to the 1400 ma.
// – The arrows indicate possible (retracement) entry points
// Coded by AlexF
ma50=close-ExponentialAverage[50](close)
ma100=close-ExponentialAverage[100](close)
ma200=close-Average[200](close)
ma1400=close-Average[1400](close)
dma50=ma1400-ma50
dma100=ma1400-ma100
dma200=ma1400-ma200
if ma50 < 0 then
r = 255
g = 0
b = 0
else
r = 0
g = 128
b = 0
endif
if ma100 < 0 then
r1 = 192
g1 = 0
b1 = 0
else
r1 = 51
g1 = 204
b1 = 51
endif
if ma200 < 0 then
r200 = 255
g200 = 51
b200 = 0
else
r200 = 153
g200 = 255
b200 = 102
endif
if ma1400 < 0 then
r14 = 162
g14 = 43
b14 = 30
else
r14 = 204
g14 = 255
b14 = 153
endif
if dma50 < 0 then
dr = 255
dg = 0
db = 0
else
dr = 0
dg = 128
db = 0
endif
if dma100 < 0 then
dr1 = 192
dg1 = 0
db1 = 0
else
dr1 = 51
dg1 = 204
db1 = 51
endif
if dma200 < 0 then
dr2 = 255
dg2 = 51
db2 = 0
else
dr2 = 153
dg2 = 255
db2 = 102
endif
return ma1400 coloured(r14,g14,b14)style(histogram) as "1400 phase",ma200 coloured(r200,g200,b200)style(histogram) as "200 phase", ma100 coloured(r1,g1,b1)style(histogram) as "100 phase", ma50 coloured(r,g,b)style(histogram) as "50 phase", dma50 coloured(dr,dg,db)style(line,3) as "50", dma100 coloured(dr1,dg1,db1)style(line,3) as "100", dma200 coloured(dr2,dg2,db2)style(line,3) as "200", 0 as "zero"
hello,
thanks, could you post somes algos suggestions to improve, based on this indicator?
Hallo Winnie37,
Not sure about your question,
I will have investigate if I can make a new trading algo for myself based on this indicator. I am a trendfollowing trader, so I hope this indicator can contribute..
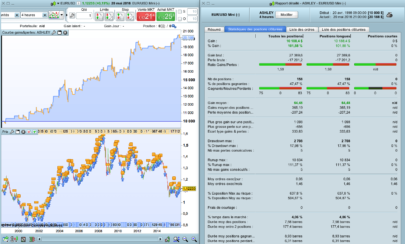
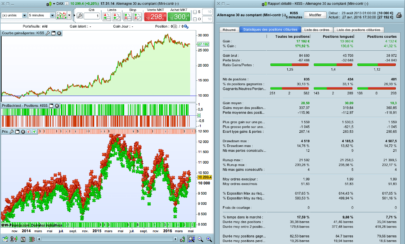
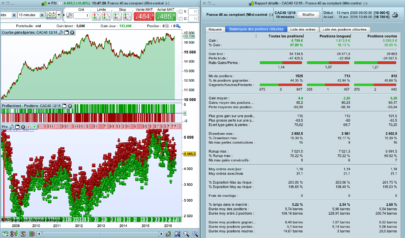
yes. “No ground breaking math here, but I am finding very useful and some algo based on it is giving good results in demo live” in description; I investigate too but not very good results for the moment…
Also interesting to know what does not work, which set up you use, saves me investigating ! Do you mind sharing this ?
i just set the proorder like this: buy when 50/100/200 phase >0 and sell when under 0, good backtest but no effective trades in demo…strange thing…Ok to share 🙂