Liquidity Thermal Map
Introduction
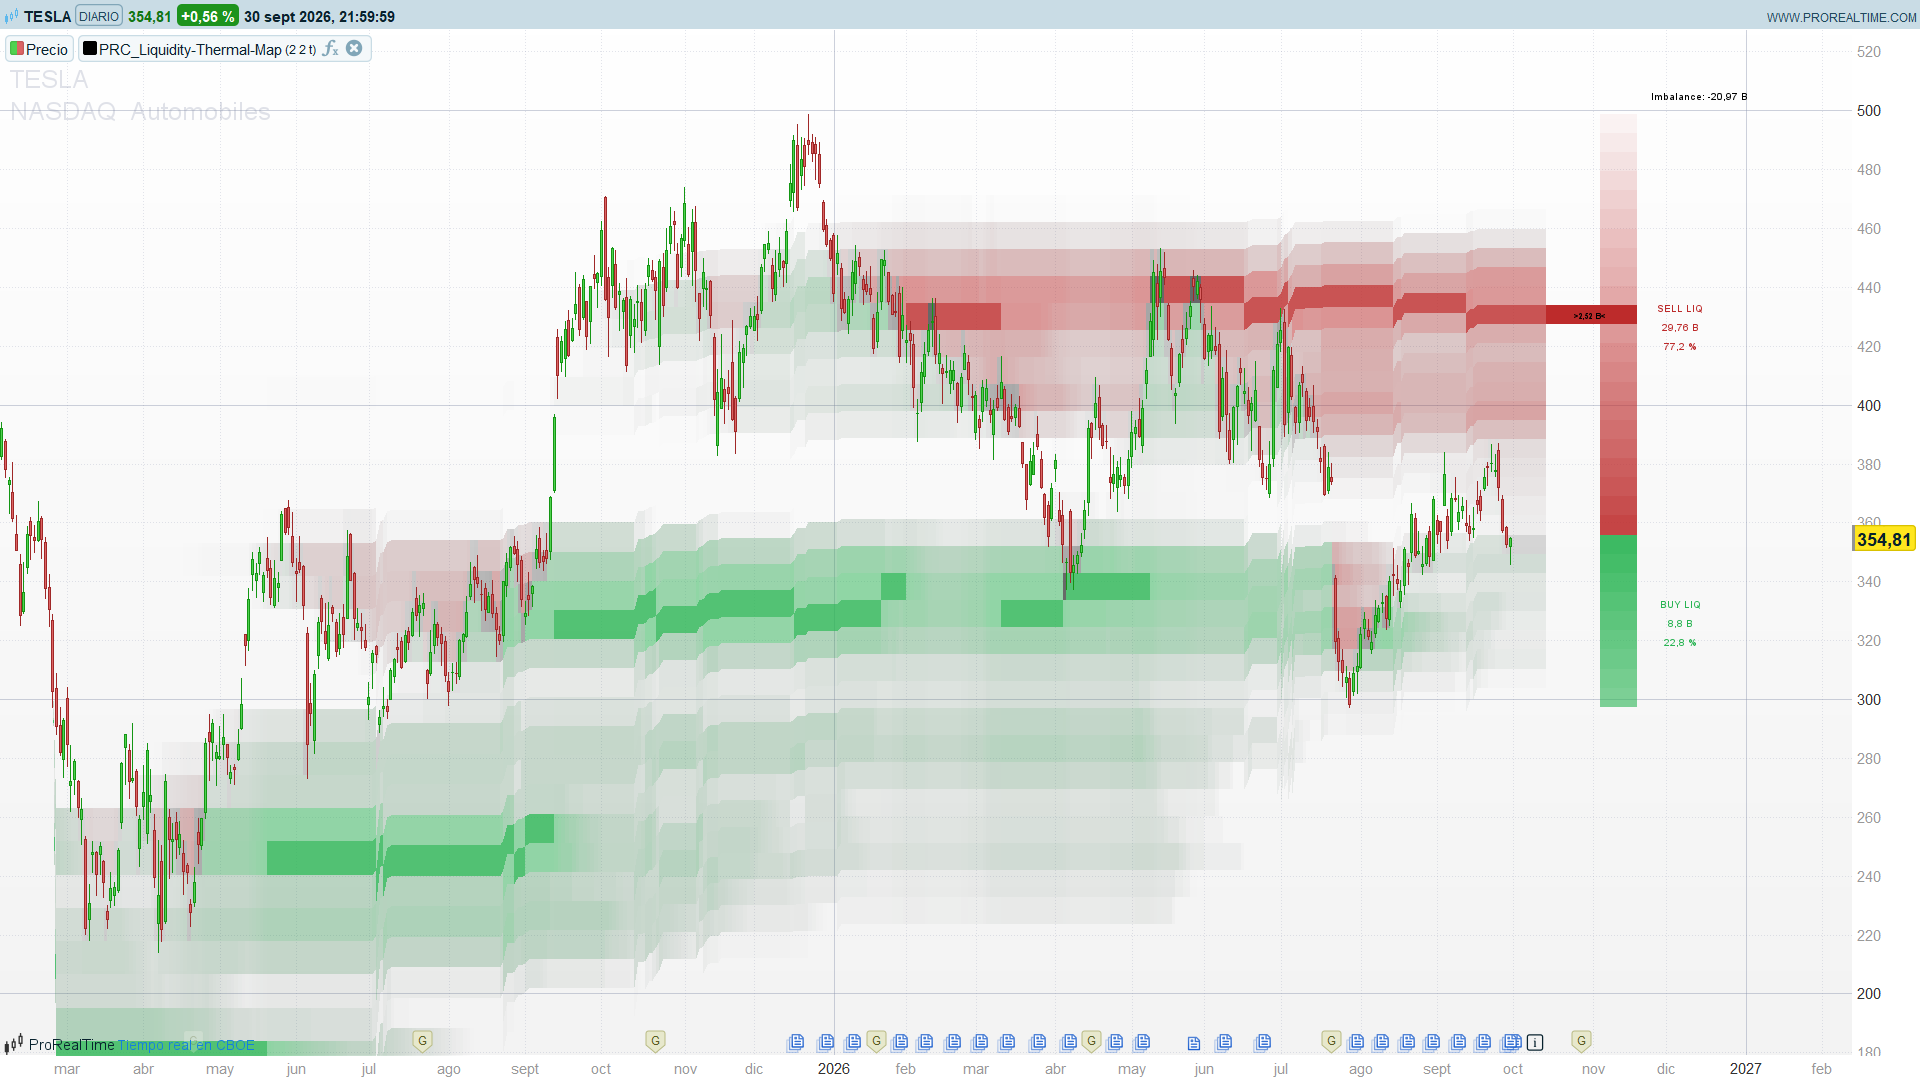
A volume profile tells you at which prices the market traded the most, but it is usually drawn once, on the side of the chart. Liquidity Thermal Map, by BigBeluga, paints that information behind the candles: the price range of the recent bars is split into 31 rows, and each row is coloured on every bar according to how much volume traded around it. The result is a heatmap that shows where liquidity sits, how it moves as new bars arrive and on which side of the current price it accumulates.
Theory Behind the Indicator
Rows of price
On every bar, the indicator takes the highest high and the lowest low of the last bars (100, 300 or 600, depending on the profile depth) and splits that range into 31 equal rows.
Volume by row
Each bar of the lookback adds its volume to the rows whose centre is less than one row height away from its close. A close therefore feeds the row it falls in and, usually, its nearest neighbour, which smooths the profile.
Colour and intensity
- Rows above the current close are drawn in red: overhead liquidity, potential resistance.
- Rows below the close are drawn in green: liquidity underneath, potential support.
- The row with the most volume is drawn almost opaque. The other rows fade from transparent to their colour as their volume approaches that of the busiest row. The thermal sensitivity sets where the fade starts: with “High Contrast” only rows above half of the maximum volume get colour; with “Smooth” every row does.
- Rows touched by the current candle (open, close, median or typical price) are shown in neutral grey, so the live price stays readable.
Key Features at a Glance
- 31-row volume heatmap drawn behind the candles and recomputed on every bar
- Three profile depths (100, 300 or 600 bars) and three thermal sensitivities
- Red overhead liquidity and green underlying liquidity, relative to the close
- Liquidity ladder to the right of the last candle, strongest next to the price and fading towards the extremes
- The busiest row is highlighted in the ladder with its volume
- Total volume below and above the price, with its percentage of the total
- Liquidity imbalance: volume below minus volume above the price
How to Read the Indicator
- Bright bands are prices where a lot of volume traded. Price often slows down, reacts or consolidates when it returns to them.
- The side matters. Bright red bands above the price are overhead supply that a rally has to absorb; bright green bands below are areas where buyers were active.
- Watch the heatmap move. Because it is recomputed on every bar, a band that keeps its intensity bar after bar is an established area of liquidity, while one that fades is being left behind.
- The totals and the imbalance summarise the whole map: a positive imbalance means more of the recent volume traded below the current price than above it.
Practical Applications
- Support and resistance from volume. Use the brightest bands near the price as reference levels for entries, stops and targets.
- Breakout quality. A breakout that leaves a thick band of green liquidity behind it has a volume base underneath; one that runs into a bright red band has supply in front of it.
- Context for mean reversion. When price moves far from the busiest row, the highlighted level in the ladder shows where the main area of acceptance is.
The heatmap describes where volume traded in the lookback window. It does not predict whether a level will hold.
Indicator Configuration
profileType(default: 2): profile depth. 1 = shallow (100 bars, short-term structure), 2 = balanced (300 bars), 3 = deep (600 bars, broad structure).sensMode(default: 2): thermal sensitivity. 1 = high contrast, 2 = balanced, 3 = smooth.removeCol(default: 1): rows touched by the current candle are shown in neutral grey.- Colours:
upR/G/B(liquidity above the price),dnR/G/B(liquidity below the price),naR/G/B(neutral grey).
Apply the indicator on the price chart. The calculation covers the last 1,500 bars, and the ladder and labels are redrawn on the last bar; leave some empty space to the right of the chart to see them.
Code
//---------------------------------------------------------------
// PRC_Liquidity Thermal Map
// version = 0
// 01.10.2026
// Iván González @ www.prorealcode.com
// Author: BigBeluga
// Sharing ProRealTime knowledge
//--------------------------------------------------------------------//
// Apply it on the price chart.
// The high-low range of the last "period" bars is split into 31 price rows. Each row adds up the
// volume of the bars that closed near it, and the rows are painted as a heatmap behind the price:
// red above the close, green below it, stronger where more volume traded.
// On the last bar: a liquidity ladder to the right, the volume below / above the price and the imbalance.
DEFPARAM DRAWONLASTBARONLY = true
DEFPARAM CALCULATEONLASTBARS = 1500

//----- Parameters
profileType = 2        // profile depth: 1 = shallow (100 bars), 2 = balanced (300), 3 = deep (600)
sensMode = 2           // thermal sensitivity: 1 = high contrast, 2 = balanced, 3 = smooth
removeCol = 1          // 1 = rows touched by the current candle are shown in neutral grey

//----- Colours
upR = 189              // liquidity above the price (resistance)
upG = 43
upB = 43
dnR = 41               // liquidity below the price (support)
dnG = 180
dnB = 83
naR = 68               // neutral grey of the rows touched by the candle
naG = 68
naB = 68

IF profileType = 1 THEN
   period = 100
ELSIF profileType = 3 THEN
   period = 600
ELSE
   period = 300
ENDIF
IF sensMode = 1 THEN
   sensMin = 0.5
ELSIF sensMode = 3 THEN
   sensMin = 0
ELSE
   sensMin = 0.25
ENDIF

//----- 1. Volume by price row, recomputed on every bar
// A close counts in every row whose centre is closer than one row height,
// so each bar feeds up to two neighbouring rows (as in the original).
ready = 0
hiP = close
loP = close
stp = 0
IF barindex >= period - 1 THEN
   hiP = highest[period](high)
   loP = lowest[period](low)
   stp = (hiP - loP) / 31
   IF stp > 0 THEN
      ready = 1
   ENDIF
ENDIF

FOR i = 0 TO 30 DO
   $vb[i] = 0
NEXT
maxV = 0
IF ready = 1 THEN
   FOR k = 0 TO period - 1 DO
      ck = close[k]
      // only rows i with abs(ck - centre_i) < stp can match: around (ck - loP) / stp - 0.5
      i0 = floor((ck - loP) / stp - 0.5)
      FOR i = i0 - 1 TO i0 + 2 DO
         IF i >= 0 AND i <= 30 THEN
            IF abs(ck - (loP + stp * i + stp / 2)) < stp THEN
               $vb[i] = $vb[i] + volume[k]
            ENDIF
         ENDIF
      NEXT
   NEXT
   FOR i = 0 TO 30 DO
      maxV = max(maxV, $vb[i])
   NEXT
ENDIF

//----- 2. Colour of each row (heatmap gradient)
// The busiest row is drawn almost opaque; the others fade from transparent grey to the row colour
// as their volume goes from sensMin to 1 times the busiest row.
hl2V = (high + low) / 2
hlc3V = (high + low + close) / 3
FOR i = 0 TO 30 DO
   $cR[i] = 0
   $cG[i] = 0
   $cB[i] = 0
   $cA[i] = 0
   IF ready = 1 THEN
      lowL = loP + stp * i
      uppL = loP + stp * min(i + 1, 29)
      IF close <= lowL THEN
         bR = upR
         bG = upG
         bB = upB
      ELSE
         bR = dnR
         bG = dnG
         bB = dnB
      ENDIF
      IF removeCol = 1 THEN
         inRow = 0
         IF open >= lowL AND open <= uppL THEN
            inRow = 1
         ENDIF
         IF close >= lowL AND close <= uppL THEN
            inRow = 1
         ENDIF
         IF hl2V >= lowL AND hl2V <= uppL THEN
            inRow = 1
         ENDIF
         IF hlc3V >= lowL AND hlc3V <= uppL THEN
            inRow = 1
         ENDIF
         IF inRow = 1 THEN
            bR = naR
            bG = naG
            bB = naB
         ENDIF
      ENDIF
      IF $vb[i] = maxV THEN
         $cR[i] = bR
         $cG[i] = bG
         $cB[i] = bB
         $cA[i] = 204
      ELSE
         fr = ($vb[i] / maxV - sensMin) / (1 - sensMin)
         fr = max(0, min(1, fr))
         $cR[i] = round(naR + (bR - naR) * fr)
         $cG[i] = round(naG + (bG - naG) * fr)
         $cB[i] = round(naB + (bB - naB) * fr)
         $cA[i] = round(127.5 * fr)
      ENDIF
   ENDIF
NEXT

//----- 3. Heatmap behind the price: one fill per row

lv0 = loP + stp * 0
lv1 = loP + stp * 1
lv2 = loP + stp * 2
lv3 = loP + stp * 3
lv4 = loP + stp * 4
lv5 = loP + stp * 5
lv6 = loP + stp * 6
lv7 = loP + stp * 7
lv8 = loP + stp * 8
lv9 = loP + stp * 9
lv10 = loP + stp * 10
lv11 = loP + stp * 11
lv12 = loP + stp * 12
lv13 = loP + stp * 13
lv14 = loP + stp * 14
lv15 = loP + stp * 15
lv16 = loP + stp * 16
lv17 = loP + stp * 17
lv18 = loP + stp * 18
lv19 = loP + stp * 19
lv20 = loP + stp * 20
lv21 = loP + stp * 21
lv22 = loP + stp * 22
lv23 = loP + stp * 23
lv24 = loP + stp * 24
lv25 = loP + stp * 25
lv26 = loP + stp * 26
lv27 = loP + stp * 27
lv28 = loP + stp * 28
lv29 = loP + stp * 29
lv30 = loP + stp * 30
lvTop = hiP
r00 = $cR[0]
g00 = $cG[0]
b00 = $cB[0]
a00 = $cA[0]
r01 = $cR[1]
g01 = $cG[1]
b01 = $cB[1]
a01 = $cA[1]
r02 = $cR[2]
g02 = $cG[2]
b02 = $cB[2]
a02 = $cA[2]
r03 = $cR[3]
g03 = $cG[3]
b03 = $cB[3]
a03 = $cA[3]
r04 = $cR[4]
g04 = $cG[4]
b04 = $cB[4]
a04 = $cA[4]
r05 = $cR[5]
g05 = $cG[5]
b05 = $cB[5]
a05 = $cA[5]
r06 = $cR[6]
g06 = $cG[6]
b06 = $cB[6]
a06 = $cA[6]
r07 = $cR[7]
g07 = $cG[7]
b07 = $cB[7]
a07 = $cA[7]
r08 = $cR[8]
g08 = $cG[8]
b08 = $cB[8]
a08 = $cA[8]
r09 = $cR[9]
g09 = $cG[9]
b09 = $cB[9]
a09 = $cA[9]
r10 = $cR[10]
g10 = $cG[10]
b10 = $cB[10]
a10 = $cA[10]
r11 = $cR[11]
g11 = $cG[11]
b11 = $cB[11]
a11 = $cA[11]
r12 = $cR[12]
g12 = $cG[12]
b12 = $cB[12]
a12 = $cA[12]
r13 = $cR[13]
g13 = $cG[13]
b13 = $cB[13]
a13 = $cA[13]
r14 = $cR[14]
g14 = $cG[14]
b14 = $cB[14]
a14 = $cA[14]
r15 = $cR[15]
g15 = $cG[15]
b15 = $cB[15]
a15 = $cA[15]
r16 = $cR[16]
g16 = $cG[16]
b16 = $cB[16]
a16 = $cA[16]
r17 = $cR[17]
g17 = $cG[17]
b17 = $cB[17]
a17 = $cA[17]
r18 = $cR[18]
g18 = $cG[18]
b18 = $cB[18]
a18 = $cA[18]
r19 = $cR[19]
g19 = $cG[19]
b19 = $cB[19]
a19 = $cA[19]
r20 = $cR[20]
g20 = $cG[20]
b20 = $cB[20]
a20 = $cA[20]
r21 = $cR[21]
g21 = $cG[21]
b21 = $cB[21]
a21 = $cA[21]
r22 = $cR[22]
g22 = $cG[22]
b22 = $cB[22]
a22 = $cA[22]
r23 = $cR[23]
g23 = $cG[23]
b23 = $cB[23]
a23 = $cA[23]
r24 = $cR[24]
g24 = $cG[24]
b24 = $cB[24]
a24 = $cA[24]
r25 = $cR[25]
g25 = $cG[25]
b25 = $cB[25]
a25 = $cA[25]
r26 = $cR[26]
g26 = $cG[26]
b26 = $cB[26]
a26 = $cA[26]
r27 = $cR[27]
g27 = $cG[27]
b27 = $cB[27]
a27 = $cA[27]
r28 = $cR[28]
g28 = $cG[28]
b28 = $cB[28]
a28 = $cA[28]
r29 = $cR[29]
g29 = $cG[29]
b29 = $cB[29]
a29 = $cA[29]
r30 = $cR[30]
g30 = $cG[30]
b30 = $cB[30]
a30 = $cA[30]
COLORBETWEEN(lv0, lv1, r00, g00, b00, a00)
COLORBETWEEN(lv1, lv2, r01, g01, b01, a01)
COLORBETWEEN(lv2, lv3, r02, g02, b02, a02)
COLORBETWEEN(lv3, lv4, r03, g03, b03, a03)
COLORBETWEEN(lv4, lv5, r04, g04, b04, a04)
COLORBETWEEN(lv5, lv6, r05, g05, b05, a05)
COLORBETWEEN(lv6, lv7, r06, g06, b06, a06)
COLORBETWEEN(lv7, lv8, r07, g07, b07, a07)
COLORBETWEEN(lv8, lv9, r08, g08, b08, a08)
COLORBETWEEN(lv9, lv10, r09, g09, b09, a09)
COLORBETWEEN(lv10, lv11, r10, g10, b10, a10)
COLORBETWEEN(lv11, lv12, r11, g11, b11, a11)
COLORBETWEEN(lv12, lv13, r12, g12, b12, a12)
COLORBETWEEN(lv13, lv14, r13, g13, b13, a13)
COLORBETWEEN(lv14, lv15, r14, g14, b14, a14)
COLORBETWEEN(lv15, lv16, r15, g15, b15, a15)
COLORBETWEEN(lv16, lv17, r16, g16, b16, a16)
COLORBETWEEN(lv17, lv18, r17, g17, b17, a17)
COLORBETWEEN(lv18, lv19, r18, g18, b18, a18)
COLORBETWEEN(lv19, lv20, r19, g19, b19, a19)
COLORBETWEEN(lv20, lv21, r20, g20, b20, a20)
COLORBETWEEN(lv21, lv22, r21, g21, b21, a21)
COLORBETWEEN(lv22, lv23, r22, g22, b22, a22)
COLORBETWEEN(lv23, lv24, r23, g23, b23, a23)
COLORBETWEEN(lv24, lv25, r24, g24, b24, a24)
COLORBETWEEN(lv25, lv26, r25, g25, b25, a25)
COLORBETWEEN(lv26, lv27, r26, g26, b26, a26)
COLORBETWEEN(lv27, lv28, r27, g27, b27, a27)
COLORBETWEEN(lv28, lv29, r28, g28, b28, a28)
COLORBETWEEN(lv29, lv30, r29, g29, b29, a29)
COLORBETWEEN(lv30, lvTop, r30, g30, b30, a30)

//----- 4. Last bar: ladder, extension of the heatmap and liquidity totals
IF islastbarupdate AND ready = 1 THEN
   buyVol = 0
   sellVol = 0
   FOR i = 0 TO 30 DO
      IF loP + stp * i + stp / 2 < close THEN
         buyVol = buyVol + $vb[i]
      ELSE
         sellVol = sellVol + $vb[i]
      ENDIF
   NEXT
   totVol = buyVol + sellVol
   buyPct = 0
   sellPct = 0
   IF totVol > 0 THEN
      buyPct = round(buyVol / totVol * 1000) / 10
      sellPct = round(sellVol / totVol * 1000) / 10
   ENDIF

   // row of the close, clamped to the ladder
   splitIdx = floor((close - loP) / stp)
   splitIdx = max(0, min(30, splitIdx))
   maxDist = max(splitIdx, 30 - splitIdx)

   FOR i = 0 TO 30 DO
      rowLo = loP + stp * i
      rowHi = rowLo + stp
      rowMid = rowLo + stp / 2
      IF close > rowMid THEN
         xR = dnR
         xG = dnG
         xB = dnB
      ELSE
         xR = upR
         xG = upG
         xB = upB
      ENDIF
      // ladder: strong next to the price, fading towards both ends
      fade = 0
      IF maxDist > 0 THEN
         fade = abs(i - splitIdx) / maxDist
      ENDIF
      ladA = round(255 * (100 - floor(10 + fade * 85)) / 100)
      IF $vb[i] = maxV THEN
         DRAWRECTANGLE(barindex + 10, rowHi, barindex + 35, rowLo) COLOURED(xR, xG, xB, 0) FILLCOLOR(xR, xG, xB, 255)
         IF maxV >= 1000000000 THEN
            vTxt = round(maxV / 10000000) / 100
            DRAWTEXT(">#vTxt#B<", barindex + 22, rowMid, SansSerif, Bold, 8) COLOURED(0, 0, 0, 255)
         ELSIF maxV >= 1000000 THEN
            vTxt = round(maxV / 10000) / 100
            DRAWTEXT(">#vTxt#M<", barindex + 22, rowMid, SansSerif, Bold, 8) COLOURED(0, 0, 0, 255)
         ELSIF maxV >= 1000 THEN
            vTxt = round(maxV / 10) / 100
            DRAWTEXT(">#vTxt#K<", barindex + 22, rowMid, SansSerif, Bold, 8) COLOURED(0, 0, 0, 255)
         ELSE
            vTxt = round(maxV)
            DRAWTEXT(">#vTxt#<", barindex + 22, rowMid, SansSerif, Bold, 8) COLOURED(0, 0, 0, 255)
         ENDIF
      ELSE
         DRAWRECTANGLE(barindex + 25, rowHi, barindex + 35, rowLo) COLOURED(xR, xG, xB, 0) FILLCOLOR(xR, xG, xB, ladA)
      ENDIF
      // heatmap extended 10 bars to the right of the last candle (rows 0 to 29)
      IF i <= 29 THEN
         DRAWRECTANGLE(barindex, rowHi, barindex + 10, rowLo) COLOURED($cR[i], $cG[i], $cB[i], 0) FILLCOLOR($cR[i], $cG[i], $cB[i], $cA[i])
      ENDIF
   NEXT

   // liquidity below the price
   yBuy = loP + (close - loP) / 2
   xLab = barindex + 47
   DRAWTEXT("BUY LIQ", xLab, yBuy + stp, SansSerif, Bold, 10) COLOURED(dnR, dnG, dnB, 255)
   IF buyVol >= 1000000000 THEN
      vTxt = round(buyVol / 10000000) / 100
      DRAWTEXT("#vTxt#B", xLab, yBuy, SansSerif, Standard, 10) COLOURED(dnR, dnG, dnB, 255)
   ELSIF buyVol >= 1000000 THEN
      vTxt = round(buyVol / 10000) / 100
      DRAWTEXT("#vTxt#M", xLab, yBuy, SansSerif, Standard, 10) COLOURED(dnR, dnG, dnB, 255)
   ELSIF buyVol >= 1000 THEN
      vTxt = round(buyVol / 10) / 100
      DRAWTEXT("#vTxt#K", xLab, yBuy, SansSerif, Standard, 10) COLOURED(dnR, dnG, dnB, 255)
   ELSE
      vTxt = round(buyVol)
      DRAWTEXT("#vTxt#", xLab, yBuy, SansSerif, Standard, 10) COLOURED(dnR, dnG, dnB, 255)
   ENDIF
   DRAWTEXT("#buyPct#%", xLab, yBuy - stp, SansSerif, Standard, 10) COLOURED(dnR, dnG, dnB, 255)

   // liquidity above the price
   ySell = close + (hiP - close) / 2
   DRAWTEXT("SELL LIQ", xLab, ySell + stp, SansSerif, Bold, 10) COLOURED(upR, upG, upB, 255)
   IF sellVol >= 1000000000 THEN
      vTxt = round(sellVol / 10000000) / 100
      DRAWTEXT("#vTxt#B", xLab, ySell, SansSerif, Standard, 10) COLOURED(upR, upG, upB, 255)
   ELSIF sellVol >= 1000000 THEN
      vTxt = round(sellVol / 10000) / 100
      DRAWTEXT("#vTxt#M", xLab, ySell, SansSerif, Standard, 10) COLOURED(upR, upG, upB, 255)
   ELSIF sellVol >= 1000 THEN
      vTxt = round(sellVol / 10) / 100
      DRAWTEXT("#vTxt#K", xLab, ySell, SansSerif, Standard, 10) COLOURED(upR, upG, upB, 255)
   ELSE
      vTxt = round(sellVol)
      DRAWTEXT("#vTxt#", xLab, ySell, SansSerif, Standard, 10) COLOURED(upR, upG, upB, 255)
   ENDIF
   DRAWTEXT("#sellPct#%", xLab, ySell - stp, SansSerif, Standard, 10) COLOURED(upR, upG, upB, 255)

   // imbalance: volume below minus volume above the price
   yImb = hiP + stp
   xImb = barindex + 52
   IF sellVol > 0 THEN
      imb = buyVol - sellVol
      imbAbs = abs(imb)
      IF imbAbs >= 1000000000 THEN
         vTxt = round(imb / 10000000) / 100
         DRAWTEXT("Imbalance: #vTxt#B", xImb, yImb, SansSerif, Standard, 10) COLOURED(0, 0, 0, 255)
      ELSIF imbAbs >= 1000000 THEN
         vTxt = round(imb / 10000) / 100
         DRAWTEXT("Imbalance: #vTxt#M", xImb, yImb, SansSerif, Standard, 10) COLOURED(0, 0, 0, 255)
      ELSIF imbAbs >= 1000 THEN
         vTxt = round(imb / 10) / 100
         DRAWTEXT("Imbalance: #vTxt#K", xImb, yImb, SansSerif, Standard, 10) COLOURED(0, 0, 0, 255)
      ELSE
         vTxt = round(imb)
         DRAWTEXT("Imbalance: #vTxt#", xImb, yImb, SansSerif, Standard, 10) COLOURED(0, 0, 0, 255)
      ENDIF
   ELSE
      DRAWTEXT("Imbalance: NaN", xImb, yImb, SansSerif, Standard, 10) COLOURED(0, 0, 0, 255)
   ENDIF
ENDIF

RETURN
![[SMC] Clean Liquidity Heatmap](https://www.prorealcode.com/wp-content/uploads/2026/03/TSLA-Diario-3-150x150.png)