




More from ProRealCode
ProRealCode - Trading & Coding with ProRealTime™



Volumetric Regression Heatmap
Introduction
Two ideas get combined here, and the second one is easy to miss.
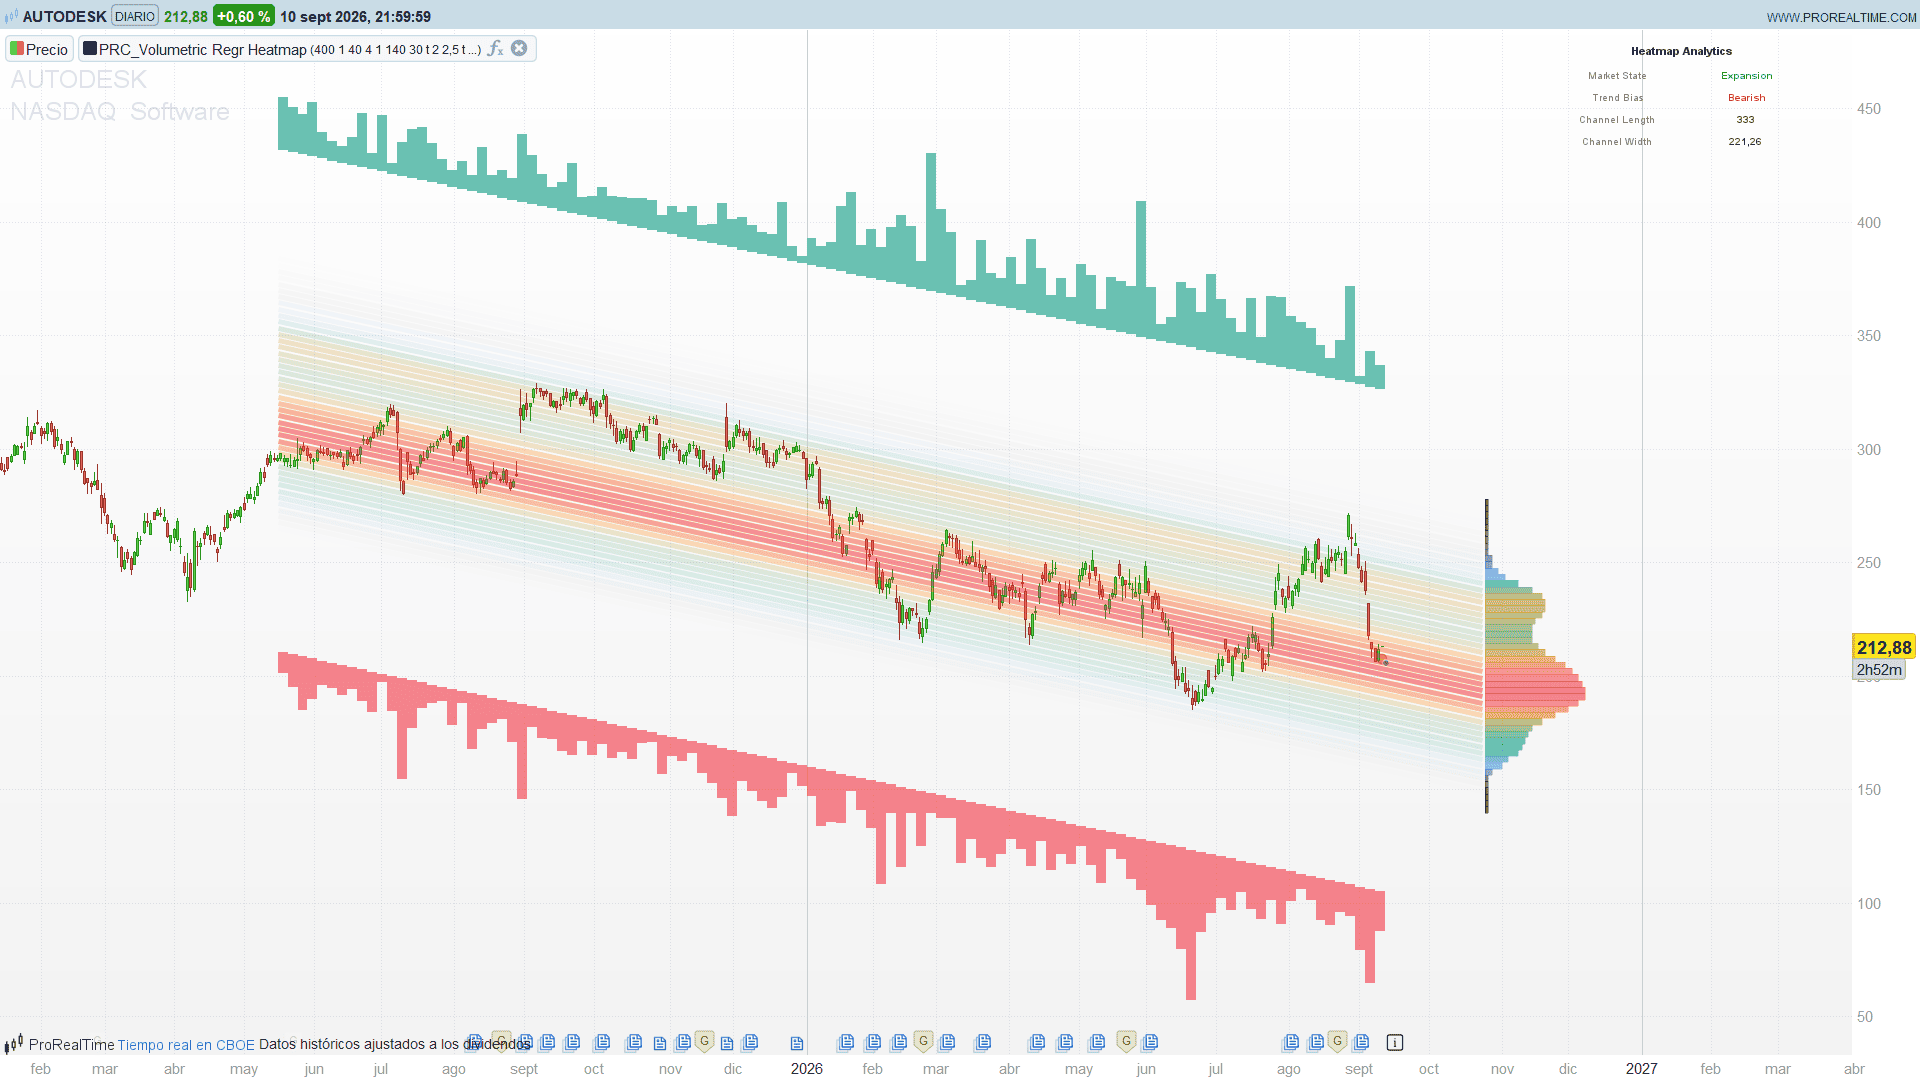
The first is a detrended volume profile. A regression line is fitted through the last few hundred bars, the channel around it is sliced into parallel rows, and every bar’s volume is filed into the row matching how far that bar sat from the line — not what absolute price it traded at. Colour the rows by how much volume they hold and you get a heat map that leans with the trend: the hot band is the zone of value, and it is a sloping corridor rather than a horizontal shelf.
The second idea is the window itself. The number of bars in the fit is not fixed. It is scaled by the ratio of slow volatility to fast volatility:
window = base x ATR(200) / ATR(20)
When short-term volatility spikes above its own long-run level, the window contracts. When the market goes quiet, it stretches. The fit therefore spans a roughly constant amount of price movement instead of a constant amount of time. A 400-bar channel on a sleepy session and a 400-bar channel during a shock are not the same measurement, and this is a cheap, honest way of admitting it.
Everything else — the buy/sell histograms along the edges, the profile on the right, the reversion dots — is read-out on top of those two ideas.
Theory Behind the Indicator
1. The fit
Ordinary least squares of the source on the bar number, over the adaptive window. Nothing exotic: two sums give the slope, two more give the intercept.
Because the fit is a straight line, the value at any bar k of the window is just b + m·k. There is no need to store a curve: two numbers describe the whole channel, its projection into the future included. Each of the eighty heat map rows is then a parallel copy of that line, which means a single segment draws a row from end to end.
2. The rows
The dispersion used for the channel is the standard deviation of the source, not of the residuals. That distinction matters more than it looks.
The residual deviation asks “how tightly do the prices hug the line?” The source deviation asks “how spread out are the prices around their own mean?” In a steep trend the second is much larger than the first, because the trend itself contributes to the spread. So a trending channel automatically gets a wide band, and a flat one gets a narrow band — which is precisely what makes the flatness filter in section 6 work.
Rows are spaced 3·SD / numBins apart, so the outermost row lands exactly on ±3 SD and the heat map covers a six-sigma corridor.
3. Volume by distance
For every bar in the window:
row   = floor( (source - fit) / rowHeight ) + numBins
rows[row] = rows[row] + volume
Volume falling outside ±3 SD is discarded. That is deliberate: the point of the profile is where the market does its business, and a handful of six-sigma bars would otherwise smear the colour scale.
4. Smoothing and colour
Raw bins are noisy — with eighty rows over a few hundred bars, individual rows swing wildly. A binomial kernel [1 4 6 4 1] / 16 is applied a handful of times, which is a cheap Gaussian blur along the price axis. It does not move the centre of mass of the distribution; it only stops neighbouring rows from disagreeing violently.
The colour then runs through five stops — transparent, blue, green, orange, red — but not on the raw ratio. It runs on its 0.7 power:
ratio = (rowVolume / maxVolume) ^ 0.7
The exponent lifts the low readings. Without it, a distribution with one dominant row leaves everything else clustered near zero and the cold half of the scale collapses into a single flat colour. It is a small detail that does most of the work in making the map readable.
5. The buy/sell split
The histograms hanging off the ±3 SD edges split each bar’s volume by where it closed inside its own range:
buy  = volume x (close - low)  / (high - low)
sell = volume x (high - close) / (high - low)
This is an estimator, not a measurement — it has no access to the order book and assumes a bar closing on its high was bought all the way up. Treat it as a shape, not as a number. What it is genuinely good for is spotting a divergence between the two sides while price sits still.
6. The reversion dots
A dot is plotted when the close crosses beyond ±2 SD, but only while the channel is flat, defined as:
| endValue - startValue | < SD x slopeThreshold
This filter is the difference between a mean reversion tool and a losing one. In a trending channel the price is constantly far from the line, and every one of those excursions looks like a stretched rubber band right up until it isn’t. The condition above says: only call it a reversion when the channel has no meaningful slope, so that “far from the line” cannot simply mean “the trend is working”.
Raise the threshold and you get more dots in more conditions; lower it and the indicator only speaks when the market is genuinely going sideways. The default of 2.5 is permissive.
How to Read It
The hot band is the zone of value, sloping with the trend. Price inside it is trading where the volume is; price at the cold edges is trading where almost nobody did.
The profile on the right projects the same distribution forward, which is the useful part: it says where the value zone will be a few dozen bars from now if the current fit holds. It answers “is the market stretched?” in a way a horizontal profile cannot once the trend has run.
The panel reports the state. Contraction means the flatness test passed and the dots are live. Expansion means the channel has a slope and the reversion logic is deliberately silent — that is not a malfunction, it is the filter doing its job.
Two habits worth forming. First, watch the channel length in the panel: a sudden contraction of the window is itself a volatility signal, before anything else on the chart has moved. Second, when the hot band and the current price separate sharply while the state still reads Contraction, that is the setup the indicator is built to find.
Settings
- baseLen (400) — base number of bars in the fit. The adaptive rule scales this.
- dynLen (1) — set to 0 for a fixed window of exactly
baseLenbars. - numBins (40) — rows on each side of the line. Higher is finer and slower.
- smoothN (4) — blur passes over the distribution. 0 leaves the raw bins.
- hmDens (1) — strokes drawn per row. Raise to 2 or 3 if the heat map shows gaps at high zoom.
- hmAlpha (140) — opacity of the hottest band, 0 to 255. Lower it if the candles get buried.
- extendLen (30) — bars of forward projection.
- showSigs / sigBand / slopeThr — the reversion dots, their band in standard deviations, and the flatness threshold.
- showDelta / dStep / dScale — the edge histograms, the bars grouped per block, and their height.
- showProf / profWid — the projected profile on the right and its maximum width in bars.
- showPanel (1) — the analytics panel.
Two notes on performance. With the defaults the indicator places roughly 640 objects on the chart; with the adaptive window near its ceiling that passes a thousand. If it feels heavy, raise dStep first — the edge histograms are the expensive part — and turn showDelta off second.
And give the chart enough history. The adaptive window can ask for up to 1000 bars, and the slow volatility term needs 200 on its own. If there are not enough bars loaded the indicator says so on screen instead of drawing nothing.
ProBuilder Code
//----------------------------------------------
//PRC_Volumetric Regression Heatmap
//version = 0
//11.09.2026
//Ivan Gonzalez @ www.prorealcode.com
//Author: LuxAlgo
//Sharing ProRealTime knowledge
//----------------------------------------------
// The whole picture is rebuilt from scratch on the last bar, so the previous
// pass has to be wiped: without this every incoming bar stacks another full set
// of bands on top of the old one.
DEFPARAM drawonlastbaronly = true
//----------------------------------------------
// --- Inputs (declare them as Variables in the editor) ---
baseLen   = 400   // Base period: bars in the regression fit window
dynLen    = 1     // 1 = the period adapts to volatility (ATR 200 / ATR 20), 0 = fixed
numBins   = 40    // Heatmap rows on each side of the regression line
smoothN   = 4     // Binomial smoothing passes applied to the volume distribution
hmDens    = 1     // Bands drawn per row: raise to 2 or 3 if a comb pattern shows up
hmAlpha   = 140   // Opacity of the hottest band (0..255). Lower it if it buries the candles
extendLen = 30    // Bars the heatmap is projected into the future
showSigs  = 1     // 1 = plot the mean reversion dots
sigBand   = 2.0   // Standard deviations the close must clear to trigger a dot
slopeThr  = 2.5   // Max channel rise / SD ratio still counted as a flat channel
showDelta = 1     // 1 = draw the buy/sell volume histograms above and below the channel
dStep     = 3     // Bars per histogram block: raise it to draw fewer objects
dScale    = 0.6   // Histogram height, as a fraction of half the channel height
showProf  = 1     // 1 = draw the volume profile to the right of the projection
profWid   = 30    // Max width of that profile, in bars
showPanel = 1     // 1 = draw the analytics panel
maxSigs   = 200   // Safety cap on the number of dots
//----------------------------------------------
// --- Panel placement (pixels from the top right corner) ---
dashX   = 0 - 300
dashCol = 130
dashY   = 0 - 20
//----------------------------------------------
// --- Heatmap gradient, cold to hot (LuxAlgo stops) ---
// The five alphas hold a fixed ratio to each other (13 / 26 / 51 / 102 out of
// 102) and are scaled as a group by hmAlpha, so a single setting drives the
// intensity of the whole map without flattening the contrast between rows.
//----------------------------------------------
g1R = 0
g1G = 0
g1B = 0
g1A = 0
g2R = 91
g2G = 156
g2B = 246
g2A = round(hmAlpha * 0.127)
g3R = 8
g3G = 153
g3B = 129
g3A = round(hmAlpha * 0.255)
g4R = 255
g4G = 152
g4B = 0
g4A = round(hmAlpha * 0.5)
g5R = 242
g5G = 54
g5B = 69
g5A = hmAlpha
//----------------------------------------------
// --- Other colours (mid tones: readable on a light and on a dark background) ---
//----------------------------------------------
buyR = 8
buyG = 153
buyB = 129
selR = 242
selG = 54
selB = 69
wrnR = 214
wrnG = 128
wrnB = 0
txtR = 60
txtG = 60
txtB = 60
neuR = 128
neuG = 128
neuB = 128
//----------------------------------------------
srcV = (high + low) / 2

//----------------------------------------------
//=== 1. ADAPTIVE WINDOW LENGTH ===
// Slow ATR over fast ATR: the window shrinks when volatility picks up and
// stretches when it dies down, so the fit always spans a comparable amount of
// price movement instead of a fixed amount of time.
//----------------------------------------------
atrFast = averagetruerange[20](close)
atrSlow = averagetruerange[200](close)

nBars = baseLen
IF dynLen = 1 AND barindex > 200 AND atrFast > 0 THEN
   nBars = round(baseLen * atrSlow / atrFast)
   nBars = max(50, min(nBars, 1000))
ENDIF

IF islastbarupdate AND barindex >= nBars THEN

   bx0 = barindex - (nBars - 1)
   totalLen = nBars + extendLen
   nRows = numBins * 2

   //----------------------------------------------
   //=== 2. LEAST SQUARES FIT ===
   // k = 0 is the oldest bar of the window and k = nBars-1 the current one, so
   // the fitted value at k is just bInt + mSlp * k. Solving the algebra this way
   // removes the array of predictions the original carries around: a straight
   // line needs two numbers, not a thousand.
   //----------------------------------------------
   sumX = 0
   sumY = 0
   sumXY = 0
   sumX2 = 0
   FOR k = 0 TO nBars - 1 DO
      yv = srcV[nBars - 1 - k]
      sumX = sumX + k
      sumY = sumY + yv
      sumXY = sumXY + k * yv
      sumX2 = sumX2 + k * k
   NEXT

   mSlp = (nBars * sumXY - sumX * sumY) / (nBars * sumX2 - sumX * sumX)
   bInt = (sumY - mSlp * sumX) / nBars
   meanY = sumY / nBars
   startV = bInt
   endV = bInt + mSlp * (nBars - 1)

   //----------------------------------------------
   //=== 3. DISPERSION AND MARKET STATE ===
   // The deviation is measured on the SOURCE, not on the residuals, exactly as
   // in the original: it is the spread of the prices around their own mean, so
   // a steep channel gets a wide band even if the fit is tight.
   //----------------------------------------------
   sumSq = 0
   FOR k = 0 TO nBars - 1 DO
      yv = srcV[nBars - 1 - k] - meanY
      sumSq = sumSq + yv * yv
   NEXT
   sdVal = sqrt(sumSq / nBars)

   binDev = (sdVal * 3) / numBins
   totRise = abs(endV - startV)

   isContr = 0
   IF totRise < sdVal * slopeThr THEN
      isContr = 1
   ENDIF

   //----------------------------------------------
   //=== 4. VOLUME BINNED BY DISTANCE TO THE REGRESSION LINE ===
   // The bins are wiped on every pass. With the market open ProRealTime re-runs
   // the last bar on every tick and the $ arrays are NOT rewound, so without the
   // reset the profile would inflate tick after tick.
   //----------------------------------------------
   nBlk = ceil(nBars / dStep)

   FOR i = 0 TO nRows - 1 DO
      $binVol[i] = 0
   NEXT
   FOR j = 0 TO nBlk - 1 DO
      $dBuy[j] = 0
      $dSell[j] = 0
   NEXT

   IF binDev > 0 THEN
      FOR k = 0 TO nBars - 1 DO
         oIx = nBars - 1 - k
         fitK = bInt + mSlp * k
         volK = volume[oIx]

         binIdx = floor((srcV[oIx] - fitK) / binDev) + numBins
         IF binIdx >= 0 AND binIdx < nRows THEN
            $binVol[binIdx] = $binVol[binIdx] + volK
         ENDIF

         // Buy / sell split of the bar volume, same estimator as the original:
         // where the bar closed inside its own range decides the share.
         hlRng = high[oIx] - low[oIx]
         IF hlRng > 0 THEN
            bVol = volK * (close[oIx] - low[oIx]) / hlRng
            sVol = volK * (high[oIx] - close[oIx]) / hlRng
         ELSE
            bVol = volK / 2
            sVol = volK / 2
         ENDIF

         jBlk = floor(k / dStep)
         $dBuy[jBlk] = $dBuy[jBlk] + bVol
         $dSell[jBlk] = $dSell[jBlk] + sVol
      NEXT
   ENDIF

   //----------------------------------------------
   //=== 5. DELTA BLOCKS ===
   // Averaging inside the block instead of summing keeps the histogram height
   // invariant to dStep: raising it draws fewer objects, not taller bars.
   //----------------------------------------------
   maxDlt = 0
   FOR j = 0 TO nBlk - 1 DO
      nIn = min(dStep, nBars - j * dStep)
      $dBuy[j] = $dBuy[j] / nIn
      $dSell[j] = $dSell[j] / nIn
      IF $dBuy[j] > maxDlt THEN
         maxDlt = $dBuy[j]
      ENDIF
      IF $dSell[j] > maxDlt THEN
         maxDlt = $dSell[j]
      ENDIF
   NEXT

   //----------------------------------------------
   //=== 6. SMOOTHING OF THE VOLUME DISTRIBUTION ===
   // Binomial kernel [1 4 6 4 1] / 16 applied smoothN times, out of place. The
   // clamped indices reproduce the edge replication of the original exactly.
   //----------------------------------------------
   FOR i = 0 TO nRows - 1 DO
      $smB[i] = $binVol[i]
   NEXT

   FOR s = 1 TO smoothN DO
      FOR i = 0 TO nRows - 1 DO
         $tmpB[i] = $smB[i]
      NEXT
      FOR i = 0 TO nRows - 1 DO
         iL1 = max(0, i - 1)
         iR1 = min(nRows - 1, i + 1)
         iL2 = max(0, i - 2)
         iR2 = min(nRows - 1, i + 2)
         $smB[i] = ($tmpB[iL2] + $tmpB[iL1] * 4 + $tmpB[i] * 6 + $tmpB[iR1] * 4 + $tmpB[iR2]) / 16
      NEXT
   NEXT

   maxVol = 0
   FOR i = 0 TO nRows - 1 DO
      IF $smB[i] > maxVol THEN
         maxVol = $smB[i]
      ENDIF
   NEXT

   //----------------------------------------------
   //=== 7. COLOUR OF EACH ROW ===
   // Five stops interpolated in four equal slices, on the 0.7 power of the
   // normalised volume: the exponent lifts the low readings so the cold half of
   // the scale does not collapse into a single flat colour. The colour is worked
   // out once per row and cached in an array, because the heatmap and the side
   // profile read exactly the same colours.
   //----------------------------------------------
   IF maxVol > 0 THEN
      FOR i = 0 TO nRows - 1 DO
         gRat = 0
         IF $smB[i] > 0 THEN
            gRat = pow($smB[i] / maxVol, 0.7)
         ENDIF

         IF gRat < 0.25 THEN
            gFrac = gRat / 0.25
            loR = g1R
            loGi = g1G
            loB = g1B
            loA = g1A
            hiR = g2R
            hiG = g2G
            hiB = g2B
            hiA = g2A
         ELSIF gRat < 0.5 THEN
            gFrac = (gRat - 0.25) / 0.25
            loR = g2R
            loGi = g2G
            loB = g2B
            loA = g2A
            hiR = g3R
            hiG = g3G
            hiB = g3B
            hiA = g3A
         ELSIF gRat < 0.75 THEN
            gFrac = (gRat - 0.5) / 0.25
            loR = g3R
            loGi = g3G
            loB = g3B
            loA = g3A
            hiR = g4R
            hiG = g4G
            hiB = g4B
            hiA = g4A
         ELSE
            gFrac = (gRat - 0.75) / 0.25
            loR = g4R
            loGi = g4G
            loB = g4B
            loA = g4A
            hiR = g5R
            hiG = g5G
            hiB = g5B
            hiA = g5A
         ENDIF

         $cR[i] = round(loR + (hiR - loR) * gFrac)
         $cG[i] = round(loGi + (hiG - loGi) * gFrac)
         $cB[i] = round(loB + (hiB - loB) * gFrac)
         $cA[i] = round(loA + (hiA - loA) * gFrac)
      NEXT
   ENDIF

   //----------------------------------------------
   //=== 8. HEATMAP BANDS ===
   // Every band is a straight line parallel to the fit, so a single DRAWSEGMENT
   // spans the whole window plus the projection - no need to chop it into pieces
   // the way a curved fit would demand.
   // The stroke is capped at 5 pixels, so on a tall chart the rows can stop
   // touching each other and leave a comb pattern. hmDens is the fix: it
   // oversamples the rows, inserting extra strokes between them with the colour
   // interpolated from the two neighbours.
   //----------------------------------------------
   IF maxVol > 0 THEN
      nLine = nRows * hmDens
      x2h = barindex + extendLen
      y2Base = bInt + mSlp * (totalLen - 1)

      FOR q = 0 TO nLine - 1 DO
         posB = (q + 0.5) / hmDens
         offB = (posB - numBins) * binDev

         uPos = max(0, min(posB - 0.5, nRows - 1))
         i0 = floor(uPos)
         i1 = min(i0 + 1, nRows - 1)
         fr = uPos - i0

         cr = round($cR[i0] * (1 - fr) + $cR[i1] * fr)
         cg = round($cG[i0] * (1 - fr) + $cG[i1] * fr)
         cb = round($cB[i0] * (1 - fr) + $cB[i1] * fr)
         ca = round($cA[i0] * (1 - fr) + $cA[i1] * fr)

         DRAWSEGMENT(bx0, bInt + offB, x2h, y2Base + offB) STYLE(line, 5) COLOURED(cr, cg, cb, ca)
      NEXT
   ENDIF

   //----------------------------------------------
   //=== 9. VOLUME PROFILE TO THE RIGHT OF THE PROJECTION ===
   // Same rows as the heatmap, laid on their side. The height of each bar is one
   // row in PRICE units, so it keeps its meaning at any zoom level.
   //----------------------------------------------
   IF showProf = 1 AND maxVol > 0 THEN
      yEnd = bInt + mSlp * (totalLen - 1)
      xP0 = barindex + extendLen + 1

      FOR i = 0 TO nRows - 1 DO
         IF $smB[i] > 0 THEN
            yLo = yEnd + (i - numBins) * binDev
            lenB = max(1, round(($smB[i] / maxVol) * profWid))
            cr = $cR[i]
            cg = $cG[i]
            cb = $cB[i]
            DRAWRECTANGLE(xP0, yLo, xP0 + lenB, yLo + binDev) COLOURED(cr, cg, cb, 76) FILLCOLOR(cr, cg, cb, 153)
         ENDIF
      NEXT
   ENDIF

   //----------------------------------------------
   //=== 10. BUY / SELL VOLUME HISTOGRAMS ===
   // They hang off the +/-3 SD edges of the channel. Drawn as rectangles whose
   // width is a number of BARS, not of pixels, so they keep their proportions
   // when the chart is zoomed.
   //----------------------------------------------
   IF showDelta = 1 AND maxDlt > 0 THEN
      maxH = sdVal * 3 * dScale

      FOR j = 0 TO nBlk - 1 DO
         kA = j * dStep
         kC = kA + dStep / 2
         xA = bx0 + kA
         xB = min(barindex + 1, xA + dStep)

         fitK = bInt + mSlp * kC
         topB = fitK + sdVal * 3
         botB = fitK - sdVal * 3
         hB = ($dBuy[j] / maxDlt) * maxH
         hS = ($dSell[j] / maxDlt) * maxH

         IF hB > 0 THEN
            DRAWRECTANGLE(xA, topB, xB, topB + hB) COLOURED(buyR, buyG, buyB, 0) FILLCOLOR(buyR, buyG, buyB, 153)
         ENDIF
         IF hS > 0 THEN
            DRAWRECTANGLE(xA, botB - hS, xB, botB) COLOURED(selR, selG, selB, 0) FILLCOLOR(selR, selG, selB, 153)
         ENDIF
      NEXT
   ENDIF

   //----------------------------------------------
   //=== 11. MEAN REVERSION DOTS ===
   // Only while the channel is flat. In a trending channel every touch of the
   // band looks like a reversion that never arrives, and that is exactly what
   // the slope filter is there to avoid.
   //----------------------------------------------
   IF showSigs = 1 AND isContr = 1 AND binDev > 0 THEN
      nSig = 0
      devSig = sdVal * sigBand

      FOR k = 1 TO nBars - 1 DO
         IF nSig < maxSigs THEN
            oIx = nBars - 1 - k
            fitK = bInt + mSlp * k
            fitP = fitK - mSlp
            cC = close[oIx]
            cP = close[oIx + 1]

            IF cP >= fitP - devSig AND cC < fitK - devSig THEN
               DRAWPOINT(bx0 + k, low[oIx], 4) COLOURED(buyR, buyG, buyB, 255)
               nSig = nSig + 1
            ENDIF
            IF cP <= fitP + devSig AND cC > fitK + devSig THEN
               DRAWPOINT(bx0 + k, high[oIx], 4) COLOURED(selR, selG, selB, 255)
               nSig = nSig + 1
            ENDIF
         ENDIF
      NEXT
   ENDIF

   //----------------------------------------------
   //=== 12. ANALYTICS PANEL ===
   //----------------------------------------------
   IF showPanel = 1 THEN
      chWid = round(sdVal * 600) / 100

      DRAWTEXT("Heatmap Analytics", dashX + 65, dashY, sansserif, bold, 11) COLOURED(txtR, txtG, txtB, 255) ANCHOR(topright, xshift, yshift)

      DRAWTEXT("Market State", dashX, dashY - 24, sansserif, standard, 10) COLOURED(neuR, neuG, neuB, 255) ANCHOR(topright, xshift, yshift)
      IF isContr = 1 THEN
         DRAWTEXT("Contraction", dashX + dashCol, dashY - 24, sansserif, bold, 10) COLOURED(wrnR, wrnG, wrnB, 255) ANCHOR(topright, xshift, yshift)
      ELSE
         DRAWTEXT("Expansion", dashX + dashCol, dashY - 24, sansserif, bold, 10) COLOURED(buyR, buyG, buyB, 255) ANCHOR(topright, xshift, yshift)
      ENDIF

      DRAWTEXT("Trend Bias", dashX, dashY - 46, sansserif, standard, 10) COLOURED(neuR, neuG, neuB, 255) ANCHOR(topright, xshift, yshift)
      IF mSlp > 0 THEN
         DRAWTEXT("Bullish", dashX + dashCol, dashY - 46, sansserif, bold, 10) COLOURED(buyR, buyG, buyB, 255) ANCHOR(topright, xshift, yshift)
      ELSE
         DRAWTEXT("Bearish", dashX + dashCol, dashY - 46, sansserif, bold, 10) COLOURED(selR, selG, selB, 255) ANCHOR(topright, xshift, yshift)
      ENDIF

      DRAWTEXT("Channel Length", dashX, dashY - 68, sansserif, standard, 10) COLOURED(neuR, neuG, neuB, 255) ANCHOR(topright, xshift, yshift)
      DRAWTEXT("#nBars#", dashX + dashCol, dashY - 68, sansserif, bold, 10) COLOURED(txtR, txtG, txtB, 255) ANCHOR(topright, xshift, yshift)

      DRAWTEXT("Channel Width", dashX, dashY - 90, sansserif, standard, 10) COLOURED(neuR, neuG, neuB, 255) ANCHOR(topright, xshift, yshift)
      DRAWTEXT("#chWid#", dashX + dashCol, dashY - 90, sansserif, bold, 10) COLOURED(txtR, txtG, txtB, 255) ANCHOR(topright, xshift, yshift)
   ENDIF

ELSIF islastbarupdate THEN

   //----------------------------------------------
   //=== NOT ENOUGH HISTORY ===
   // Without this the indicator would just come up blank and look broken. The
   // adaptive period can ask for up to 1000 bars, so the chart has to be loaded
   // with at least that many units.
   //----------------------------------------------
   DRAWTEXT("Volumetric Regression Heatmap", dashX + 85, dashY, sansserif, bold, 11) COLOURED(txtR, txtG, txtB, 255) ANCHOR(topright, xshift, yshift)
   DRAWTEXT("Not enough history: needs #nBars# bars", dashX + 85, dashY - 24, sansserif, standard, 10) COLOURED(selR, selG, selB, 255) ANCHOR(topright, xshift, yshift)

ENDIF

RETURN