





Liquidity Void Detector
Introduction
Not every strong bar means the same thing. A large move backed by heavy volume shows real participation; the same move on a quiet bar often means that price travelled through a thin order book, a liquidity void. Those moves tend to leave an inefficiency behind, and price frequently comes back to fill it.
The Liquidity Void Detector measures exactly that combination. It scores how unusual the last bar’s return is and keeps that score at full strength only when the bar was traded on unusually low volume. The result is an oscillator that stays close to zero most of the time and spikes when price moves hard without the crowd behind it.
Theory Behind the Indicator
The indicator combines two standardised measures.
Volume shock. For every bar it compares the volume with its recent baseline on a logarithmic scale:
VS = ln(volume) – ln(SMA(volume, 30))
This shock is then turned into a z-score over the last 60 values. A bar is considered low volume when that z-score is at or below -0.5, that is, when participation is clearly below what has been normal recently.
Return z-score. The one-bar log return, ln(close / previous close), is standardised against its own last 60 values. A value of +2 means the bar rose about two standard deviations more than usual.
The oscillator. The return z-score is multiplied by a weight:
- weight = 1 when the bar is low volume;
- weight = 0.01 (the fade parameter) when it is not.
So a big move on normal or heavy volume barely registers, while a big move on thin volume shows up at full size. Bars with zero volume are left out of the volume statistics.
Key Features at a Glance
- Volume shock measured against an adjustable moving-average baseline.
- Return and volume both standardised with z-scores, so the oscillator reads the same on any instrument.
- Adjustable weight for bars that are not low volume, from “ignore them” to “pure return reversal”.
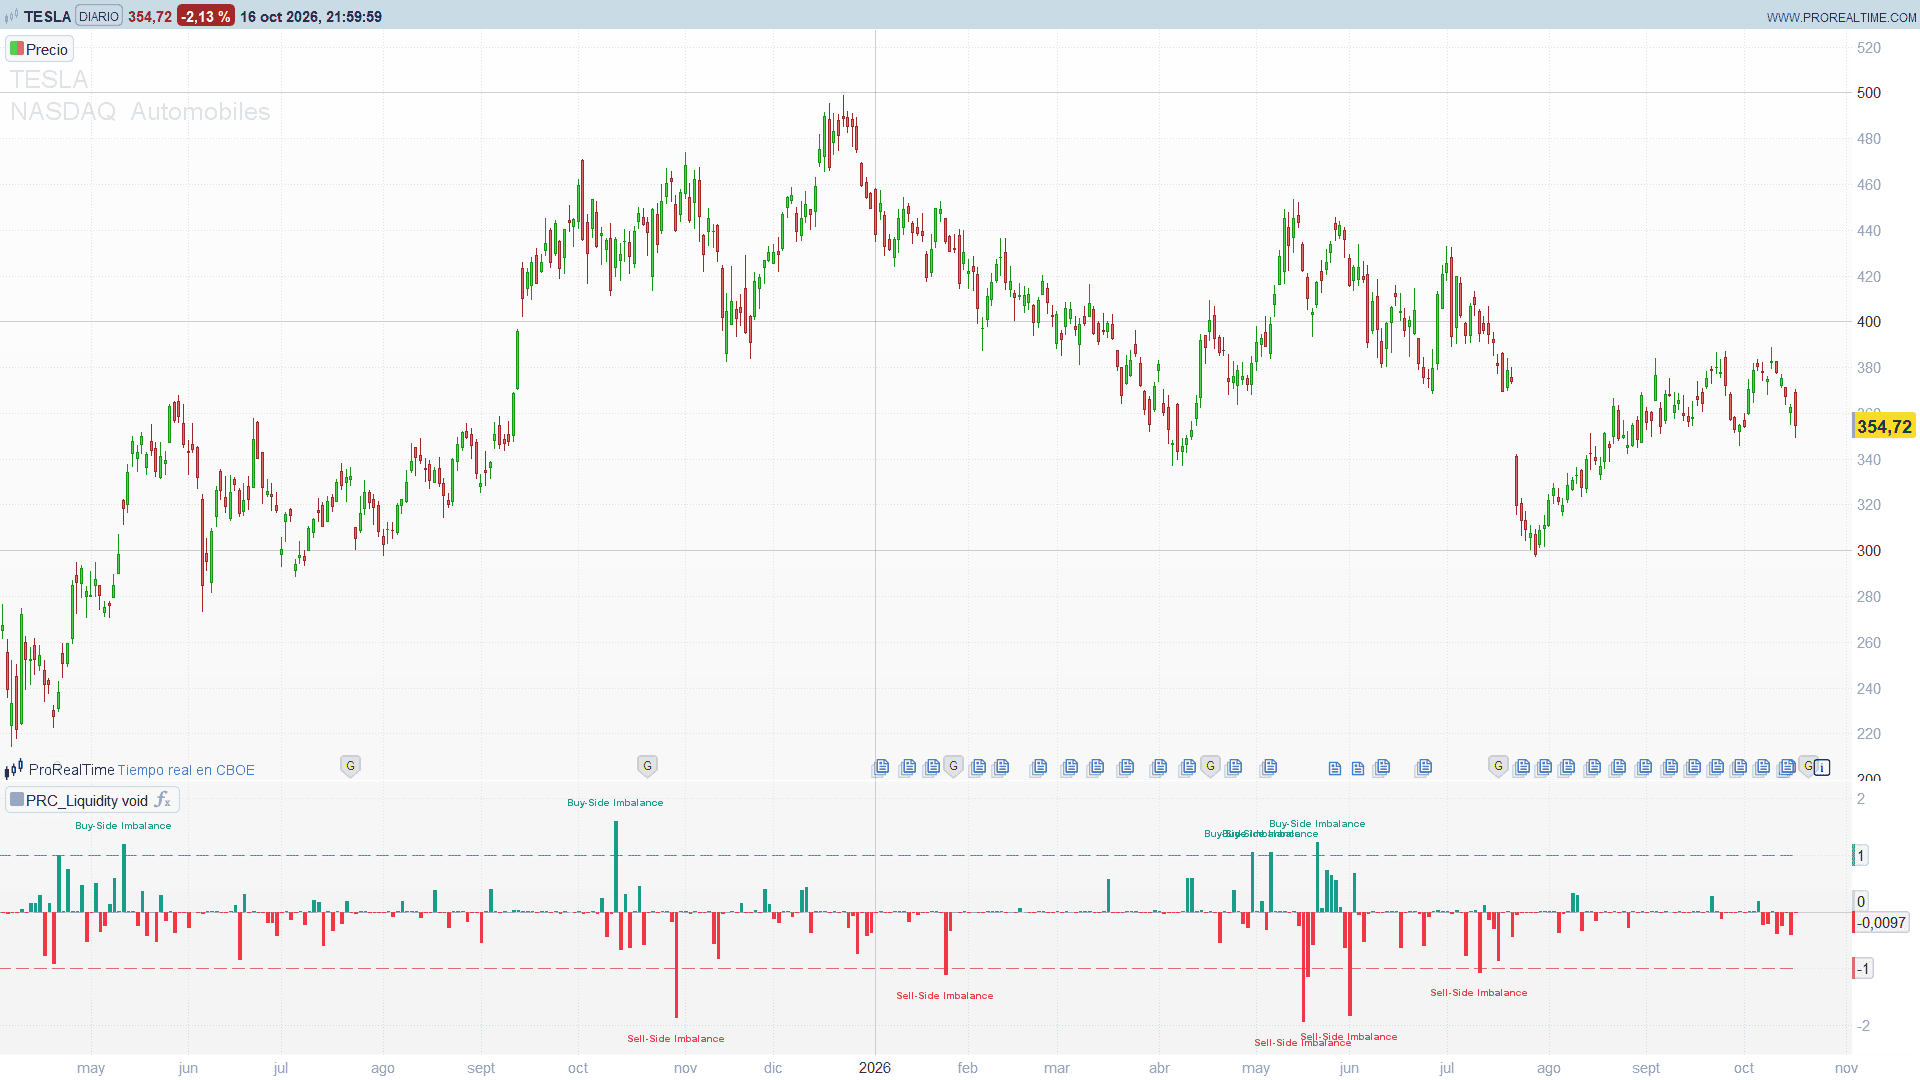
- Columns coloured by sign: teal above zero, red below.
- Upper and lower thresholds drawn as dashed lines.
- “Buy-Side Imbalance” and “Sell-Side Imbalance” labels when the oscillator crosses the thresholds.
How to Read the Indicator
- Teal column above +1: price jumped up on thin volume. The label “Buy-Side Imbalance” marks the cross. The move is considered inefficient and the expectation is a pullback that fills part of it.
- Red column below -1: price dropped on thin volume. “Sell-Side Imbalance” marks the cross, and the expectation is a rebound.
- Small columns around zero: either the move was ordinary or it happened on normal volume. Nothing to act on.
The labels appear on the bar where the oscillator crosses the threshold, not on every bar beyond it. The indicator needs real volume: on instruments without volume data, no bar is ever low volume and the oscillator stays near zero.
Practical Applications
- Mean-reversion entries: look for a fade of the move after an imbalance label, ideally confirmed by price action on the following bars.
- Gap and spike filter: a sharp move flagged as a liquidity void deserves less trust than the same move on heavy volume.
- Targets: the start of the thin-volume move is a natural area where the fill may stop.
- Alerts: create an alert on the “Liquidity Void Oscillator” line crossing over 1 or under -1 to be notified of new imbalances.
Indicator Configuration
- volLen (default 30): length of the volume baseline (SMA of volume) used for the volume shock. Bigger values give a smoother baseline and fewer low-volume bars. Typical: 20 to 60.
- vzLen (default 60): lookback of the volume shock z-score. Larger values give fewer extremes.
- vzThr (default -0.5): low-volume threshold. A bar is low volume when the volume shock z-score is at or below this value. Typical: -0.5 to -1.0.
- rLen (default 60): lookback of the return z-score.
- fadeNoLow (default 0.01): weight applied when volume is not low. 0 ignores those bars completely; 1 makes the volume condition irrelevant (pure return reversal). Typical: 0.10 to 0.50 for a less selective reading.
- longThr (default 1.0): upper threshold.
- shortThr (default -1.0): lower threshold.
The Code
//---------------------------------------------------------------
// PRC_Liquidity Void
// version = 0
// 19.10.2026
// Iván González @ www.prorealcode.com
// Author: Zeiierman
// Sharing ProRealTime knowledge
//--------------------------------------------------------------------//
// Labels are stored when they happen and redrawn on the last bar
DEFPARAM DRAWONLASTBARONLY = true
//--------------------------------------------------------------------//
// Settings
//--------------------------------------------------------------------//
volLen = 30        // Volume baseline length: SMA of volume used for the volume shock
vzLen = 60         // Volume shock z-score lookback
vzThr = -0.5       // Low-volume threshold: the bar is low volume if volume shock z is at or below this value
rLen = 60          // Return z-score lookback (1-bar log return)
fadeNoLow = 0.01   // Weight when volume is NOT low (0 = ignore those bars, 1 = pure return reversal)
longThr = 1.0      // Upper threshold
shortThr = -1.0    // Lower threshold
//--------------------------------------------------------------------//
// Volume shock: VS = ln(volume) - ln(SMA(volume, volLen))
// Bars with zero volume have no VS and are skipped by its z-score
//--------------------------------------------------------------------//
volTrend = average[volLen](volume)
vsOk = 0
vs = 0
IF barindex >= volLen - 1 AND volume > 0 AND volTrend > 0 THEN
   vsOk = 1
   vs = log(volume) - log(volTrend)
ENDIF
ONCE nVs = 0
nVs = nVs + vsOk
//--------------------------------------------------------------------//
// Z-score of the volume shock over its last vzLen valid values
// (population standard deviation)
//--------------------------------------------------------------------//
vsZok = 0
vsZ = 0
IF vsOk = 1 AND nVs >= vzLen THEN
   sumV = 0
   cntV = 0
   jV = 0
   WHILE vzLen > cntV DO
      IF vsOk[jV] = 1 THEN
         sumV = sumV + vs[jV]
         cntV = cntV + 1
      ENDIF
      jV = jV + 1
   WEND
   mV = sumV / vzLen
   ssqV = 0
   FOR kV = 0 TO jV - 1 DO
      IF vsOk[kV] = 1 THEN
         ssqV = ssqV + square(vs[kV] - mV)
      ENDIF
   NEXT
   dV = sqrt(ssqV / vzLen)
   IF dV = 0 THEN
      vsZ = 0
   ELSE
      vsZ = (vs - mV) / dV
   ENDIF
   vsZok = 1
ENDIF
//--------------------------------------------------------------------//
// 1-bar log return and its z-score
//--------------------------------------------------------------------//
retV = 0
IF barindex >= 1 THEN
   retV = log(close / close[1])
ENDIF
//--------------------------------------------------------------------//
// Liquidity Void Oscillator = return z-score x weight
// weight = 1 on low-volume bars, fadeNoLow otherwise
//--------------------------------------------------------------------//
IF barindex >= rLen THEN
   sumR = 0
   FOR kR = 0 TO rLen - 1 DO
      sumR = sumR + retV[kR]
   NEXT
   mR = sumR / rLen
   ssqR = 0
   FOR kR = 0 TO rLen - 1 DO
      ssqR = ssqR + square(retV[kR] - mR)
   NEXT
   dR = sqrt(ssqR / rLen)
   IF dR = 0 THEN
      retZ = 0
   ELSE
      retZ = (retV - mR) / dR
   ENDIF
   IF vsZok = 1 AND vzThr >= vsZ THEN
      weight = 1
   ELSE
      weight = fadeNoLow
   ENDIF
   osc = retZ * weight
ELSE
   osc = undefined
ENDIF
//--------------------------------------------------------------------//
// Column colour: teal above zero, red otherwise
//--------------------------------------------------------------------//
IF osc > 0 THEN
   cR = 8
   cG = 153
   cB = 129
ELSE
   cR = 242
   cG = 54
   cB = 69
ENDIF
//--------------------------------------------------------------------//
// Imbalance labels: oscillator crossing above the upper threshold
// (buy-side imbalance) or below the lower threshold (sell-side imbalance)
//--------------------------------------------------------------------//
// Event coordinates are stored on the event bar and redrawn on the last
// bar; the counter is a scalar, so a cross that disappears within the live
// bar is dropped on the next tick. The last 500 labels are shown.
//--------------------------------------------------------------------//
ONCE nEv = 0
IF osc CROSSES OVER longThr THEN
   $evX[nEv] = barindex
   $evY[nEv] = osc + 0.35
   $evD[nEv] = 1
   nEv = nEv + 1
ENDIF
IF osc CROSSES UNDER shortThr THEN
   $evX[nEv] = barindex
   $evY[nEv] = osc - 0.35
   $evD[nEv] = -1
   nEv = nEv + 1
ENDIF
IF islastbarupdate AND nEv > 0 THEN
   firstEv = max(0, nEv - 500)
   FOR kE = firstEv TO nEv - 1 DO
      IF $evD[kE] = 1 THEN
         DRAWTEXT("Buy-Side Imbalance", $evX[kE], $evY[kE], SansSerif, Bold, 10) COLOURED(8, 153, 129)
      ELSE
         DRAWTEXT("Sell-Side Imbalance", $evX[kE], $evY[kE], SansSerif, Bold, 10) COLOURED(242, 54, 69)
      ENDIF
   NEXT
ENDIF
//--------------------------------------------------------------------//
RETURN osc COLOURED(cR, cG, cB) STYLE(histogram, 2) AS "Liquidity Void Oscillator", 0 COLOURED(120, 123, 134, 77) STYLE(dottedline2, 1) AS "Zero", longThr COLOURED(8, 153, 129, 179) STYLE(dottedline2, 1) AS "Upper Threshold", shortThr COLOURED(242, 54, 69, 179) STYLE(dottedline2, 1) AS "Lower Threshold"
Conclusion
Volume tells you who was behind a move. The Liquidity Void Detector filters out the moves that had real participation and highlights those that did not, giving a clean, standardised signal for spotting inefficient price swings that the market often comes back to fill.