Keltner Channel

Keltner Channel

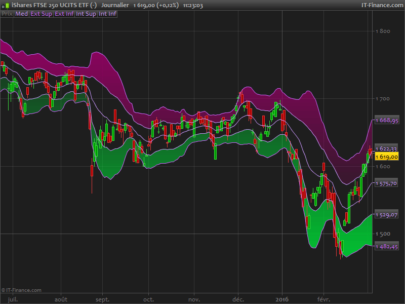
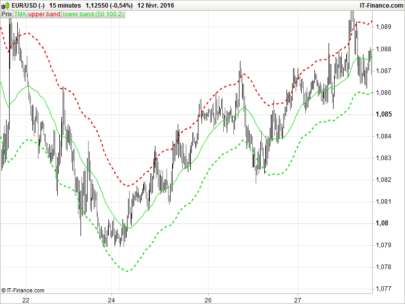
A keltner channel is based on two bands, plotted above and a moving average. It is similar to bollinger bands except it uses Average true range instead of standard deviation. The upper band is a moving average plus some multiple of the Average True Range. The lower band is the moving average minus a multiple of the Average True Range.

Parameters

Period (Period = 10)

Share this

Risk disclosure:

No information on this site is investment advice or a solicitation to buy or sell any financial instrument. Past performance is not indicative of future results. Trading may expose you to risk of loss greater than your deposits and is only suitable for experienced investors who have sufficient financial means to bear such risk.

ProRealTime ITF files and other attachments : How to import ITF files into ProRealTime platform?

PRC is also on YouTube, subscribe to our channel for exclusive content and tutorials

  1. torkelab • 10/12/2015 #

    Hi Nicholas,

    How would you apply this indicator to Adam H Grimes settings?

    “On these charts, I have Keltner channels (set 2.25 ATRs around a 20 period EMA) ”

    https://adamhgrimes.com/technicals-everyone-overbought-oversold/

  2. torkelab • 10/12/2015 #
  3. torkelab • 10/12/2015 #

    Sorry, cant seem to submit an image..?? The link contains one however..

  4. ed65 • 10/12/2015 #

    hi is it possible to duplicate 2 different keltners on same price ie one at 34 2nd at 17 , i cant seem get both

avatar
Register or

Likes

avatar avatar
Related users ' posts
Nicolas
10 years ago
Nicolas
10 years ago
Nicolas
10 years ago
trabucaire Hello, what does it mean the 20 and 40 number on this code ? Thank you !
robertogozzi I modified it to make parameters customizable and to Draw a Grey candlestick when a range is...
Nicolas
10 years ago
Blai5 CazaGaps
Blai5 CazaGaps
0
Indicators
Nicolas
10 years ago
Blai5 BB double
Blai5 BB double
0
Indicators
Nicolas
10 years ago
Blai5 ATLAS Mini
Blai5 ATLAS Mini
0
Indicators
Nicolas
10 years ago
Blai5 Astro indicator
0
Indicators
throwaway200
10 years ago
Super Smoothed WMA
Super Smoothed WMA
0
Indicators
dakaodo Very useful when initially learning the timing and rhythm of an instrument. Before using thi...
Denis Then I have tried this but nor does it run : //coloring histogram if pctRankT>=pctile...
Denis Here we are ! //coloring histogram if pctRankT>=pctile/100 then r=255 g=0 b=0 els...
Denis Hi Edisone, see my last comment for setting colors
dave
10 years ago
Value Chart High/Low
12
Indicators
tfx This was my first thought, but 1 minute bars don't look like these on my charts. Hmm...
daveAF  It's SP500 before Wall Street open. 
tfx I will be looking into it. Thank you for responding!
hq76
10 years ago
Ahoora Trend
Ahoora Trend
0
Indicators
dave
10 years ago
Wolf Just for information: This calculate code is interesting, but it is not a Triangular Moving...
Dron Hola Lobo, soy nuevo en programación, pero me interesa ese indicador, en tu mensaje estas ha...
supertiti // TMA CENTER Channel by Dave modifié // parameters // HalfLength = 50 // AtrLength = 10...
Nicolas
10 years ago
Nicolas Thanks for commenting. Well, it is not "my" indicator, it is one I have adapted from other t...
hq76 OK I will do it. Are there any possibilities to transform other indicators please?
Nicolas Yes it is possible, as long as it is possible to have the same functionalities. You can post...
r.angel It seems that the formula needs a SQRT (that is Vyangzhang = SQRT(...))
RickTrader I think to have annualized view of this historical volatility you will need : Vyangzhang =...
Nicolas
10 years ago
Miko31 Very good ! Many thanks
Nicolas
10 years ago
Nicolas
10 years ago
Vinks_o_7 great, thanks Nicolas !
Vinks_o_7 argh...still nothing even with 10 000 bars on daily or hourly basis...
Vinks_o_7 ok now : had to refresh the indicator.

Top