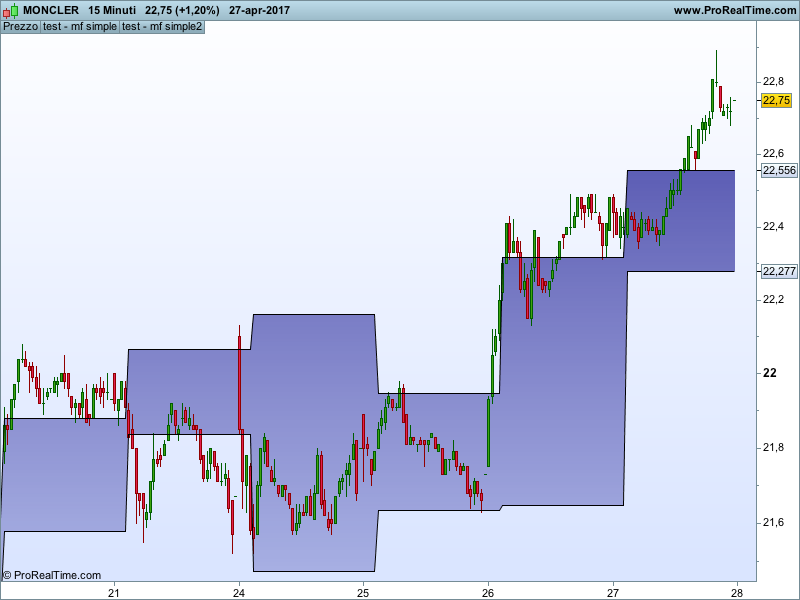
This indicator was needed by Roman.
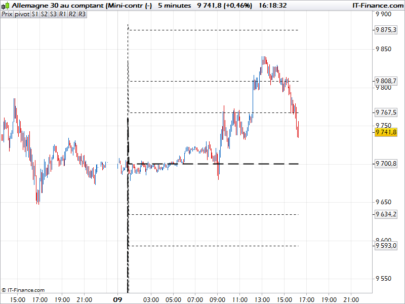
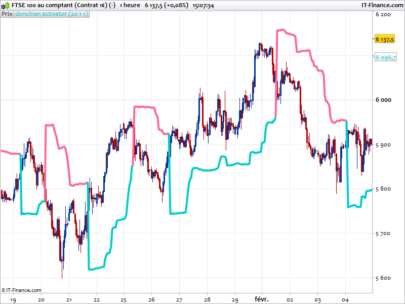
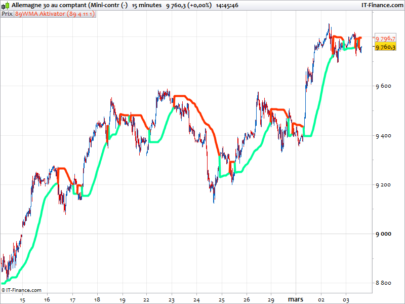
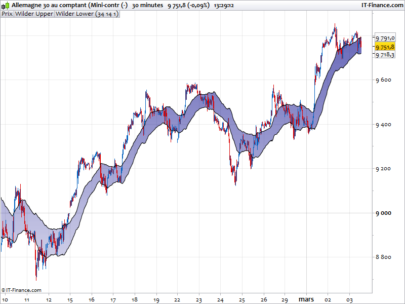
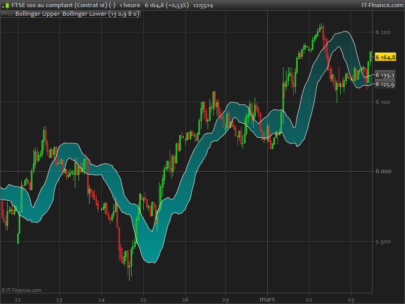
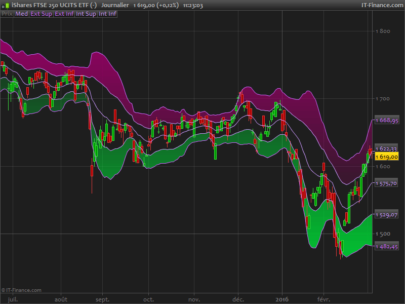
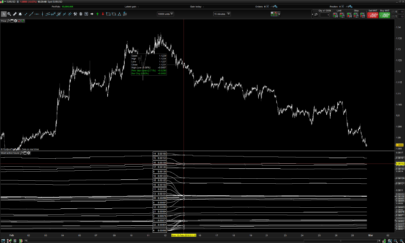
The upper line shows the highest of the first hour plus the average for the past n days of the difference between the first-hour-highest and the daily open.
the lower line shows the lowest of the first hour minus the average for the past n days of the difference between the first-hour-lowest and the daily open.
I hope someone else might use this code.
Blue skies
|
1 2 3 4 5 6 7 8 9 10 11 12 13 14 15 16 17 18 19 20 21 22 23 24 25 26 27 28 29 30 31 32 33 34 35 36 37 38 39 40 41 42 43 44 45 46 |
//computation timeframe in use and intraday number of bars - intrab if intradaybarindex=0 then time1=opentime endif if intradaybarindex=1 then time2=opentime endif deltatime=(time2-time1)/100 intrab=round(522/deltatime) //computation max and min in the first hour - super e infer if (time>=090000) and (time<=100000) then super=dopen(0) infer=dopen(0) if high>super then super=high endif if low<infer then infer=low endif else super=super infer=infer endif //computation average (super-initialopen) and (initialopen-infer) period=20 if time=100000 then sommadeltasuper=0 sommadeltainfer=0 for i=0 to (period) do j=1+round(i*intrab) sommadeltasuper=sommadeltasuper+abs(super[j]-dopen(i)) sommadeltainfer=sommadeltainfer+abs(dopen(i)-infer[j]) next deltasuper=sommadeltasuper/period deltainfer=sommadeltainfer/period endif if time>100000 then up=super+deltasuper down=infer-deltainfer else up=up down=down endif return up,down |
Share this
No information on this site is investment advice or a solicitation to buy or sell any financial instrument. Past performance is not indicative of future results. Trading may expose you to risk of loss greater than your deposits and is only suitable for experienced investors who have sufficient financial means to bear such risk.
ProRealTime ITF files and other attachments :
Find other exclusive trading pro-tools on ![]()
PRC is also on YouTube, subscribe to our channel for exclusive content and tutorials


Hi, I quite like this idea. I just wanted to suggest some code alterations:
// --------------------------------
// once period = 20
// once gmtOffset = 000000 // 010000 for EU just an idea
once startTime = 080000 //+gmtOffset ??
// --------------------------------
once endTime = startTime+010000
// to avoid nasty spike on the graph
once up = undefined
once down = undefined
once super = undefined
once infer = undefined
//computation timeframe in use and intraday number of bars - intrab
if intradayBarIndex = 0 then
time1=opentime
elsif intradayBarIndex = 1 then
time2=opentime
// only needs to be done once a day no?
deltatime=(time2-time1)/100
intrab=round(522/deltatime)
endif
//deltatime=(time2-time1)/100
//intrab=round(522/deltatime)
//computation max and min in the first hour - super e infer
if (time>=startTime) and (time<=endTime) then
super = dopen(0)
infer = dopen(0)
//if high>super then
//super=high
//endif
super = max(high, super)
//if low<infer then
//infer=low
//endif
infer = min(low, infer)
endif
//else
//super = super // ??? why?
//infer = infer // ??? why?
//endif
//computation average (super-initialopen) and (initialopen-infer)
if (time = endTime) then
sommadeltasuper=0
sommadeltainfer=0
for i=0 to (period) do
j=1+round(i*intrab)
sommadeltasuper = sommadeltasuper+abs(super[j]-dopen(i))
sommadeltainfer = sommadeltainfer+abs(dopen(i)-infer[j])
next
deltasuper = sommadeltasuper/period
deltainfer = sommadeltainfer/period
//endif
//if time>endTime then
elsif time>endTime then
up=super+deltasuper
down=infer-deltainfer
else
up=up
down=down
endif
return up,down
Maz,
excellent corrections, thanks a lot
Gabri
Thank you, what is the rational? breakout outside the rectangle?
Regards
Francesco
Roman made the strategy, I made the code and Maze made it bulltproof. You can use it I believe in many ways. A London breakout might be one of them for example.
Francesco78
here is the strategy:
https://www.prorealcode.com/topic/highlowopen-prices-for-specific-timeframes/
Thank you!