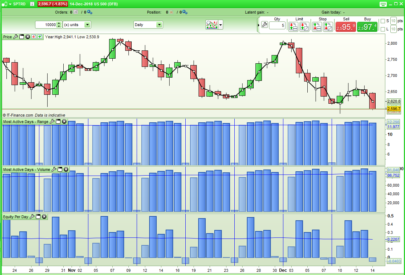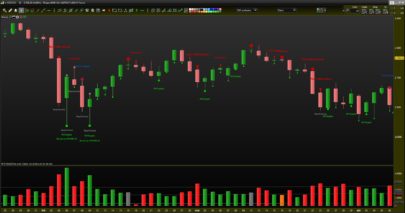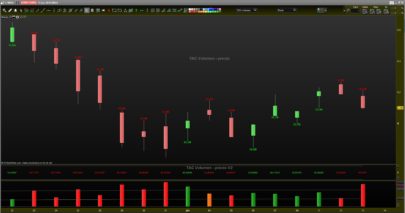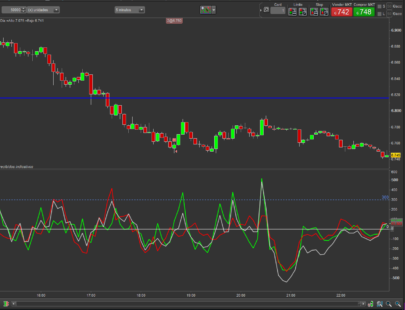
HawkEye volume, developed by Nigel Hawks, is supposed to be a premier VSA indicator.
First, it starts by setting up some rules about how far it should look back in time, which is referred to as ‘Length’, and a ‘Divisor’ that helps decide how sensitive we want our color-changing rules to be.
Next, it calculates averages or ‘moving averages’ – which are kind of like taking the temperature of the market over time – of the market’s range and volume, over the period specified by ‘Length’. This is like our baseline or ‘normal’.
Then, it calculates a ‘midpoint’ of the previous day’s high and low prices and sets an upper and lower boundary (u1 and d1) around this midpoint based on our ‘Divisor’. This is like establishing our zone of comfort around the middle point.
After setting these ground rules, it goes on to create different sets of conditions for when it should color the volume bars. These conditions are a bit like a series of “if-then” statements or a checklist it goes through.
It first looks for a set of conditions (REnabled) that might suggest the market is bearish, or going down (these conditions are a bit like seeing dark clouds on the horizon). If these conditions are met, it gets ready to paint the volume bar red.
Then it checks for a different set of conditions (GEnabled) that might suggest the market is bullish, or going up (these conditions are a bit like seeing a clear, sunny day ahead). If these conditions are met, it gets ready to paint the volume bar green.
Finally, it checks for yet another set of conditions (GREnabled) that suggest the market is neutral, or not clearly moving up or down (these conditions are a bit like a partly cloudy day). If these conditions are met, it gets ready to paint the volume bar gray.
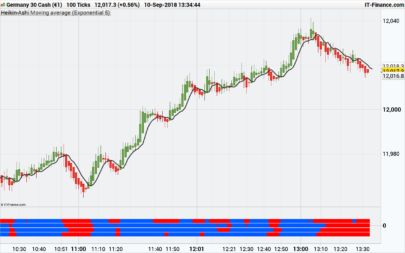
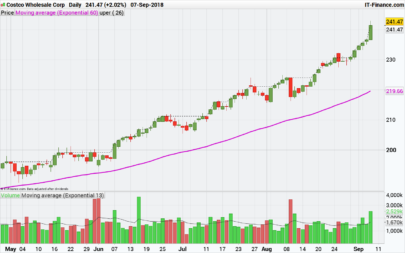
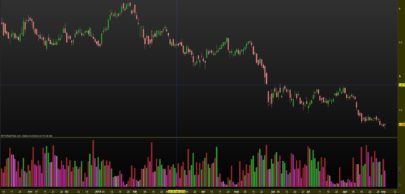
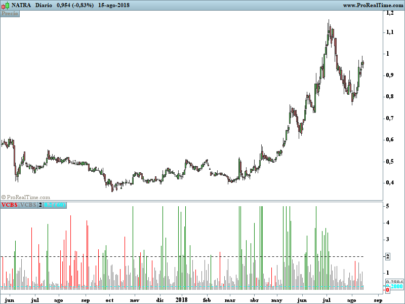
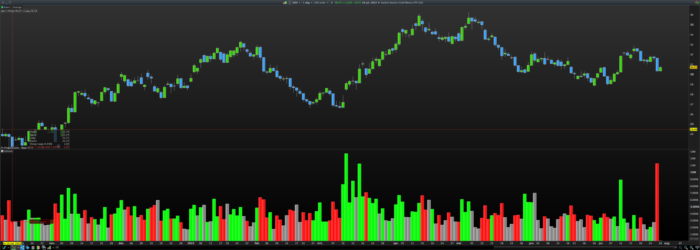
Finally, it applies the color to the volume bars based on the met conditions and gives you the output – a colored histogram-style chart of trading volumes. This can provide a visual representation of the market conditions, helping you to see at a glance what’s happening in the market.
|
1 2 3 4 5 6 7 8 9 10 11 12 13 14 15 16 17 18 19 20 21 22 23 24 25 26 27 28 29 30 31 32 33 34 35 36 |
Length=200 xRange=Range RangeAvg=Average[Length](xRange) VolumeAvg=Average[Length](Volume) Divisor=3.6 High1=High[1] Low1=Low[1] Mid1=(High1+Low1)/2 u1=Mid1+(High1-Low1)/Divisor d1=Mid1-(High1-Low1)/Divisor REnabled1=(xRange>RangeAvg) and (Close<d1) and (Volume>VolumeAvg) REnabled2=Close<Mid1 REnabled=REnabled1 or REnabled2 GEnabled1=Close>Mid1 GEnabled2=(xRange>RangeAvg) and (Close>u1) and (Volume>VolumeAvg) GEnabled3=(High>High1) and (xRange<RangeAvg/1.5) and (Volume<VolumeAvg) GEnabled4=(Low<Low1) and (xRange<RangeAvg/1.5) and (Volume>VolumeAvg) GEnabled=GEnabled1 or GEnabled2 or GEnabled3 or GEnabled4 GREnabled1=(xRange>RangeAvg) and (Close>d1) and (Close<u1) and (Volume>VolumeAvg) and (Volume<VolumeAvg*1.5) and (Volume>Volume[1]) GREnabled2=(xRange<RangeAvg/1.5) and (Volume<VolumeAvg/1.5) GREnabled3=(Close>d1) and (Close<u1) GREnabled=GREnabled1 or GREnabled2 or GREnabled3 If GREnabled then R=128 G=128 B=128 ElsIf GEnabled then R=0 G=255 B=0 ElsIf REnabled then R=255 G=0 B=0 EndIf Return Volume as "Volume" Coloured(R,G,B) Style(Histogram,2) |
Share this
No information on this site is investment advice or a solicitation to buy or sell any financial instrument. Past performance is not indicative of future results. Trading may expose you to risk of loss greater than your deposits and is only suitable for experienced investors who have sufficient financial means to bear such risk.
ProRealTime ITF files and other attachments :
Find other exclusive trading pro-tools on ![]()
PRC is also on YouTube, subscribe to our channel for exclusive content and tutorials