







FVG (Fair Value Gap) indicator
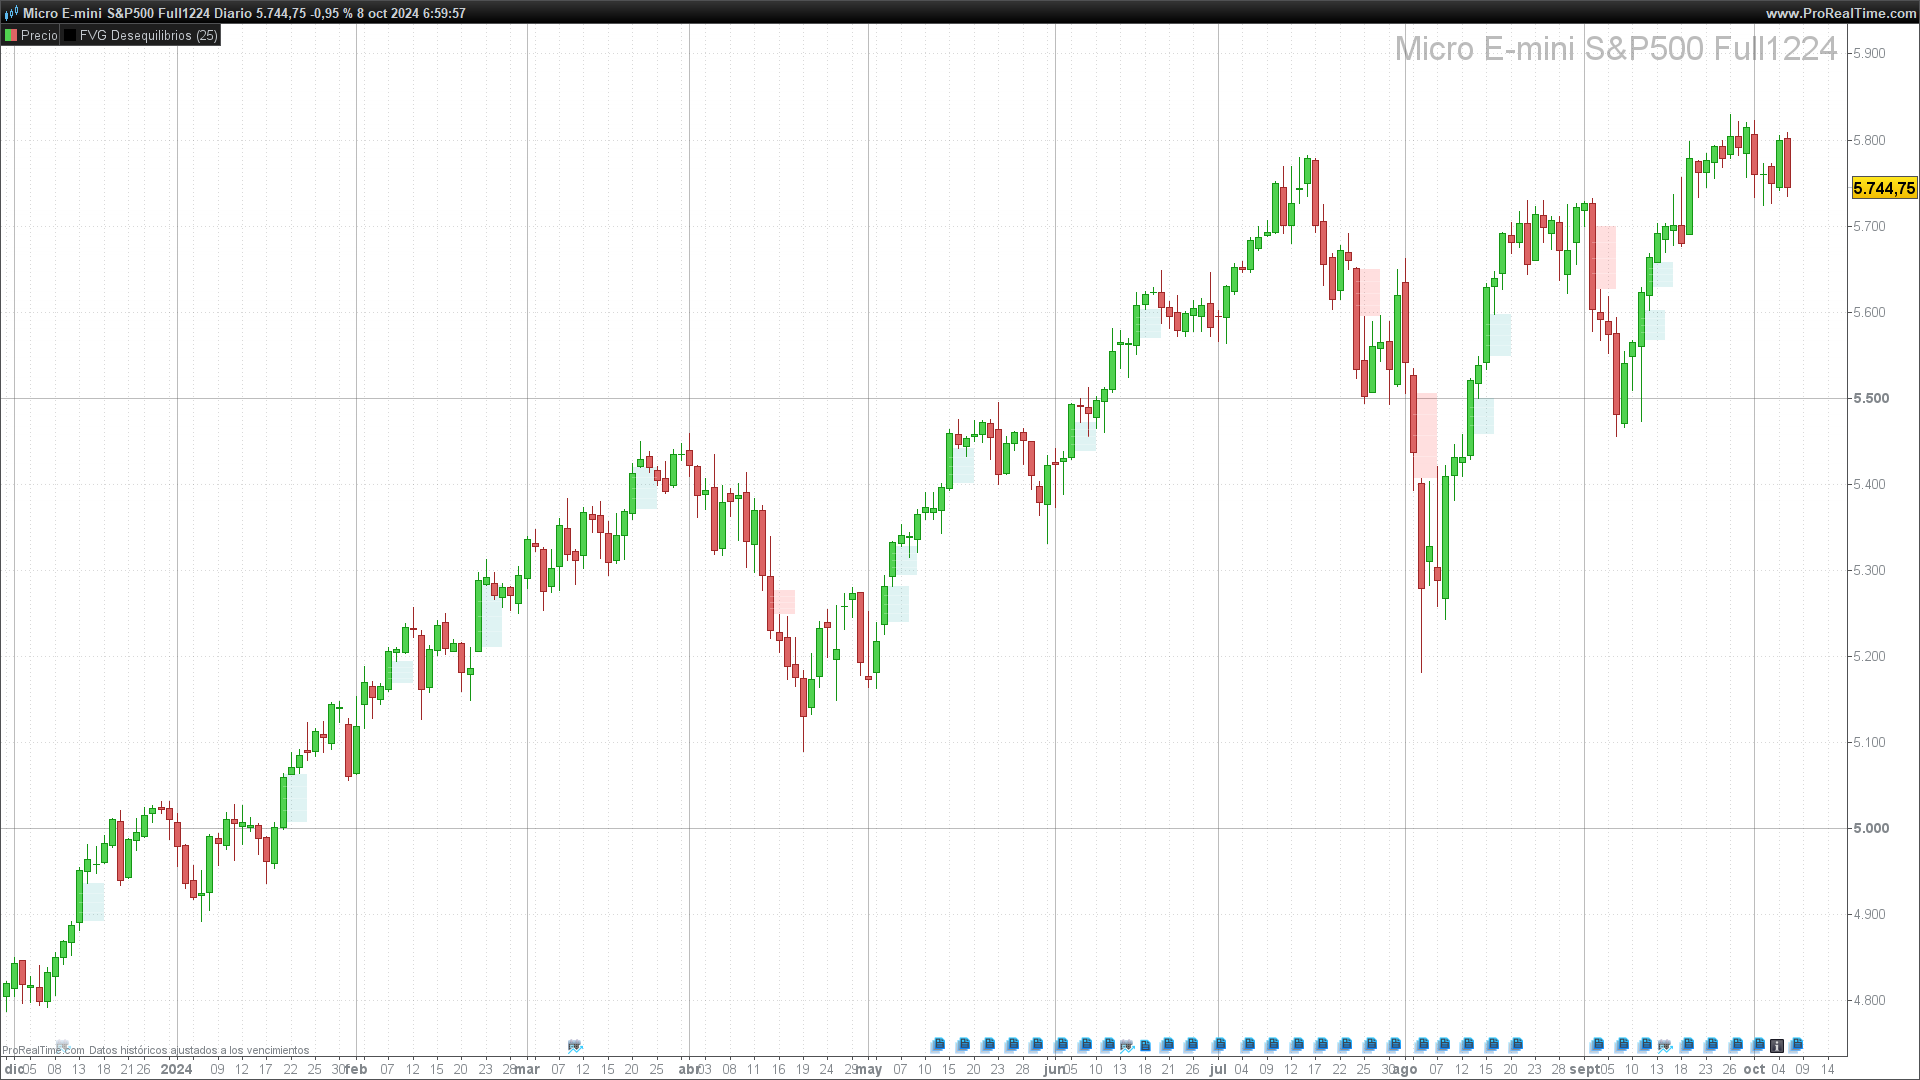
1. Introduction to the FVG Indicator
The FVG (Fair Value Gap) indicator, also known as an imbalance, is a tool used in technical analysis to identify price imbalances in an asset. These imbalances occur when, within a price movement, there are not enough transactions at certain levels, creating a “gap” between fair buy and sell prices. These zones are referred to as “fair value gaps.”
An FVG forms when the range of one candle is not fully covered by the previous or subsequent candles, leaving a gap in the price. These areas can represent important levels of support or resistance, where the price might return to “fill” the gap before continuing its movement.
In practical terms, traders use FVGs to detect potential reversal or continuation zones. These imbalance areas suggest that the market hasn’t fully corrected pending orders at those levels, which can result in significant price moves when the market tries to balance itself.
2. How to Use the FVG Indicator
The FVG indicator is highly useful for identifying zones where the price may reverse or continue its trend due to the presence of imbalances. These imbalances are interpreted as areas of “institutional interest,” where large orders may have been left partially unfilled, potentially causing the price to return to these levels.
Bullish FVG:
A bullish FVG forms when the price moves upward, and the range of the second previous candle (close[2] > open[2]) does not fully cover the range between the right and left candles. This indicates a liquidity gap within this price range. Traders look for buying opportunities when the price returns to this area, expecting the imbalance to “close” and the market to resume its bullish trend.
Bearish FVG:
A bearish FVG occurs when the price drops and the range of the second previous candle doesn’t fully cover the range between the other two candles (typically, open[2] > close[2] in a bearish setup). This suggests the market might return to that zone to fill the imbalance before continuing its bearish trend. Traders often look for selling opportunities when the price retests these areas.
Practical Applications:
- Hidden support and resistance zones: FVG zones can act as hidden support or resistance levels, as they represent areas where the market hasn’t fully balanced supply and demand.
- Retracement opportunities: A common strategy is to wait for the price to return to the FVG zone to seek a favorable entry, whether long or short, depending on the direction of the imbalance.
- Trend confirmation: An FVG can be used to confirm the trend direction. If the price doesn’t return to the FVG after forming, the trend is likely to continue. However, if the price fills the gap, it might indicate a reversal or temporary consolidation.
The use of FVG is flexible and can be adapted to different trading styles, whether scalping, day trading, or swing trading. Traders often complement this indicator with others, such as RSI or moving averages, to increase the accuracy of their signals.
3. Parameters and Configuration
The FVG (Fair Value Gap) indicator offers flexibility in its configuration, making it adaptable to various trading styles and markets. Below are the most relevant parameters that can be adjusted and how they affect the indicator’s behavior:
1. Range
The range refers to the minimum difference between the high and low of the candles required for the indicator to detect a fair value gap. In the standard code, this parameter is set to 5. This range can be adjusted according to the trader’s preferences and the characteristics of the market being traded.
- Suggested adjustment:
- For more volatile markets, such as cryptocurrencies, you could increase the range to avoid generating false signals from small and noisy movements.
- For less volatile markets, such as certain currency pairs, you might reduce the range to capture more opportunities.
2. Candle Conditions (Bullish or Bearish)
The indicator defines whether the gap is bullish or bearish based on the relationship between the close and open of the second previous candle. If the close[2] is greater than the open[2], the gap is considered bullish; otherwise, it is bearish. This allows the indicator to distinguish between imbalances in bullish or bearish trends.
- Suggested adjustment:
- While this parameter is not usually modified, as it’s central to the FVG calculation, a trader can customize how a bullish or bearish candle is defined by using other criteria, such as moving average comparisons.
3. Visual Representation
The FVG is visualized on the chart with rectangles and segments. The rectangles mark the gap area between the high and low of the corresponding candles, while horizontal segments divide this zone into proportional levels (halves and quarters), helping to identify intermediate interest levels.
- Colors: The indicator uses different colors to distinguish between bullish and bearish gaps. Bullish gaps are typically shown in shades of green/blue, and bearish gaps in red.
- Transparency: You can adjust the transparency of the rectangles to avoid interference with other chart elements.
- Suggested adjustment:
- For a cleaner chart, you can disable the segments or use more subtle colors.
- Customizing the colors to match your usual chart scheme can improve visual clarity.
4. Timeframe
The behavior of the FVG varies depending on the timeframe used. Imbalances detected on higher timeframes (daily, weekly) tend to have greater significance and can act as key zones for swing trading. On lower timeframes (minute, hourly), the gaps can be useful for intraday traders looking to capitalize on quick corrective moves.
- Suggested adjustment:
- Experiment with different timeframes depending on your trading style. For short-term traders, 1- or 5-minute charts can be useful for spotting fast-moving imbalances. For longer-term traders, daily or weekly charts can highlight critical areas.
The versatility of the FVG indicator allows traders to adjust it based on their needs, depending on the market and timeframe they are trading. Modifying these parameters helps optimize signals and prevents them from being based on insignificant or overly noisy movements.
4. Conclusion
The FVG (Fair Value Gap) indicator is a powerful tool for traders looking to identify market imbalances. These imbalances, represented by fair value gaps, highlight areas where the price might return to fill the gap before continuing its trend. FVGs can act as hidden levels of support or resistance, providing key points for entering or exiting a trade.
The indicator’s flexibility allows it to be adjusted to different trading styles and markets, from intraday strategies to swing trading. By combining the FVG with other indicators, such as moving averages or RSI, traders can enhance the accuracy of their signals and improve their chances of success.
In summary, the FVG provides a clear view of imbalance areas in the market, which can help identify trading opportunities in both bullish and bearish trends. However, like any tool, it’s important to use the indicator in conjunction with other forms of analysis and proper risk management.
// Author: toniyecla
// FVG (Fair Value Gap / Imbalances)
rango = 5
alcista = close[2] > open[2]

if (alcista) then
maximo = low[1]
minimo = high[3]

if (maximo-minimo > rango) then
drawrectangle(barindex[2], maximo, barindex + 1, minimo) coloured (0,157,157,32) bordercolor (0,153,153,0)
drawsegment(barindex[2], maximo - (maximo - minimo) / 2, barindex + 1, maximo - (maximo - minimo) / 2) coloured (255,255,255,64)
drawsegment(barindex[2], maximo - (maximo - minimo) / 4, barindex + 1, maximo - (maximo - minimo) / 4) coloured (255,255,255,64)
drawsegment(barindex[2], minimo + (maximo - minimo) / 4, barindex + 1, minimo + (maximo - minimo) / 4) coloured (255,255,255,64)
endif
else
maximo = low[3]
minimo = high[1]

if (maximo-minimo > rango) then
drawrectangle(barindex[2], maximo, barindex + 1, minimo) coloured (255,0,0,32) bordercolor (255,102,102,0)
drawsegment(barindex[2], maximo - (maximo - minimo) / 2, barindex + 1, maximo - (maximo - minimo) / 2) coloured (255,255,255,64)
drawsegment(barindex[2], maximo - (maximo - minimo) / 4, barindex + 1, maximo - (maximo - minimo) / 4) coloured (255,255,255,64)
drawsegment(barindex[2], minimo + (maximo - minimo) / 4, barindex + 1, minimo + (maximo - minimo) / 4) coloured (255,255,255,64)
endif
endif

return
Comments
You must be logged in to post a comment.

Bonjour,
J'ai bien copié le code des FVG mais comment le mettre sur ma plateforme de trading ProRealtime ?
Quand je le copie il va directement dans les indicateurs avec une page blanche, alors que je voudrais les FVG sur les graphiques.
Pouvez vous m'indiquer comment mettre les FVG sur mon graphique ?
merci
Bien à vous
Franck


¡interesante acercamiento! (no lo conocía, simplemente tuve la necesidad y lo programé) personalmente prefiero conocer el rango real del FVG, y si este ha sido completamente mitigado o no, veo que Nicolas también tiene una interesante version aqui: https://www.prorealcode.com/prorealtime-indicators/imbalances-indicator/ pero de igual modo no deseo impactar tanto visualmente en la gráfica me gustan ambos trabajos, gracias!

Hello, take a look at this formulation made by "Blade106", Topic link attached post #227334. He did a great job, because his algorithm is dynamic. By that I mean, when the FVGs are filled they disappear from the display! I can't understand how he does it, but it's great ;) - https://www.prorealcode.com/topic/imbalance-code/#post-227352 DEFPARAM DrawOnLastBarOnly = true DEBUG = 0 // Start of code, don't change anything below IF IsLastBarUpdate THEN $RangeHigh[0] = 0 $RangeLow[0] = 0 $RangeIndex[0] = 0 RangeIdx = 0 BI = 0 B = 0 RI = 0 TotalBars = BarIndex[0] IF DEBUG = 1 THEN DRAWTEXT("Total bars: #TotalBars#", BarIndex[0], High[0]) ENDIF // List all imbalance FOR RI = 1 TO TotalBars - 2 DO BI = BarIndex[RI] //drawtext("#BI#", BI, High[RI]) IF High[BI - 1] < Low[BI + 1] THEN RangeIdx = RangeIdx + 1 $RangeHigh[RangeIdx] = Low[BI + 1] $RangeLow[RangeIdx] = High[BI - 1] $RangeIndex[RangeIdx] = RI ENDIF IF High[BI + 1] < Low[BI - 1] THEN RangeIdx = RangeIdx + 1 $RangeHigh[RangeIdx] = Low[BI - 1] $RangeLow[RangeIdx] = High[BI + 1] $RangeIndex[RangeIdx] = RI ENDIF NEXT IF DEBUG = 1 THEN DRAWTEXT("Imbalance found: #RangeIdx#", BarIndex[0], Low[0]) ENDIF // Remove mitigated imbalance FOR RI = 1 TO RangeIdx DO IF DEBUG = 1 THEN DRAWRECTANGLE($RangeIndex[RI] - 1, $RangeHigh[RI], $RangeIndex[RI] + 1, $RangeLow[RI]) COLOURED(0,0,200) ENDIF Valid = 1 FOR B = $RangeIndex[RI] + 2 TO TotalBars DO LB = Low[BarIndex[B]] HB = High[BarIndex[B]] // Candle is above or below our zone, ignore it IF LB >= $RangeHigh[RI] OR HB <= $RangeLow[RI] THEN IF DEBUG = 1 THEN DRAWTEXT("Out", B, High[BarIndex[B]]) ENDIF CONTINUE ENDIF IF LB <= $RangeLow[RI] THEN // Candle engulfs our zone, so imbalance is mitigated IF HB >= $RangeHigh[RI] THEN IF DEBUG = 1 THEN DRAWTEXT("Mitigated", B, High[BarIndex[B]]) ENDIF Valid = 0 BREAK ENDIF IF DEBUG = 1 THEN DRAWTEXT("High", B, High[BarIndex[B]]) ENDIF $RangeLow[RI] = HB ELSE // In this case, Low is within the zone IF DEBUG = 1 THEN DRAWTEXT("Low", B, High[BarIndex[B]]) ENDIF $RangeHigh[RI] = LB ENDIF NEXT IF Valid = 1 THEN DRAWRECTANGLE($RangeIndex[RI], $RangeHigh[RI], TotalBars+2000, $RangeLow[RI]) COLOURED(0,0,0,0) FILLCOLOR(0,0,0,30) ENDIF NEXT ENDIF RETURN
Hola buenas tardes, he probado el FVG Indicator y no me dibuja los FVG en temporalidad diaria o inferior. ¿A qué puede deberse? Gracias de antemano