







Inversion FVG: An Indicator for Fair Value Gaps Reversals

Introduction:
The Inversion FVG indicator is designed to detect Fair Value Gaps (FVGs) and highlight their subsequent reversals. Fair Value Gaps occur when there is an imbalance between buyers and sellers, creating a price range that has not been efficiently filled by the market. This indicator marks FVGs on the chart and tracks whether price retraces back into the gap, signaling potential reversal zones.
This tool is especially useful for traders who rely on price imbalances to identify significant levels of support and resistance where price corrections or trend continuations may occur.
How the Indicator Works:
1. FVG Detection:
The indicator identifies FVGs based on specific conditions:
- Bullish FVG: Formed when the low of the current bar is above the high from two bars ago, indicating an upward price imbalance.
- Bearish FVG: Formed when the high of the current bar is below the low from two bars ago, indicating a downward price imbalance.
For the FVG to be valid, the gap’s size must exceed a calculated threshold that adapts to market volatility.
2. Tracking the Fair Value Gap Reversal:
Once an FVG is detected, the indicator tracks price movements to see if the FVG is “filled” by a price retracement:
- Bullish reversal: The price closes below the lower bound of the bullish FVG, indicating the gap has been invalidated.
- Bearish reversal: The price closes above the upper bound of the bearish FVG, signaling that the gap has been filled.
3. Drawing Visual Elements:
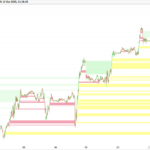
- Active FVG Zones:
- Green rectangles for bullish FVGs.
- Red rectangles for bearish FVGs.
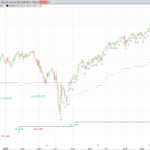
- Reversal Lines: When an FVG is filled, the indicator draws a dotted line in blue to show the retracement path.
- Midline of the FVG: A gray dotted line is drawn at the midpoint of the FVG, serving as an additional reference.
Interpretation on the Chart:
- Bullish FVG:
Appears as a green rectangle when detected and turns red if a reversal occurs. - Bearish FVG:
Appears as a red rectangle and changes to green when price retraces and fills the gap. - Midpoint Line:
The midpoint of the FVG is displayed as a horizontal gray dotted line, highlighting the center of the imbalance range.
Indicator Configuration:
Customizable Parameters:
dispNum: Number of detected FVGs displayed on the chart (default: 7).atrMult: Multiplier for calculating the volatility-adjusted FVG size threshold (default: 0.25).showbrokenFvg: Option to display filled (invalidated) FVGs on the chart (default: 0).
Adjustments:
- Increasing
dispNumallows for more FVGs to be displayed, which is useful for detailed historical analysis. - Setting
showbrokenFvgto 1 enables the visualization of past FVGs that have been invalidated by price action.
Conclusion:
The Inversion FVG indicator is a powerful tool for identifying and visualizing price imbalances and their potential reversals. By marking areas where the market may correct inefficiencies, it provides traders with key zones for entry, exit, or stop adjustments.
It is recommended to experiment with the atrMult and dispNum parameters to adapt the indicator to different timeframes and trading strategies for optimal results.
//-----------------------------------------------//
//PRC_Inverted FVG
//version = 0
//09.01.2025
//Iván González @ www.prorealcode.com
//Sharing ProRealTime knowledge
//-----------------------------------------------//
// inputs
//-----------------------------------------------//
defparam drawonlastbaronly=true
dispNum=7
atrMult=0.25
showbrokenFvg=0
//-----------------------------------------------//
// Atr calculation
//-----------------------------------------------//
if barindex<=200 and barindex>1 then
atr=averagetruerange[barindex](close)*atrMult
else
atr=averagetruerange[200](close)*atrMult
endif
//-----------------------------------------------//
// FVG Detection
//-----------------------------------------------//
fvgUp=low>high[2] and close[1]>high[2]
fvgDown=high<low[2] and close[1]<low[2]
ctop=max(close,open)
cbot=min(close,open)

if fvgUp and abs(low-high[2])>atr then
$fvgLeft[n+1]=barindex[1]
$fvgTop[n+1]=low
$fvgRight[n+1]=barindex
$fvgBot[n+1]=high[2]
$fvgMid[n+1]=(low+high[2])/2
$fvgDir[n+1]=1
$State[n+1]=0
n=n+1
endif

if fvgDown and abs(low[2]-high)>atr then
$fvgLeft[n+1]=barindex[1]
$fvgTop[n+1]=low[2]
$fvgRight[n+1]=barindex
$fvgBot[n+1]=high
$fvgMid[n+1]=(low[2]+high)/2
$fvgDir[n+1]=-1
$State[n+1]=0
n=n+1
endif

if islastbarupdate then
t1=0
FOR i = n DOWNTO 0 DO
t1=$fvgLeft[i]+1
if t1<barindex then
for j=barindex-t1 downto 0 do
IF $fvgDir[i] = 1 AND cbot[j] < $fvgBot[i] THEN
$invLeft[i] = $fvgLeft[i]
$invTop[i] = $fvgTop[i]
$invRight[i] = barindex[j]
$invBot[i] = $fvgBot[i]
$State[i] = 1
break
ENDIF
IF $fvgDir[i] = -1 AND ctop[j] > $fvgTop[i] THEN
$invLeft[i] = $fvgLeft[i]
$invTop[i] = $fvgTop[i]
$invRight[i] = barindex[j]
$invBot[i] = $fvgBot[i]
$State[i] = 1
break
ENDIF
next
endif
NEXT
count2=0
t2=0
for i=n downto 0 do
t2=$invRight[i]+1
if t2<barindex then
for j=barindex-t2 downto 0 do
if $fvgDir[i] = 1 and $State[i] = 1 and close[j] > $invTop[i] THEN
if count2<dispNum and showbrokenFvg then
drawrectangle($invLeft[i],$invTop[i],$invRight[i],$invBot[i])coloured("green",0)fillcolor("green",10)
drawsegment($invRight[i],$invTop[i],barindex[j],$invTop[i])coloured("blue",100)style(dottedline)
endif
count2=count2+1
$State[i] = -1
break
endif
if $fvgDir[i] = -1 and $State[i] = 1 and close[j] < $invBot[i] THEN
if count2<dispNum and showbrokenFvg then
drawrectangle($invLeft[i],$invTop[i],$invRight[i],$invBot[i])coloured("red",0)fillcolor("red",10)
drawsegment($invRight[i],$invTop[i],barindex[j],$invTop[i])coloured("blue",100)style(dottedline)
endif
count2=count2+1
$State[i] = -1
break
endif
next
endif
next

count=0
for i=n downto 0 do
if $State[i] = 1 and count < dispNum then
count=count+1
if $fvgDir[i]=1 then
drawrectangle($invLeft[i],$invTop[i],$invRight[i],$invBot[i])coloured("green",0)fillcolor("green",50)
drawrectangle($invRight[i],$invTop[i],barindex+10,$invBot[i])coloured("red",0)fillcolor("red",50)
drawsegment($invLeft[i],($invBot[i]+$invTop[i])/2,barindex+10,($invBot[i]+$invTop[i])/2)coloured("grey",75)style(dottedline3)

elsif $fvgDir[i]=-1 then
drawrectangle($invLeft[i],$invTop[i],$invRight[i],$invBot[i])coloured("red",0)fillcolor("red",50)
drawrectangle($invRight[i],$invTop[i],barindex+10,$invBot[i])coloured("green",0)fillcolor("green",50)
drawsegment($invLeft[i],($invBot[i]+$invTop[i])/2,barindex+10,($invBot[i]+$invTop[i])/2)coloured("grey",75)style(dottedline3)
endif
endif
next

endif

//-----------------------------------------------//
return
Comments
You must be logged in to post a comment.


Bonjour Ivan, comment pourrais tu modifier ce code pour qu'un histogramme indiquant la création d'une inversion de FVG détectée puisse donner une valeur +1 ou -1 (+1 si un FVG initialement rouge devient vert, et -1 si un FVG initialement vert devient rouge). Cela afin dans un second temps créer des alertes et screeners ...

Scusa e cosa devo cambiare? Grazie
Nella descrizione, al punto "interpretazioni sulla carta" è scritto che quando c'è un rettangolo verde quando viene rilevato che diventa rosso in seguito, il segnale è rialzista e viceversa per quello ribassista. Vedendo i grafici a me sembra il contrario , inoltre non vedo la linea grigia tratteggiata se non una veramente sottile e sfocata.
Hallo Ivan, ist es möglich den Indikator so zu veränden, dass nur offene/unmitigierte FVG´s angezeigt werden? Danke Holger