Fair Value Gaps: chart and higher-timeframe FVGs
Introduction
A Fair Value Gap (FVG) is the price area left uncovered when one candle moves so fast that the candle before it and the candle after it do not overlap. Many traders watch these imbalances because price tends to come back to them, either to fill them or to react from them.
Fair Value Gaps by DGT detects these zones on the chart timeframe or on a higher timeframe of your choice, keeps them extended to the right until price fills them, and shows how much of each zone has already been filled. Two independent instances let you watch, for example, the chart gaps and the one-hour gaps at the same time. As an option, a filled gap that price closes through becomes an Inverse FVG (IFVG): the old support turns into resistance and vice versa.
Theory Behind the Indicator
Detection
The indicator works with the last three finished candles of the selected timeframe, from the oldest (C1) to the newest (C3):
- Bullish FVG: the low of C3 is above the high of C1 and C2 closes above the high of C1. The zone goes from the high of C1 (bottom) to the low of C3 (top).
- Bearish FVG: the high of C3 is below the low of C1 and C2 closes below the low of C1. The zone goes from the high of C3 (bottom) to the low of C1 (top).
- A gap between two consecutive candles (C3 with C2, or C2 with C1) cancels the pattern, so only clean three-candle imbalances are drawn.
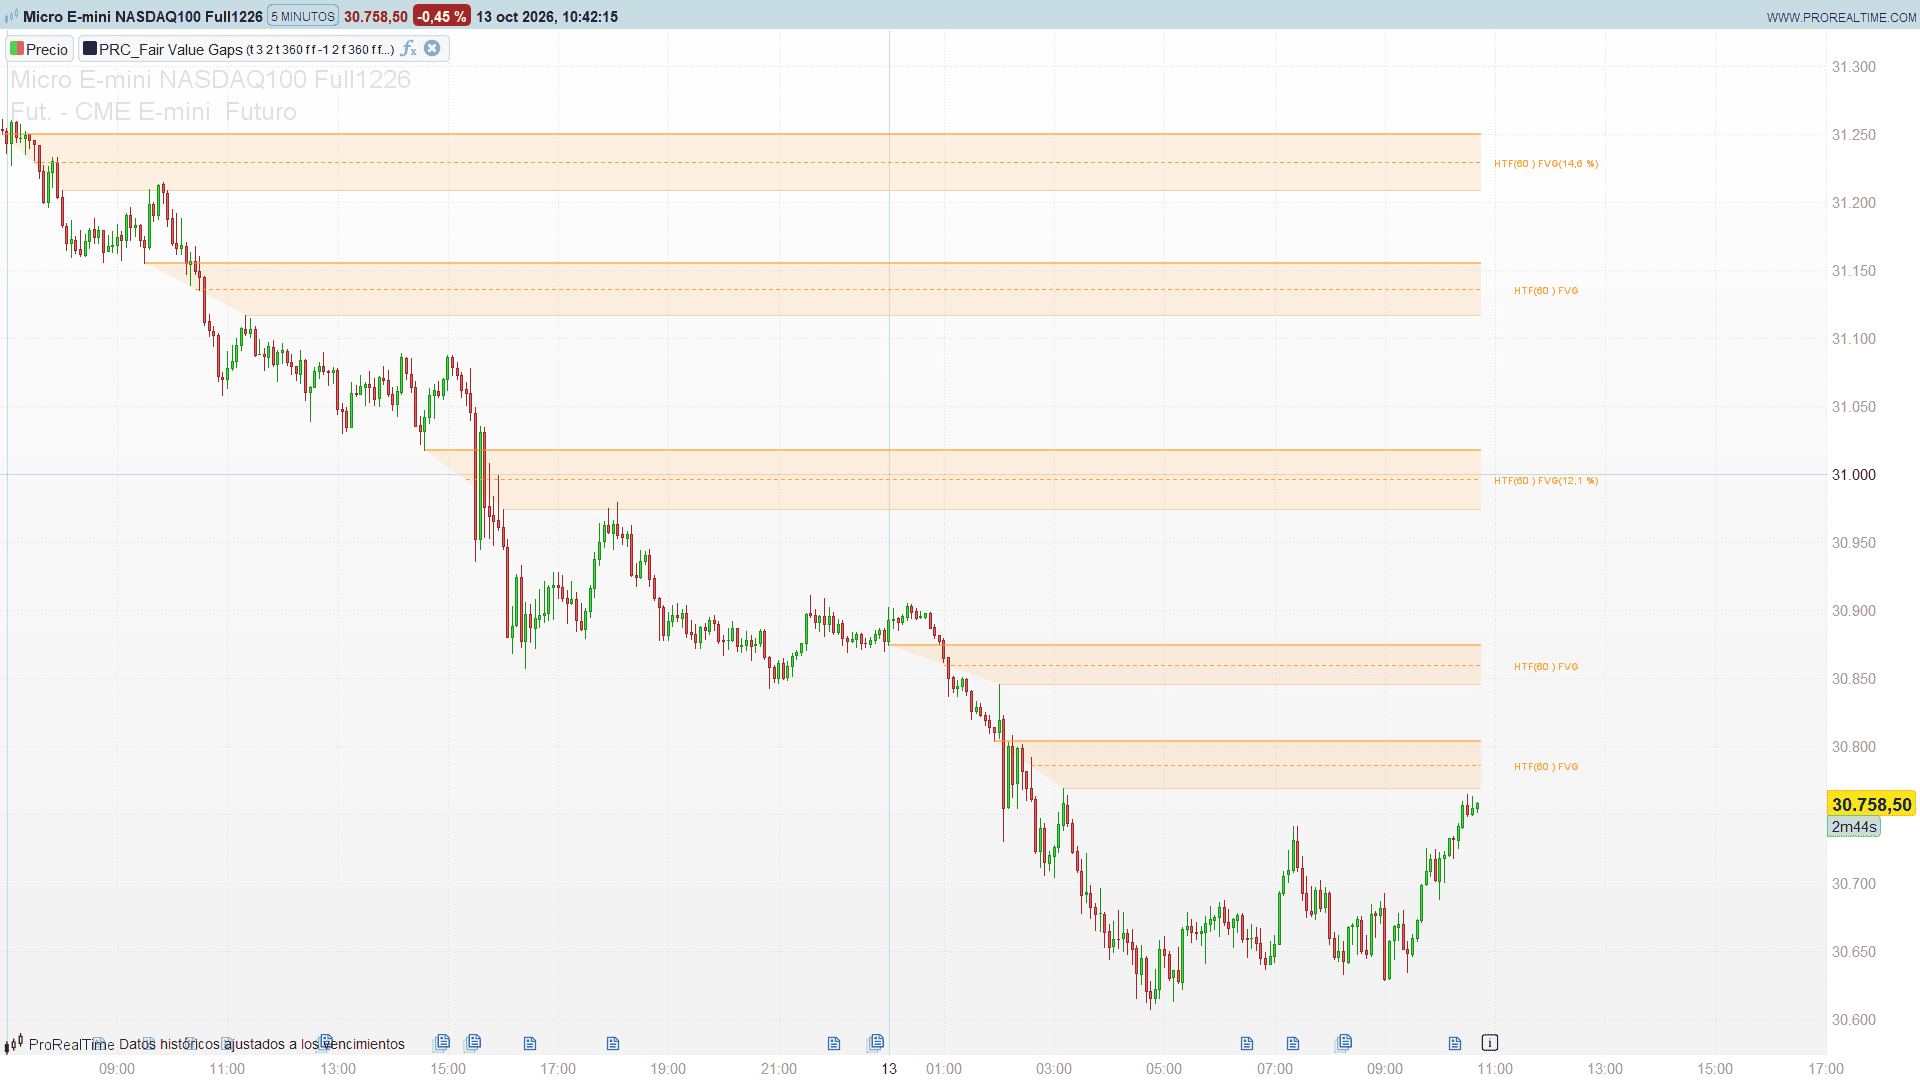
Each zone is drawn with its two edges, starting at the candle that printed each extreme, a dotted midline and a light fill. The label shows the source (Chart or HTF and the timeframe) and the deepest fill reached so far, as a percentage of the zone.
Fill methods
You choose when a zone counts as filled and disappears:
- Any Touch: price touches the near edge of the zone.
- Midpoint Reached: price reaches the middle of the zone.
- Wick Sweep (default): a wick reaches the far edge of the zone.
- Body Beyond: a candle closes beyond the far edge.
Inverse FVGs
When the inverse option is on, every filled zone stays on watch. If a later candle closes back beyond the near edge, the zone held and is dropped. If a candle closes beyond the far edge, the zone is inverted: a bullish FVG becomes a bearish IFVG (expected resistance) and a bearish FVG becomes a bullish IFVG (expected support). The IFVG keeps the original edges: up to the inversion candle it is drawn in the colour of the original FVG, and from there on with dashed lines in the colour of its new direction. It is removed when price closes back through its far edge. Up to 25 IFVGs are kept per instance.
Higher timeframes
The higher-timeframe candles are rebuilt from the chart candles, so FVG #1 and FVG #2 can use 5 minutes, 15 minutes, 1 hour, 4 hours, 1 day, 1 week or 1 month on any lower chart. FVG #2 also has an Auto mode that picks the first of those timeframes at least four times the chart timeframe. A timeframe equal to or lower than the chart falls back to the chart itself.
Key Features at a Glance
- Classic three-candle FVGs with a filter against gaps between consecutive candles.
- Chart or higher-timeframe detection, with an automatic option.
- Two independent instances with their own timeframe, fill method, colours, labels and range.
- Four fill methods and a live fill percentage in each label.
- Optional inverse FVGs with the full history of each zone drawn on the chart.
- Calculation limited to the most recent bars (360 by default) to keep the chart clean.
How to Read the Indicator
- Open zones are imbalances that price has not repaired yet. They act as magnets and as areas where price often reacts on the first visit.
- The fill percentage tells you how deep price has already gone into a zone. A zone that has been 80% filled has little left to offer; an untouched one is still fully open.
- Higher-timeframe zones carry more weight than chart zones. A chart FVG inside a one-hour FVG of the same direction is a stronger area.
- Inverse FVGs mark the moment a zone failed. The dashed part shows where the old support or resistance is now expected to work the other way.
Indicator Configuration
Timeframe codes: -1 Auto (FVG #2 only), 0 Chart, 1 5 minutes, 2 15 minutes, 3 1 hour, 4 4 hours, 5 1 day, 6 1 week, 7 1 month. Fill method codes: 0 Any Touch, 1 Midpoint Reached, 2 Wick Sweep, 3 Body Beyond.
Fair Value Gaps #1:
- showFvg1 (default: 1): draws the zones of instance #1.
- tfSel1 (default: 0): timeframe of instance #1.
- fillMode1 (default: 2): fill method of instance #1.
- bullR1, bullG1, bullB1 / bearR1, bearG1, bearB1: colours of bullish and bearish zones.
- showLabels1 (default: 1): 1 shows the labels with the fill percentage.
- maxBars1 (default: 360): number of recent bars analysed.
- showIfvg1 (default: 0): 1 adds the inverse FVGs. They work even with showFvg1 = 0 (inverse zones only).
Fair Value Gaps #2: the same settings ending in 2. By default it is off, uses the Auto timeframe and hides its labels.
General:
- sundaySession (default: 0): 0 joins a Sunday evening session to Monday for the daily and weekly candles (futures, forex); 1 treats Sunday as a day of its own.
- lblShift (default: 8): distance in bars from the last candle to the centre of the labels.
- maxIfvg (default: 25): maximum number of active inverse FVGs per instance.
The label text size is set in the DRAWTEXT lines (last argument, 10 by default).
Code
//---------------------------------------------------------------
// PRC_Fair Value Gaps DGT
// version = 0
// 13.10.2026
// Iván González @ www.prorealcode.com
// Author: dgtrd
// Sharing ProRealTime knowledge
//--------------------------------------------------------------------//
defparam drawonlastbaronly = true
//--------------------------------------------------------------------//
// SETTINGS
//--------------------------------------------------------------------//
// Timeframe codes: -1 = Auto (FVG #2 only), 0 = Chart, 1 = 5 minutes,
// 2 = 15 minutes, 3 = 1 hour, 4 = 4 hours, 5 = 1 day, 6 = 1 week, 7 = 1 month
// A timeframe lower than or equal to the chart one falls back to the chart.
// Fill method codes: 0 = Any Touch, 1 = Midpoint Reached, 2 = Wick Sweep, 3 = Body Beyond
// --- Fair Value Gaps #1
showFvg1 = 1
tfSel1 = 0
fillMode1 = 2
bullR1 = 0
bullG1 = 184
bullB1 = 217
bearR1 = 255
bearG1 = 139
bearB1 = 0
showLabels1 = 1
maxBars1 = 360
showIfvg1 = 0
// --- Fair Value Gaps #2
showFvg2 = 0
tfSel2 = -1
fillMode2 = 2
bullR2 = 110
bullG2 = 231
bullB2 = 183
bearR2 = 255
bearG2 = 107
bearB2 = 107
showLabels2 = 0
maxBars2 = 360
showIfvg2 = 0
// --- General
// 0 = a Sunday evening session belongs to Monday (futures, forex), 1 = Sunday is a day of its own
sundaySession = 0
// distance in bars from the last bar to the centre of the labels
lblShift = 8
// maximum number of active inverse FVGs per instance
maxIfvg = 25
//--------------------------------------------------------------------//
// SETTINGS STORED BY INSTANCE
//--------------------------------------------------------------------//
$pOn[1] = showFvg1
$pTf[1] = tfSel1
$pFill[1] = fillMode1
$pBuR[1] = bullR1
$pBuG[1] = bullG1
$pBuB[1] = bullB1
$pBeR[1] = bearR1
$pBeG[1] = bearG1
$pBeB[1] = bearB1
$pLbl[1] = showLabels1
$pMax[1] = maxBars1
$pIfvg[1] = showIfvg1
$pOn[2] = showFvg2
$pTf[2] = tfSel2
$pFill[2] = fillMode2
$pBuR[2] = bullR2
$pBuG[2] = bullG2
$pBuB[2] = bullB2
$pBeR[2] = bearR2
$pBeG[2] = bearG2
$pBeB[2] = bearB2
$pLbl[2] = showLabels2
$pMax[2] = maxBars2
$pIfvg[2] = showIfvg2
//--------------------------------------------------------------------//
// CHART TIMEFRAME (GetTimeFrame gives it in seconds)
//--------------------------------------------------------------------//
mNow = floor(opentime / 10000) * 60 + (floor(opentime / 100) MOD 100)
tfSec = GetTimeFrame
chartMin = tfSec / 60
// a monthly chart is one month whatever number of days it is counted as
IF tfSec >= 2419200 AND chartMin < 43200 THEN
chartMin = 43200
ENDIF
//--------------------------------------------------------------------//
// START OF EACH DAY, WEEK AND MONTH
//--------------------------------------------------------------------//
newDayF = 0
newWeekF = 0
newMonthF = 0
IF barindex > 0 THEN
IF date <> date[1] THEN
newDayF = 1
// a Sunday evening session belongs to Monday
IF sundaySession = 0 AND dayofweek[1] = 0 THEN
newDayF = 0
ENDIF
ENDIF
// the week starts with the Sunday session when there is one, otherwise on Monday
IF dayofweek < dayofweek[1] THEN
newWeekF = 1
ENDIF
IF month <> month[1] THEN
newMonthF = 1
ENDIF
ENDIF
//--------------------------------------------------------------------//
// RECONSTRUCTION AND DRAWING (last bar only)
// Both instances are rebuilt from the first bar of their window on every
// update, so nothing depends on how many ticks each bar received.
//--------------------------------------------------------------------//
IF islastbarupdate THEN
FOR k = 1 TO 2 DO
fvgVis = $pOn[k]
ifvgOn = $pIfvg[k]
IF fvgVis = 1 OR ifvgOn = 1 THEN
fillM = $pFill[k]
// ---- timeframe of this instance in minutes (0 = chart)
tfS = $pTf[k]
tfM = 0
IF tfS = -1 THEN
mAuto = chartMin * 4
IF mAuto <= 5 THEN
tfM = 5
ELSIF mAuto <= 15 THEN
tfM = 15
ELSIF mAuto <= 60 THEN
tfM = 60
ELSIF mAuto <= 240 THEN
tfM = 240
ELSIF mAuto <= 1440 THEN
tfM = 1440
ELSIF mAuto <= 10080 THEN
tfM = 10080
ELSIF mAuto <= 43200 THEN
tfM = 43200
ENDIF
ELSIF tfS = 1 THEN
tfM = 5
ELSIF tfS = 2 THEN
tfM = 15
ELSIF tfS = 3 THEN
tfM = 60
ELSIF tfS = 4 THEN
tfM = 240
ELSIF tfS = 5 THEN
tfM = 1440
ELSIF tfS = 6 THEN
tfM = 10080
ELSIF tfS = 7 THEN
tfM = 43200
ENDIF
IF tfM <= chartMin THEN
tfM = 0
ENDIF
// ---- what the labels show: Chart(...) or HTF(...), minutes or D / W / M
IF tfM = 0 THEN
isChartTf = 1
lblTf = chartMin
ELSE
isChartTf = 0
lblTf = tfM
ENDIF
IF lblTf < 1 THEN
// a chart in seconds
lblKind = 4
lblSec = round(lblTf * 60)
ELSIF lblTf < 1440 THEN
lblKind = 0
ELSIF lblTf < 10080 THEN
lblKind = 1
ELSIF lblTf < 43200 THEN
lblKind = 2
ELSE
lblKind = 3
ENDIF
// ---- reset of the state of this instance
nF = 0
nW = 0
nI = 0
nIAlive = 0
nHB = 0
bullCond = 0
bearCond = 0
bullProc = 0
bearProc = 0
jStart = min($pMax[k], barindex - 1)
FOR j = jStart DOWNTO 0 DO
barI = barindex - j
hJ = high[j]
lJ = low[j]
cJ = close[j]
// ---- start of a new higher timeframe candle
isNewP = 0
IF j < jStart THEN
IF tfM = 0 THEN
isNewP = 1
ELSIF tfM = 1440 THEN
isNewP = newDayF[j]
ELSIF tfM = 10080 THEN
isNewP = newWeekF[j]
ELSIF tfM = 43200 THEN
isNewP = newMonthF[j]
ELSE
IF date[j] <> date[j + 1] OR floor(mNow[j] / tfM) <> floor(mNow[j + 1] / tfM) THEN
isNewP = 1
ENDIF
ENDIF
ENDIF
IF j = jStart THEN
curH = hJ
curHi = barI
curL = lJ
curLi = barI
curC = cJ
ELSIF isNewP = 1 THEN
bullProc = 0
bearProc = 0
// the candle that has just finished becomes b0, b0 becomes b1...
b2H = b1H
b2Hi = b1Hi
b2L = b1L
b2Li = b1Li
b2C = b1C
b1H = b0H
b1Hi = b0Hi
b1L = b0L
b1Li = b0Li
b1C = b0C
b0H = curH
b0Hi = curHi
b0L = curL
b0Li = curLi
b0C = curC
nHB = min(nHB + 1, 3)
curH = hJ
curHi = barI
curL = lJ
curLi = barI
curC = cJ
ELSE
IF hJ > curH THEN
curH = hJ
curHi = barI
ENDIF
IF lJ < curL THEN
curL = lJ
curLi = barI
ENDIF
curC = cJ
ENDIF
// ---- gap conditions on the last three finished candles
IF nHB >= 3 THEN
bullCond = 0
IF b0L > b2H AND b1C > b2H AND NOT (b0L > b1H OR b1L > b2H) THEN
bullCond = 1
ENDIF
bearCond = 0
IF b0H < b2L AND b1C < b2L AND NOT (b0H < b1L OR b1H < b2L) THEN
bearCond = 1
ENDIF
ENDIF
// ---- new bullish FVG
IF bullCond = 1 AND bullProc = 0 THEN
bullProc = 1
nF = nF + 1
$fTop[nF] = b0L
$fBtm[nF] = b2H
$fXT[nF] = b0Li
$fXB[nF] = b2Hi
$fXM[nF] = ceil((b0Li + b2Hi) / 2)
IF fillM = 1 THEN
$fMitP[nF] = (b0L + b2H) / 2
ELSIF fillM = 0 THEN
$fMitP[nF] = b0L
ELSE
$fMitP[nF] = b2H
ENDIF
$fMit[nF] = 0
$fSide[nF] = 1
$fAlive[nF] = 1
ENDIF
// ---- new bearish FVG
IF bearCond = 1 AND bearProc = 0 THEN
bearProc = 1
nF = nF + 1
$fTop[nF] = b2L
$fBtm[nF] = b0H
$fXT[nF] = b2Li
$fXB[nF] = b0Hi
$fXM[nF] = ceil((b2Li + b0Hi) / 2)
IF fillM = 1 THEN
$fMitP[nF] = (b2L + b0H) / 2
ELSIF fillM = 0 THEN
$fMitP[nF] = b0H
ELSE
$fMitP[nF] = b2L
ENDIF
$fMit[nF] = 0
$fSide[nF] = -1
$fAlive[nF] = 1
ENDIF
// ---- fill of the active FVGs
FOR f = 1 TO nF DO
IF $fAlive[f] = 1 THEN
IF $fSide[f] = 1 THEN
IF fillM = 3 THEN
pxF = cJ
ELSE
pxF = lJ
ENDIF
IF pxF <= $fMitP[f] THEN
filledF = 1
ELSE
filledF = 0
fRatio = ($fTop[f] - lJ) / ($fTop[f] - $fBtm[f])
ENDIF
ELSE
IF fillM = 3 THEN
pxF = cJ
ELSE
pxF = hJ
ENDIF
IF pxF >= $fMitP[f] THEN
filledF = 1
ELSE
filledF = 0
fRatio = (hJ - $fBtm[f]) / ($fTop[f] - $fBtm[f])
ENDIF
ENDIF
IF filledF = 1 THEN
$fAlive[f] = 0
// a filled FVG becomes a candidate for inversion
IF ifvgOn = 1 THEN
nW = nW + 1
$wTop[nW] = $fTop[f]
$wBtm[nW] = $fBtm[f]
$wXT[nW] = $fXT[f]
$wXB[nW] = $fXB[f]
$wSide[nW] = $fSide[f]
$wAlive[nW] = 1
ENDIF
ELSIF fRatio > $fMit[f] THEN
$fMit[f] = fRatio
ENDIF
ENDIF
NEXT
IF ifvgOn = 1 THEN
// ---- inversion: candle close beyond the far edge (bullish candidates first)
FOR sd = 1 TO 2 DO
IF sd = 1 THEN
sideW = 1
ELSE
sideW = -1
ENDIF
FOR w = 1 TO nW DO
IF $wAlive[w] = 1 AND $wSide[w] = sideW THEN
heldW = 0
invW = 0
IF sideW = 1 THEN
IF cJ > $wTop[w] THEN
heldW = 1
ENDIF
IF cJ < $wBtm[w] THEN
invW = 1
ENDIF
ELSE
IF cJ < $wBtm[w] THEN
heldW = 1
ENDIF
IF cJ > $wTop[w] THEN
invW = 1
ENDIF
ENDIF
IF heldW = 1 OR invW = 1 THEN
$wAlive[w] = 0
ENDIF
IF invW = 1 THEN
nI = nI + 1
$iTop[nI] = $wTop[w]
$iBtm[nI] = $wBtm[w]
$iXT[nI] = $wXT[w]
$iXB[nI] = $wXB[w]
$iBorn[nI] = barI
// an inverted bearish FVG is a bullish IFVG and vice versa
$iSide[nI] = 0 - sideW
$iMit[nI] = 0
$iAlive[nI] = 1
nIAlive = nIAlive + 1
// the oldest IFVG goes away above the limit
IF nIAlive > maxIfvg THEN
doneI = 0
FOR q = 1 TO nI DO
IF doneI = 0 AND $iAlive[q] = 1 THEN
$iAlive[q] = 0
nIAlive = nIAlive - 1
doneI = 1
ENDIF
NEXT
ENDIF
ENDIF
ENDIF
NEXT
NEXT
// ---- active IFVGs: removed when price closes back through the far edge
FOR q = 1 TO nI DO
IF $iAlive[q] = 1 THEN
IF $iSide[q] = 1 THEN
IF cJ < $iBtm[q] THEN
$iAlive[q] = 0
nIAlive = nIAlive - 1
ELSE
iRatio = min(($iTop[q] - lJ) / ($iTop[q] - $iBtm[q]), 1)
IF barI > $iBorn[q] AND iRatio > $iMit[q] THEN
$iMit[q] = iRatio
ENDIF
ENDIF
ELSE
IF cJ > $iTop[q] THEN
$iAlive[q] = 0
nIAlive = nIAlive - 1
ELSE
iRatio = min((hJ - $iBtm[q]) / ($iTop[q] - $iBtm[q]), 1)
IF barI > $iBorn[q] AND iRatio > $iMit[q] THEN
$iMit[q] = iRatio
ENDIF
ENDIF
ENDIF
ENDIF
NEXT
ENDIF
NEXT
//------------------------------------------------------------//
// DRAWING OF THIS INSTANCE
//------------------------------------------------------------//
xR = barindex + 1
xLbl = barindex + lblShift
// ---- active FVGs
IF fvgVis = 1 THEN
FOR f = 1 TO nF DO
IF $fAlive[f] = 1 THEN
zTop = $fTop[f]
zBtm = $fBtm[f]
zMid = (zTop + zBtm) / 2
xTop = $fXT[f]
xBtm = $fXB[f]
IF $fSide[f] = 1 THEN
cR = $pBuR[k]
cG = $pBuG[k]
cB = $pBuB[k]
DRAWSEGMENT(xTop, zTop, xR, zTop) COLOURED(cR, cG, cB, 89) STYLE(line, 1)
DRAWSEGMENT(xBtm, zBtm, xR, zBtm) COLOURED(cR, cG, cB, 128) STYLE(line, 2)
ELSE
cR = $pBeR[k]
cG = $pBeG[k]
cB = $pBeB[k]
DRAWSEGMENT(xTop, zTop, xR, zTop) COLOURED(cR, cG, cB, 128) STYLE(line, 2)
DRAWSEGMENT(xBtm, zBtm, xR, zBtm) COLOURED(cR, cG, cB, 89) STYLE(line, 1)
ENDIF
DRAWSEGMENT($fXM[f], zMid, xR, zMid) COLOURED(cR, cG, cB, 191) STYLE(dottedline, 1)
// zone fill between the two edges (the edges can start on different bars)
DRAWTRIANGLE(xTop, zTop, xR, zTop, xR, zBtm) COLOURED(cR, cG, cB, 0) FILLCOLOR(cR, cG, cB, 28)
DRAWTRIANGLE(xTop, zTop, xR, zBtm, xBtm, zBtm) COLOURED(cR, cG, cB, 0) FILLCOLOR(cR, cG, cB, 28)
IF $pLbl[k] = 1 THEN
pctV = round($fMit[f] * 1000) / 10
IF $fMit[f] > 0 THEN
IF isChartTf = 1 THEN
IF lblKind = 0 THEN
DRAWTEXT("Chart(#lblTf#) FVG(#pctV#%)", xLbl, zMid, SansSerif, Standard, 10) COLOURED(cR, cG, cB, 255)
ELSIF lblKind = 1 THEN
DRAWTEXT("Chart(D) FVG(#pctV#%)", xLbl, zMid, SansSerif, Standard, 10) COLOURED(cR, cG, cB, 255)
ELSIF lblKind = 2 THEN
DRAWTEXT("Chart(W) FVG(#pctV#%)", xLbl, zMid, SansSerif, Standard, 10) COLOURED(cR, cG, cB, 255)
ELSIF lblKind = 4 THEN
DRAWTEXT("Chart(#lblSec#S) FVG(#pctV#%)", xLbl, zMid, SansSerif, Standard, 10) COLOURED(cR, cG, cB, 255)
ELSE
DRAWTEXT("Chart(M) FVG(#pctV#%)", xLbl, zMid, SansSerif, Standard, 10) COLOURED(cR, cG, cB, 255)
ENDIF
ELSE
IF lblKind = 0 THEN
DRAWTEXT("HTF(#lblTf#) FVG(#pctV#%)", xLbl, zMid, SansSerif, Standard, 10) COLOURED(cR, cG, cB, 255)
ELSIF lblKind = 1 THEN
DRAWTEXT("HTF(D) FVG(#pctV#%)", xLbl, zMid, SansSerif, Standard, 10) COLOURED(cR, cG, cB, 255)
ELSIF lblKind = 2 THEN
DRAWTEXT("HTF(W) FVG(#pctV#%)", xLbl, zMid, SansSerif, Standard, 10) COLOURED(cR, cG, cB, 255)
ELSE
DRAWTEXT("HTF(M) FVG(#pctV#%)", xLbl, zMid, SansSerif, Standard, 10) COLOURED(cR, cG, cB, 255)
ENDIF
ENDIF
ELSE
IF isChartTf = 1 THEN
IF lblKind = 0 THEN
DRAWTEXT("Chart(#lblTf#) FVG", xLbl, zMid, SansSerif, Standard, 10) COLOURED(cR, cG, cB, 255)
ELSIF lblKind = 1 THEN
DRAWTEXT("Chart(D) FVG", xLbl, zMid, SansSerif, Standard, 10) COLOURED(cR, cG, cB, 255)
ELSIF lblKind = 2 THEN
DRAWTEXT("Chart(W) FVG", xLbl, zMid, SansSerif, Standard, 10) COLOURED(cR, cG, cB, 255)
ELSIF lblKind = 4 THEN
DRAWTEXT("Chart(#lblSec#S) FVG", xLbl, zMid, SansSerif, Standard, 10) COLOURED(cR, cG, cB, 255)
ELSE
DRAWTEXT("Chart(M) FVG", xLbl, zMid, SansSerif, Standard, 10) COLOURED(cR, cG, cB, 255)
ENDIF
ELSE
IF lblKind = 0 THEN
DRAWTEXT("HTF(#lblTf#) FVG", xLbl, zMid, SansSerif, Standard, 10) COLOURED(cR, cG, cB, 255)
ELSIF lblKind = 1 THEN
DRAWTEXT("HTF(D) FVG", xLbl, zMid, SansSerif, Standard, 10) COLOURED(cR, cG, cB, 255)
ELSIF lblKind = 2 THEN
DRAWTEXT("HTF(W) FVG", xLbl, zMid, SansSerif, Standard, 10) COLOURED(cR, cG, cB, 255)
ELSE
DRAWTEXT("HTF(M) FVG", xLbl, zMid, SansSerif, Standard, 10) COLOURED(cR, cG, cB, 255)
ENDIF
ENDIF
ENDIF
ENDIF
ENDIF
NEXT
ENDIF
// ---- active inverse FVGs
IF ifvgOn = 1 THEN
FOR q = 1 TO nI DO
IF $iAlive[q] = 1 THEN
zTop = $iTop[q]
zBtm = $iBtm[q]
zMid = (zTop + zBtm) / 2
xTop = $iXT[q]
xBtm = $iXB[q]
xInv = $iBorn[q]
IF $iSide[q] = 1 THEN
// bullish IFVG: it was a bearish FVG until the inversion
cR = $pBuR[k]
cG = $pBuG[k]
cB = $pBuB[k]
oR2 = $pBeR[k]
oG2 = $pBeG[k]
oB2 = $pBeB[k]
DRAWSEGMENT(xTop, zTop, xInv, zTop) COLOURED(oR2, oG2, oB2, 128) STYLE(line, 2)
DRAWSEGMENT(xBtm, zBtm, xInv, zBtm) COLOURED(oR2, oG2, oB2, 89) STYLE(line, 1)
ELSE
// bearish IFVG: it was a bullish FVG until the inversion
cR = $pBeR[k]
cG = $pBeG[k]
cB = $pBeB[k]
oR2 = $pBuR[k]
oG2 = $pBuG[k]
oB2 = $pBuB[k]
DRAWSEGMENT(xTop, zTop, xInv, zTop) COLOURED(oR2, oG2, oB2, 89) STYLE(line, 1)
DRAWSEGMENT(xBtm, zBtm, xInv, zBtm) COLOURED(oR2, oG2, oB2, 128) STYLE(line, 2)
ENDIF
// the FVG part, in its original colour
DRAWTRIANGLE(xTop, zTop, xInv, zTop, xInv, zBtm) COLOURED(oR2, oG2, oB2, 0) FILLCOLOR(oR2, oG2, oB2, 28)
DRAWTRIANGLE(xTop, zTop, xInv, zBtm, xBtm, zBtm) COLOURED(oR2, oG2, oB2, 0) FILLCOLOR(oR2, oG2, oB2, 28)
// the inverted part, dashed, from the inversion candle onwards
DRAWSEGMENT(xInv, zTop, xR, zTop) COLOURED(cR, cG, cB, 128) STYLE(dottedline2, 1)
DRAWSEGMENT(xInv, zMid, xR, zMid) COLOURED(cR, cG, cB, 191) STYLE(dottedline, 1)
DRAWSEGMENT(xInv, zBtm, xR, zBtm) COLOURED(cR, cG, cB, 128) STYLE(dottedline2, 1)
DRAWRECTANGLE(xInv, zBtm, xR, zTop) COLOURED(cR, cG, cB, 0) FILLCOLOR(cR, cG, cB, 20)
IF $pLbl[k] = 1 THEN
pctV = round($iMit[q] * 1000) / 10
IF $iMit[q] > 0 THEN
IF isChartTf = 1 THEN
IF lblKind = 0 THEN
DRAWTEXT("Chart(#lblTf#) iFVG(#pctV#%)", xLbl, zMid, SansSerif, Standard, 10) COLOURED(cR, cG, cB, 255)
ELSIF lblKind = 1 THEN
DRAWTEXT("Chart(D) iFVG(#pctV#%)", xLbl, zMid, SansSerif, Standard, 10) COLOURED(cR, cG, cB, 255)
ELSIF lblKind = 2 THEN
DRAWTEXT("Chart(W) iFVG(#pctV#%)", xLbl, zMid, SansSerif, Standard, 10) COLOURED(cR, cG, cB, 255)
ELSIF lblKind = 4 THEN
DRAWTEXT("Chart(#lblSec#S) iFVG(#pctV#%)", xLbl, zMid, SansSerif, Standard, 10) COLOURED(cR, cG, cB, 255)
ELSE
DRAWTEXT("Chart(M) iFVG(#pctV#%)", xLbl, zMid, SansSerif, Standard, 10) COLOURED(cR, cG, cB, 255)
ENDIF
ELSE
IF lblKind = 0 THEN
DRAWTEXT("HTF(#lblTf#) iFVG(#pctV#%)", xLbl, zMid, SansSerif, Standard, 10) COLOURED(cR, cG, cB, 255)
ELSIF lblKind = 1 THEN
DRAWTEXT("HTF(D) iFVG(#pctV#%)", xLbl, zMid, SansSerif, Standard, 10) COLOURED(cR, cG, cB, 255)
ELSIF lblKind = 2 THEN
DRAWTEXT("HTF(W) iFVG(#pctV#%)", xLbl, zMid, SansSerif, Standard, 10) COLOURED(cR, cG, cB, 255)
ELSE
DRAWTEXT("HTF(M) iFVG(#pctV#%)", xLbl, zMid, SansSerif, Standard, 10) COLOURED(cR, cG, cB, 255)
ENDIF
ENDIF
ELSE
IF isChartTf = 1 THEN
IF lblKind = 0 THEN
DRAWTEXT("Chart(#lblTf#) iFVG", xLbl, zMid, SansSerif, Standard, 10) COLOURED(cR, cG, cB, 255)
ELSIF lblKind = 1 THEN
DRAWTEXT("Chart(D) iFVG", xLbl, zMid, SansSerif, Standard, 10) COLOURED(cR, cG, cB, 255)
ELSIF lblKind = 2 THEN
DRAWTEXT("Chart(W) iFVG", xLbl, zMid, SansSerif, Standard, 10) COLOURED(cR, cG, cB, 255)
ELSIF lblKind = 4 THEN
DRAWTEXT("Chart(#lblSec#S) iFVG", xLbl, zMid, SansSerif, Standard, 10) COLOURED(cR, cG, cB, 255)
ELSE
DRAWTEXT("Chart(M) iFVG", xLbl, zMid, SansSerif, Standard, 10) COLOURED(cR, cG, cB, 255)
ENDIF
ELSE
IF lblKind = 0 THEN
DRAWTEXT("HTF(#lblTf#) iFVG", xLbl, zMid, SansSerif, Standard, 10) COLOURED(cR, cG, cB, 255)
ELSIF lblKind = 1 THEN
DRAWTEXT("HTF(D) iFVG", xLbl, zMid, SansSerif, Standard, 10) COLOURED(cR, cG, cB, 255)
ELSIF lblKind = 2 THEN
DRAWTEXT("HTF(W) iFVG", xLbl, zMid, SansSerif, Standard, 10) COLOURED(cR, cG, cB, 255)
ELSE
DRAWTEXT("HTF(M) iFVG", xLbl, zMid, SansSerif, Standard, 10) COLOURED(cR, cG, cB, 255)
ENDIF
ENDIF
ENDIF
ENDIF
ENDIF
NEXT
ENDIF
ENDIF
NEXT
ENDIF
RETURN