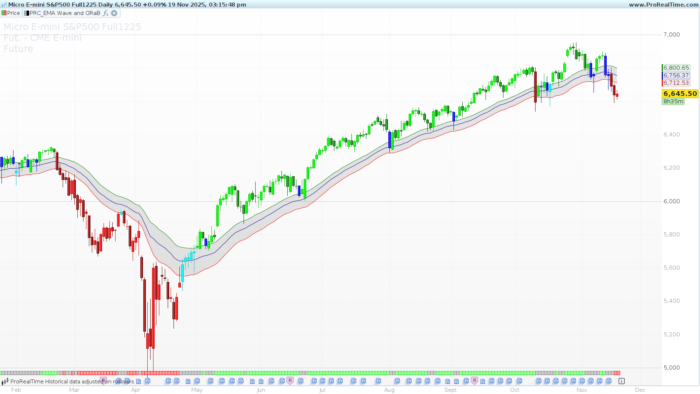
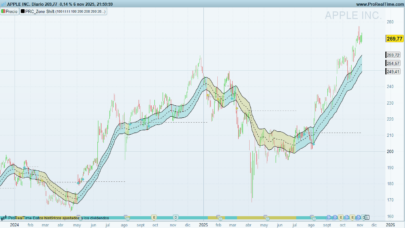
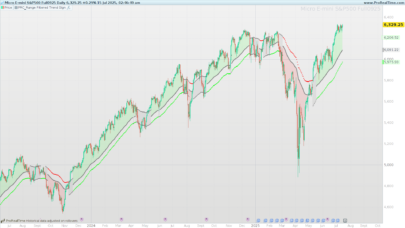
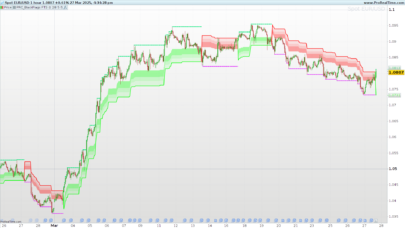
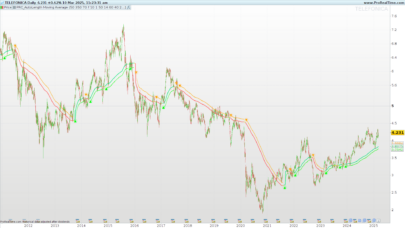
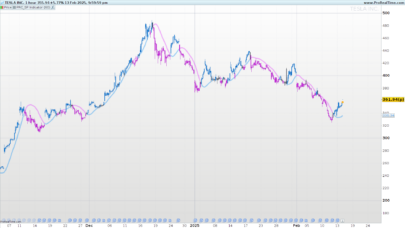
This indicator brings a comprehensive trend-following system (by JustUncleL), combining the classic 34-period EMA Wave with the popular GRaB (Green, Red, and Blue) candle coloring logic.
Designed to keep traders on the right side of the market, this tool provides immediate visual feedback on trend direction, momentum, and volatility. It helps filter out noise during ranging markets and highlights strong momentum phases.
How it Works
The system is built upon two main components:
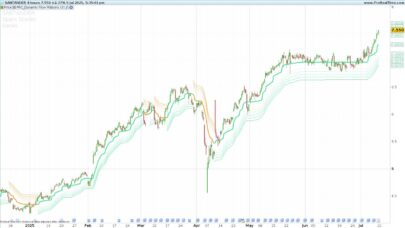
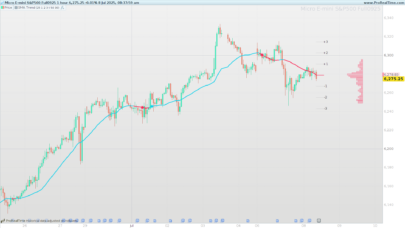
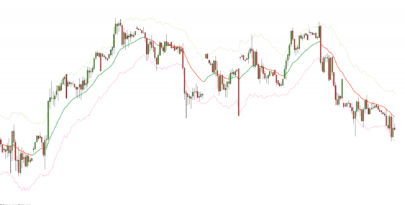
1. The EMA Wave (Price Action Channel) The “Wave” consists of three Exponential Moving Averages (EMA) set to 34 periods:
-
High Wave: 34 EMA of the High.
-
Low Wave: 34 EMA of the Low.
-
Centre Wave: 34 EMA of the Close.
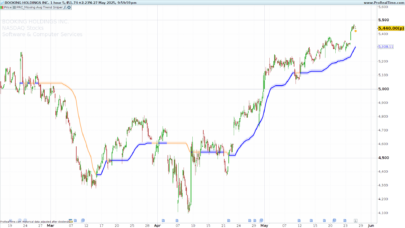
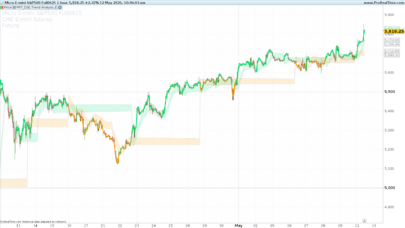
This band acts as a dynamic support and resistance zone. When the price is “riding” the bands, the trend is healthy.
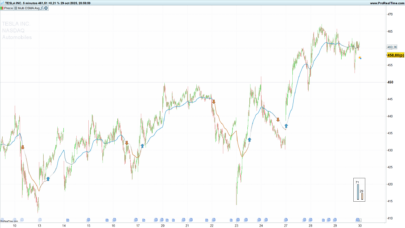
2. GRaB Candles (Color Logic) The candles are painted based on their relationship with the Wave, giving you an instant read on market sentiment:
-
Green (Bullish): The candle closes above the High Wave. This indicates strong bullish momentum.
-
Red (Bearish): The candle closes below the Low Wave. This indicates strong bearish momentum.
-
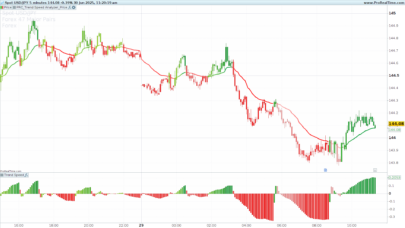
Blue/Aqua (Neutral): The candle closes inside the Wave (between the High and Low EMAs). This typically signals consolidation, retracement, or a lack of momentum.
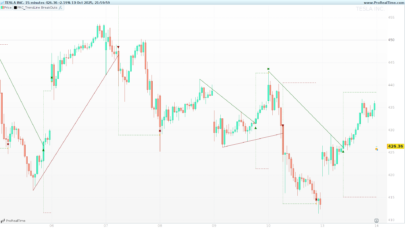
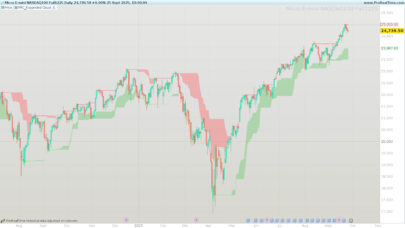
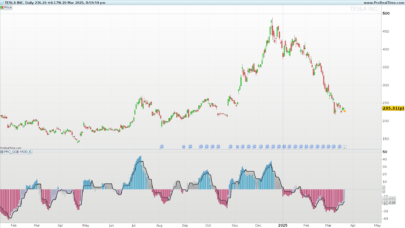
3. Trend Indicator (Bottom Ribbon) The code also includes an optional trend ribbon plotted at the bottom of the chart. This provides a secondary confirmation:
-
Lime Box: Strong Uptrend (High and Low of the candle are completely above the Wave).
-
Red Box: Strong Downtrend (High and Low of the candle are completely below the Wave).
-
Gray: Neutral/Transition zone.
Configuration
You can customize the indicator using the variable settings at the start of the code:
-
ShowPAC: Set to1to draw the 3 EMA lines on the chart, or0to hide them. -
ShowBarColor: Set to1to paint the candlesticks (GRaB style), or0to keep your default chart colors. -
ShowTrendIndi: Set to1to display the trend strength ribbon at the bottom of the panel. -
PACLen: The lookback period for the Wave. The default is 34, which is standard for this strategy, but you can adjust it to fit different timeframes.
The Code
|
1 2 3 4 5 6 7 8 9 10 11 12 13 14 15 16 17 18 19 20 21 22 23 24 25 26 27 28 29 30 31 32 33 34 35 36 37 38 39 40 41 42 43 44 45 46 47 48 49 50 51 52 53 54 55 56 57 58 59 60 61 62 63 64 65 66 67 68 69 70 71 72 73 74 75 76 77 78 79 80 81 82 83 84 85 86 87 88 89 90 91 92 93 94 95 96 97 98 99 100 101 102 103 104 105 106 107 108 109 110 111 112 113 114 115 116 117 |
// ------------------------------------------ //PRC_EMA Wave and GRaB //version = 0 //30.10.2025 //Iván González @ www.prorealcode.com //Sharing ProRealTime knowledge // ------------------------------------------ // --- VARIABLES DE USUARIO --- // ------------------------------------------ // (1 = Mostrar, 0 = Ocultar) ShowPAC = 1 // Mostrar la "Wave" (las 3 líneas EMA) ShowBarColor = 1 // Mostrar las velas coloreadas GRaB ShowTrendIndi = 1 // Mostrar indicador de tendencia PACLen = 34 // Longitud de la EMA (34 por defecto) // ------------------------------------------ // --- CÁLCULO DE LA WAVE (PAC) --- // ------------------------------------------ pacCe = exponentialaverage[PACLen](close) pacLo = exponentialaverage[PACLen](low) pacHi = exponentialaverage[PACLen](high) // ------------------------------------------ // --- LÓGICA DE COLOR DE VELAS (GRaB) --- // ------------------------------------------ // Definimos los componentes RGB para cada color colorR = 0 colorG = 0 colorB = 0 IF close >= open THEN // Vela Alcista IF close >= pacHi THEN // Lime (Verde Lima) colorR = 0 colorG = 255 colorB = 0 ELSIF close <= pacLo THEN // Red (Rojo) colorR = 255 colorG = 0 colorB = 0 ELSE // Aqua (Dentro de la Wave) colorR = 0 colorG = 255 colorB = 255 ENDIF ELSE // Vela Bajista IF close >= pacHi THEN // Green (Verde Oscuro) colorR = 0 colorG = 128 colorB = 0 ELSIF close <= pacLo THEN // DarkRed (Rojo Oscuro) colorR = 139 colorG = 0 colorB = 0 ELSE // Blue (Azul) colorR = 0 colorG = 0 colorB = 255 ENDIF ENDIF // ------------------------------------------ // --- LÓGICA DEL INDICADOR DE TENDENCIA --- // ------------------------------------------ // 1 = Fuerte Alcista (Lime) // -1 = Fuerte Bajista (Red) // 0 = Neutral (Gray) trendValue = 0 // Gris por defecto IF high > pacHi AND low > pacHi THEN trendValue = 1 // Lime ELSIF low < pacLo AND high < pacLo THEN trendValue = -1 // Red ENDIF // Asignar colores colortrendR = 128 // Gris por defecto colortrendG = 128 colortrendB = 128 IF trendValue = 1 THEN // Lime colortrendR = 0 colortrendG = 255 colortrendB = 0 ELSIF trendValue = -1 THEN // Red colortrendR = 255 colortrendG = 0 colortrendB = 0 ENDIF // ------------------------------------------ // --- DIBUJO DE VELAS --- // ------------------------------------------ // Si está activado, dibujamos las velas con el color calculado IF ShowBarColor THEN DRAWCANDLE(open, high, low, close) COLOURED(colorR, colorG, colorB) ENDIF // ------------------------------------------ // --- PLOTEO DE LÍNEAS (WAVE) --- // ------------------------------------------ // Si ShowPAC es 0, devolvemos 'undefined' para ocultar las líneas plotPacHi = undefined plotPacLo = undefined plotPacCe = undefined IF ShowPAC THEN plotPacHi = pacHi plotPacLo = pacLo plotPacCe = pacCe colorbetween(plotPacHi,plotPacLo,"grey",50) ENDIF // ------------------------------------------ // --- PLOTEO Indicador Tendencia--- // ------------------------------------------ // Devolvemos el valor solo si ShowTrendIndi es 1 plotValue = undefined IF ShowTrendIndi THEN plotValue = trendValue drawrectangle(barindex,30,barindex+1,40)coloured(colortrendR,colortrendG,colortrendB)fillcolor(colortrendR,colortrendG,colortrendB,90)anchor(bottom,index,yshift) ENDIF // -------------------------------------- RETURN plotPacHi AS "High Wave"coloured("green"), plotPacCe AS "Centre Wave"coloured("darkblue"), plotPacLo AS "Low Wave"coloured("red") |
Share this
No information on this site is investment advice or a solicitation to buy or sell any financial instrument. Past performance is not indicative of future results. Trading may expose you to risk of loss greater than your deposits and is only suitable for experienced investors who have sufficient financial means to bear such risk.
ProRealTime ITF files and other attachments :
Find other exclusive trading pro-tools on ![]()
PRC is also on YouTube, subscribe to our channel for exclusive content and tutorials


Thank you!!! Very useful indicator!
muchas gracias visualmente una pasada, muchas gracias