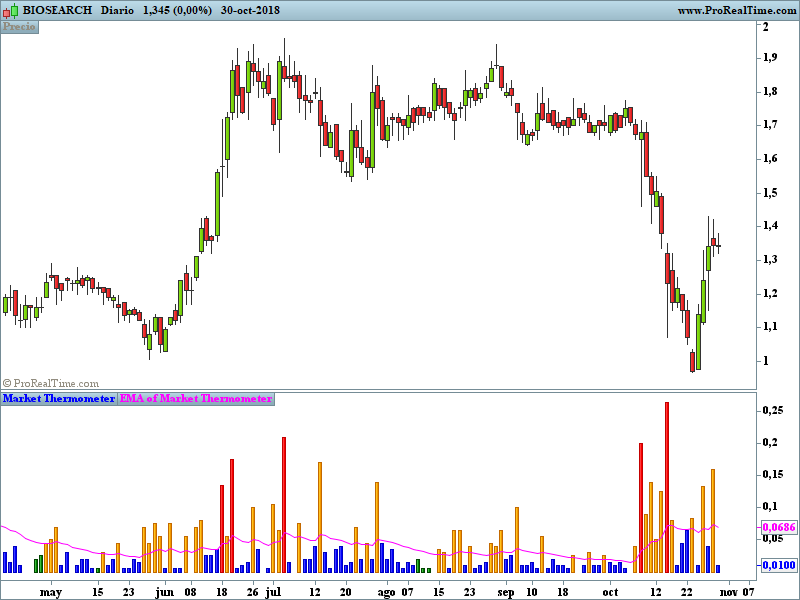
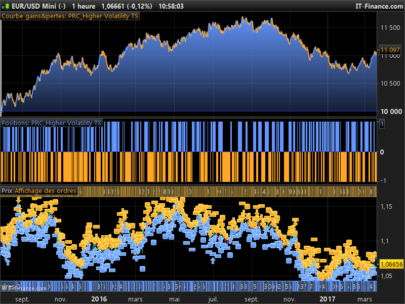
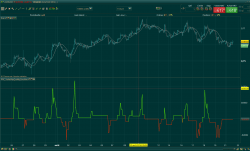
The Market Thermometer is described in Come into My Trading Room. It measures the degree
of volatility, as reflected in greater or smaller intraday ranges. When the Market Temperature
spikes above its average or stays below its average for a number of days, it gives trading
signals, as described in the book.
Spikes are highlighted by yellow and red bars. Quiet periods are marked with dark blue bars throughout
the quiet period.
|
1 2 3 4 5 6 7 8 9 10 11 12 13 14 15 16 17 18 19 20 21 22 23 24 25 26 27 28 29 30 31 32 33 34 35 36 37 38 39 40 41 42 43 44 |
REM ELDER´S MARKET THERMOMETER lengthMA=22//input(22, "EMA Length") explosiveMktThreshold=3//input(3, title="Explosive Market Threshold") idleMarketThreshold=7//input(7, title="Idle Market Threshold") if high<high[1] and low>low[1] then emt=0 elsif (high-high[1])> low[1]-low then emt=abs(high-high[1]) else emt = abs(low[1] - low) endif aemt =ExponentialAverage[lengthMA](emt) if aemt>emt then qc=(qc[1])+1 else qc=0 endif if (emt< aemt) then if qc>idleMarketThreshold then r=0 g=128 b=0 else r=0 g=0 b=255 endif elsif (emt > aemt) and (emt < aemt*explosiveMktThreshold)then r=255 g=165 b=0 else r=255 g=0 b=0 endif return emt coloured(r,g,b)style(histogram)as "Market Thermometer",aemt coloured(255,0,255)as"EMA of Market Thermometer" |
Share this
No information on this site is investment advice or a solicitation to buy or sell any financial instrument. Past performance is not indicative of future results. Trading may expose you to risk of loss greater than your deposits and is only suitable for experienced investors who have sufficient financial means to bear such risk.
ProRealTime ITF files and other attachments :
Find other exclusive trading pro-tools on ![]()
PRC is also on YouTube, subscribe to our channel for exclusive content and tutorials


Bonjour Bolsatrilera,j’essaie de vous contacter pour le cm rsi ;je le trouve interessant, merci de l’avoir mis à disposition! Mais je me demande s’il existe une version qui ferait apparaître les divergences avec le cours, auriez-vous des informations sur ce sens? Merci beaucoup, cordialement, Jissey
J’essaie de vous contacter pour l’indicateur”cm rsi”….