

Elder's Market thermometer
November 15, 2018, 12:49 PM
Indicators
2 Comments
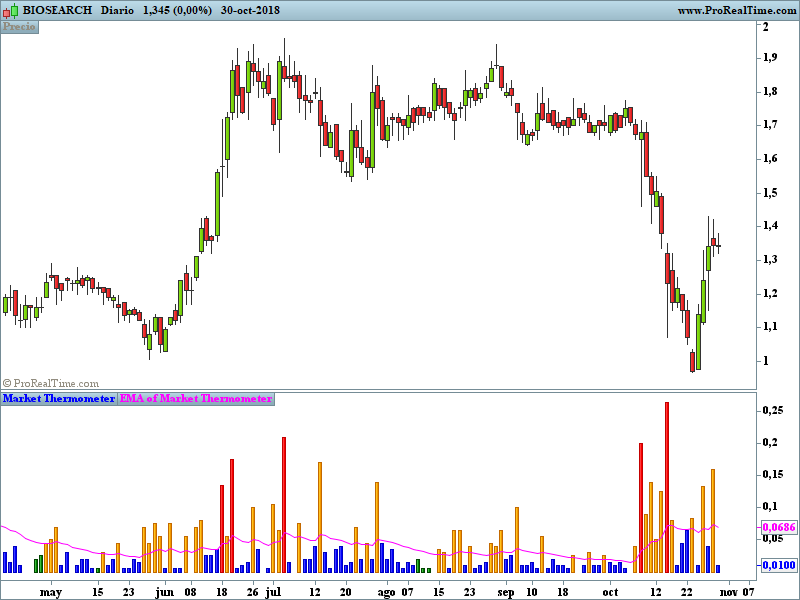
The Market Thermometer is described in Come into My Trading Room. It measures the degree
of volatility, as reflected in greater or smaller intraday ranges. When the Market Temperature
spikes above its average or stays below its average for a number of days, it gives trading
signals, as described in the book.
Spikes are highlighted by yellow and red bars. Quiet periods are marked with dark blue bars throughout
the quiet period.
REM ELDER´S MARKET THERMOMETER

lengthMA=22//input(22, "EMA Length")
explosiveMktThreshold=3//input(3, title="Explosive Market Threshold")
idleMarketThreshold=7//input(7, title="Idle Market Threshold")

if high<high[1] and low>low[1] then
 emt=0
elsif (high-high[1])> low[1]-low then
 emt=abs(high-high[1])
else
 emt = abs(low[1] - low)
endif


aemt =ExponentialAverage[lengthMA](emt)

if aemt>emt then
 qc=(qc[1])+1
else
 qc=0
endif

if  (emt< aemt) then
 if qc>idleMarketThreshold then
  r=0
  g=128
  b=0
 else
  r=0
  g=0
  b=255
 endif
elsif  (emt > aemt) and (emt < aemt*explosiveMktThreshold)then
 r=255
 g=165
 b=0
else
 r=255
 g=0
 b=0
endif

return emt coloured(r,g,b)style(histogram)as "Market Thermometer",aemt coloured(255,0,255)as"EMA of Market Thermometer"
Download
Filename:
Elders-market-thermometer.itf
Downloads:
176
Master
Code artist, my biography is a blank page waiting to be scripted. Imagine a bio so awesome it hasn't been coded yet.
Author’s Profile
Loading...