Dynamic Trend Bands & Anchored VWAP Signals
Introduction
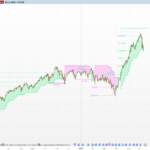
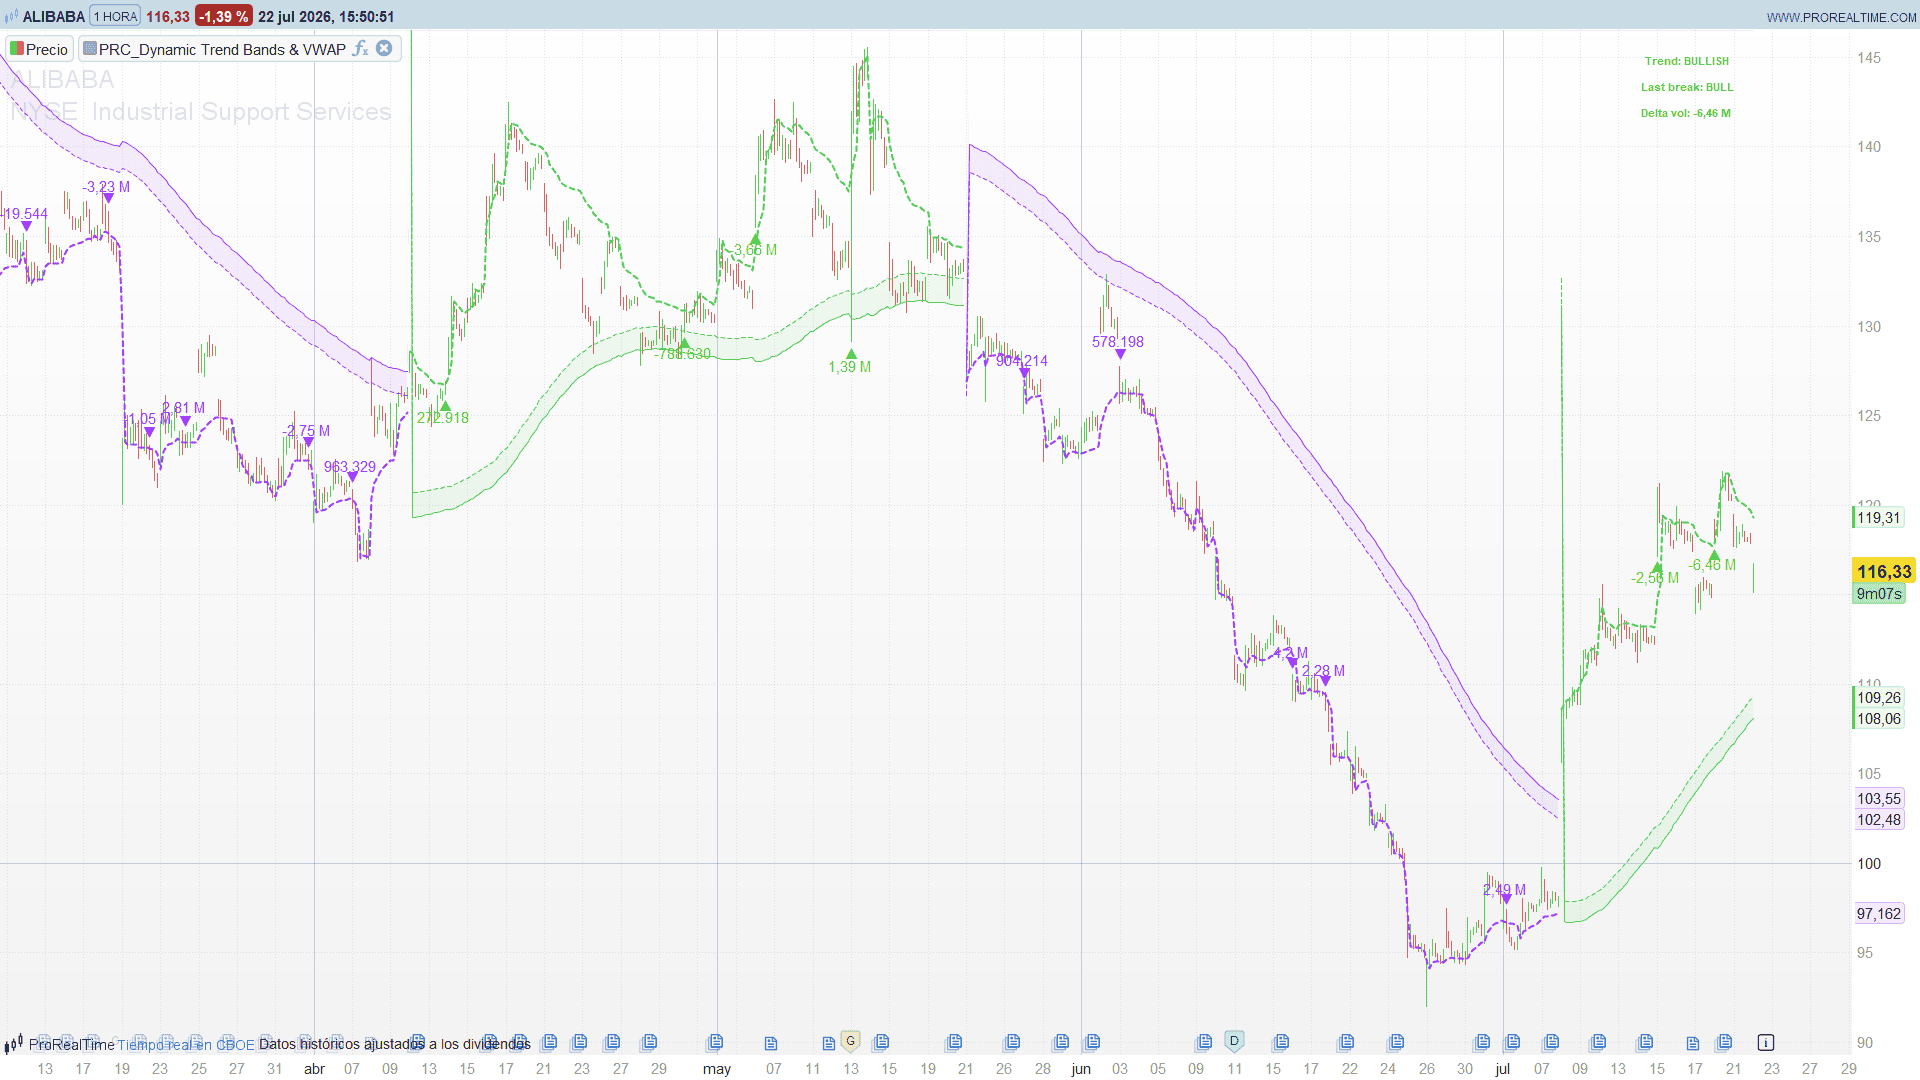
BigBeluga’s Dynamic Trend Bands & Anchored VWAP Signals is two indicators stacked on one overlay. The first is a regime engine: a slow double-EMA baseline with volatility bands at ±3·ATR, where price breaking the upper band arms a bullish regime and breaking the lower band a bearish one. The second is the interesting half: inside each regime it anchors a volume-weighted average to the most recent swing, re-anchors it whenever a newer swing forms, and fires a signal — with the anchored cumulative volume delta attached — when price breaks back through that VWAP.
Theory Behind the Indicator
1. The trend bands
The baseline is an EMA of an EMA (length 50). Bands sit at a fixed volatility distance:
atrValue  = ta.atr(100)
lrCenter  = ta.ema(ta.ema(close, 50), 50)
upperBand = lrCenter + atrValue * 3
lowerBand = lrCenter - atrValue * 3
The regime is a two-state machine that only flips on a band break, and holds otherwise. A bullish regime shows only the lower band (dynamic support), a bearish regime only the upper band (resistance). You never see both — the band you see is the one price is trending away from.
2. The anchored VWAP and its signal
Within a regime the indicator anchors a volume-weighted average to the latest swing — a pivot low in a bearish regime, a pivot high in a bullish one — and re-anchors when a fresher swing appears. A cumulative volume delta runs alongside: up-bar volume added, down-bar volume subtracted, from the anchor forward.
The signal is a break of the anchored VWAP: in a bearish regime, price closing back below the VWAP anchored at the last bounce (breakDn, ▼); in a bullish regime, closing above the VWAP anchored at the last high (breakUp, ▲). But — and this is the part that is easy to miss — it does not fire on every cross. One signal per anchor cycle, then silence until the next confirmed pivot. That lifecycle is the signal filter.
Dynamic Trend Bands & Anchored VWAP Code
//----------------------------------------------
//PRC_Dynamic Trend Bands & Anchored VWAP
//version = 0
//22.07.26
//Ivan Gonzalez @ www.prorealcode.com
//Traducido de "Dynamic Trend Bands & Anchored VWAP Signals [BigBeluga]" (PineScript v6)
//Autor original: BigBeluga  -  Licencia CC BY-NC-SA 4.0
//Sharing ProRealTime knowledge
//----------------------------------------------
// --- Parametros (declarar como Variables en el editor) ---
lrLength = 50        // Baseline Length (doble EMA)
atrLength = 100      // ATR Volatility Length
atrMult = 3.0        // ATR Band Multiplier
pivotLength = 10     // Pivot Point Detection Length
showDash = 1         // 1 = muestra el panel informativo
fillAlpha = 20       // opacidad del relleno de banda (0=invisible, 255=opaco)
//----------------------------------------------
// --- Colores (bull = lima, bear = morado) ---
//----------------------------------------------
bullR = 80
bullG = 200
bullB = 80
bearR = 158
bearG = 55
bearB = 255
//----------------------------------------------
//=== BANDAS DE VOLATILIDAD ===
//----------------------------------------------
atrValue = averagetruerange[atrLength](close)
ema1 = average[lrLength,1](close)
emaBase = average[lrLength,1](ema1)
upperBand = emaBase + atrValue * atrMult
lowerBand = emaBase - atrValue * atrMult
//----------------------------------------------
//=== ESTADO DE TENDENCIA (maquina HLV) ===
// close cruza upperBand -> alcista ; close cruza lowerBand -> bajista
//----------------------------------------------
if barindex = 0 then
   trendState = 0
elsif close crosses over upperBand then
   trendState = 1
elsif close crosses under lowerBand then
   trendState = -1
else
   trendState = trendState[1]
endif
//----------------------------------------------
//=== PLOTS CONDICIONALES DE BANDAS ===
if trendState = -1 and trendState[1] <> -1 then
   alphavwapLow = 0
   alphavwapHigh = 0
elsif trendState = -1 then
   plotUpper = upperBand
   plotUpperInner = upperBand - atrValue
   alphavwapLow = 255
   alphavwapHigh = 0
else
   plotUpper = undefined
   plotUpperInner = undefined
endif

if trendState = 1 and trendState[1] <> 1 then
   alphavwapHigh = 0
   alphavwapLow = 0
elsif trendState = 1 then
   plotLower = lowerBand
   plotLowerInner = lowerBand + atrValue
   alphavwapLow = 0
   alphavwapHigh = 255
else
   plotLower = undefined
   plotLowerInner = undefined
endif
//----------------------------------------------
//=== PIVOTES CONFIRMADOS (para ARMAR la señal) ===
confLow = 0
if barindex > 2 * pivotLength and low[pivotLength] = lowest[2 * pivotLength + 1](low) then
   confLow = 1
endif
confHigh = 0
if barindex > 2 * pivotLength and high[pivotLength] = highest[2 * pivotLength + 1](high) then
   confHigh = 1
endif
//----------------------------------------------
//=== VWAP ANCLADO AL SWING LOW (regimen bajista) ===
loN = lowest[pivotLength](low)
newLowPiv = 0
if barindex > pivotLength and low[1] = loN and low > loN then
   newLowPiv = 1
endif
freshBear = 0
if trendState = -1 and trendState[1] <> -1 then
   freshBear = 1
endif

if trendState = -1 then
   if close > open then
      svLow = volume
   else
      svLow = -volume
   endif
   if newLowPiv or freshBear then
      sumVLow = volume
      sumVPLow = volume * low
      deltaLow = svLow
   else
      sumVLow = sumVLow[1] + volume
      sumVPLow = sumVPLow[1] + volume * low
      deltaLow = deltaLow[1] + svLow
   endif
   if sumVLow > 0 then
      vwapLow = sumVPLow / sumVLow
   else
      vwapLow = undefined
   endif
   if confLow then
      armedLow = 1
   else
      armedLow = armedLow[1]
   endif
   breakDn = 0
   if armedLow and close <= vwapLow then
      breakDn = 1
      armedLow = 0
   endif
else
   sumVLow = 0
   sumVPLow = 0
   deltaLow = 0
   vwapLow = undefined
   armedLow = 0
   breakDn = 0
endif
//----------------------------------------------
//=== VWAP ANCLADO AL SWING HIGH (regimen alcista) ===
hiN = highest[pivotLength](high)
newHighPiv = 0
if barindex > pivotLength and high[1] = hiN and high < hiN then
   newHighPiv = 1
endif
freshBull = 0
if trendState = 1 and trendState[1] <> 1 then
   freshBull = 1
endif

if trendState = 1 then
   if close > open then
      svHigh = volume
   else
      svHigh = -volume
   endif
   if newHighPiv or freshBull then
      sumVHigh = volume
      sumVPHigh = volume * high
      deltaHigh = svHigh
   else
      sumVHigh = sumVHigh[1] + volume
      sumVPHigh = sumVPHigh[1] + volume * high
      deltaHigh = deltaHigh[1] + svHigh
   endif
   if sumVHigh > 0 then
      vwapHigh = sumVPHigh / sumVHigh
   else
      vwapHigh = undefined
   endif
   if confHigh then
      armedHigh = 1
   else
      armedHigh = armedHigh[1]
   endif
   breakUp = 0
   if armedHigh and close >= vwapHigh then
      breakUp = 1
      armedHigh = 0
   endif
else
   sumVHigh = 0
   sumVPHigh = 0
   deltaHigh = 0
   vwapHigh = undefined
   armedHigh = 0
   breakUp = 0
endif
//----------------------------------------------
//=== HISTORIA DEL ULTIMO BREAKOUT (para el panel) ===
once lastBreakType = 0
once lastBreakVol = 0
if breakUp then
   lastBreakType = 1
   lastBreakVol = deltaHigh
elsif breakDn then
   lastBreakType = -1
   lastBreakVol = deltaLow
endif
//----------------------------------------------
//=== DIBUJOS DE SEÑAL (X fija, inline) ===
atrOff = atrValue * 0.5
if breakUp then
   drawtext("▲", barindex, low - atrOff) coloured(bullR, bullG, bullB, 255)
   dVolUp = round(deltaHigh)
   drawtext("#dVolUp#", barindex, low - atrOff * 2) coloured(bullR, bullG, bullB, 255)
endif
if breakDn then
   drawtext("▼", barindex, high + atrOff) coloured(bearR, bearG, bearB, 255)
   dVolDn = round(deltaLow)
   drawtext("#dVolDn#", barindex, high + atrOff * 2) coloured(bearR, bearG, bearB, 255)
endif
//----------------------------------------------
//=== PANEL INFORMATIVO (esquina superior derecha, ultima barra) ===
if showDash and islastbarupdate then
   panelX = -230
   panelY = -30
   if trendState = 1 then
      drawtext("Trend: BULLISH", panelX, panelY, sansserif, bold, 11) coloured(bullR, bullG, bullB, 255) anchor(topright, xshift, yshift)
   elsif trendState = -1 then
      drawtext("Trend: BEARISH", panelX, panelY, sansserif, bold, 11) coloured(bearR, bearG, bearB, 255) anchor(topright, xshift, yshift)
   else
      drawtext("Trend: NEUTRAL", panelX, panelY, sansserif, bold, 11) coloured(150, 150, 150, 255) anchor(topright, xshift, yshift)
   endif
   lbVol = round(lastBreakVol)
   if lastBreakType = 1 then
      drawtext("Last break: BULL", panelX, panelY - 26, sansserif, bold, 11) coloured(bullR, bullG, bullB, 255) anchor(topright, xshift, yshift)
      drawtext("Delta vol: #lbVol#", panelX, panelY - 52, sansserif, bold, 11) coloured(bullR, bullG, bullB, 255) anchor(topright, xshift, yshift)
   elsif lastBreakType = -1 then
      drawtext("Last break: BEAR", panelX, panelY - 26, sansserif, bold, 11) coloured(bearR, bearG, bearB, 255) anchor(topright, xshift, yshift)
      drawtext("Delta vol: #lbVol#", panelX, panelY - 52, sansserif, bold, 11) coloured(bearR, bearG, bearB, 255) anchor(topright, xshift, yshift)
   else
      drawtext("Last break: none", panelX, panelY - 26, sansserif, bold, 11) coloured(150, 150, 150, 255) anchor(topright, xshift, yshift)
   endif
endif
//----------------------------------------------
//=== RELLENOS DE BANDA (colorbetween, alpha bajo = sutil) ===
colorbetween(plotUpper, plotUpperInner, bearR, bearG, bearB, fillAlpha)
colorbetween(plotLower, plotLowerInner, bullR, bullG, bullB, fillAlpha)
//----------------------------------------------
return plotUpper coloured(bearR, bearG, bearB, alphavwapLow) style(line, 1) as "Resistencia", plotUpperInner coloured(bearR, bearG, bearB, alphavwapLow) style(dottedline, 1) as "Resistencia int", plotLower coloured(bullR, bullG, bullB, alphavwapHigh) style(line, 1) as "Soporte", plotLowerInner coloured(bullR, bullG, bullB, alphavwapHigh) style(dottedline, 1) as "Soporte int", vwapLow coloured(bearR, bearG, bearB, alphavwapLow) style(dottedline, 2) as "VWAP low", vwapHigh coloured(bullR, bullG, bullB, alphavwapHigh) style(dottedline, 2) as "VWAP high"