Supertrend + Fibonacci OTE Grid
Introduction
Drawing a Fibonacci retracement by hand has one honest problem: you choose the two points. Two traders looking at the same chart anchor on different swings, get different levels, and both are convinced the market respected theirs.
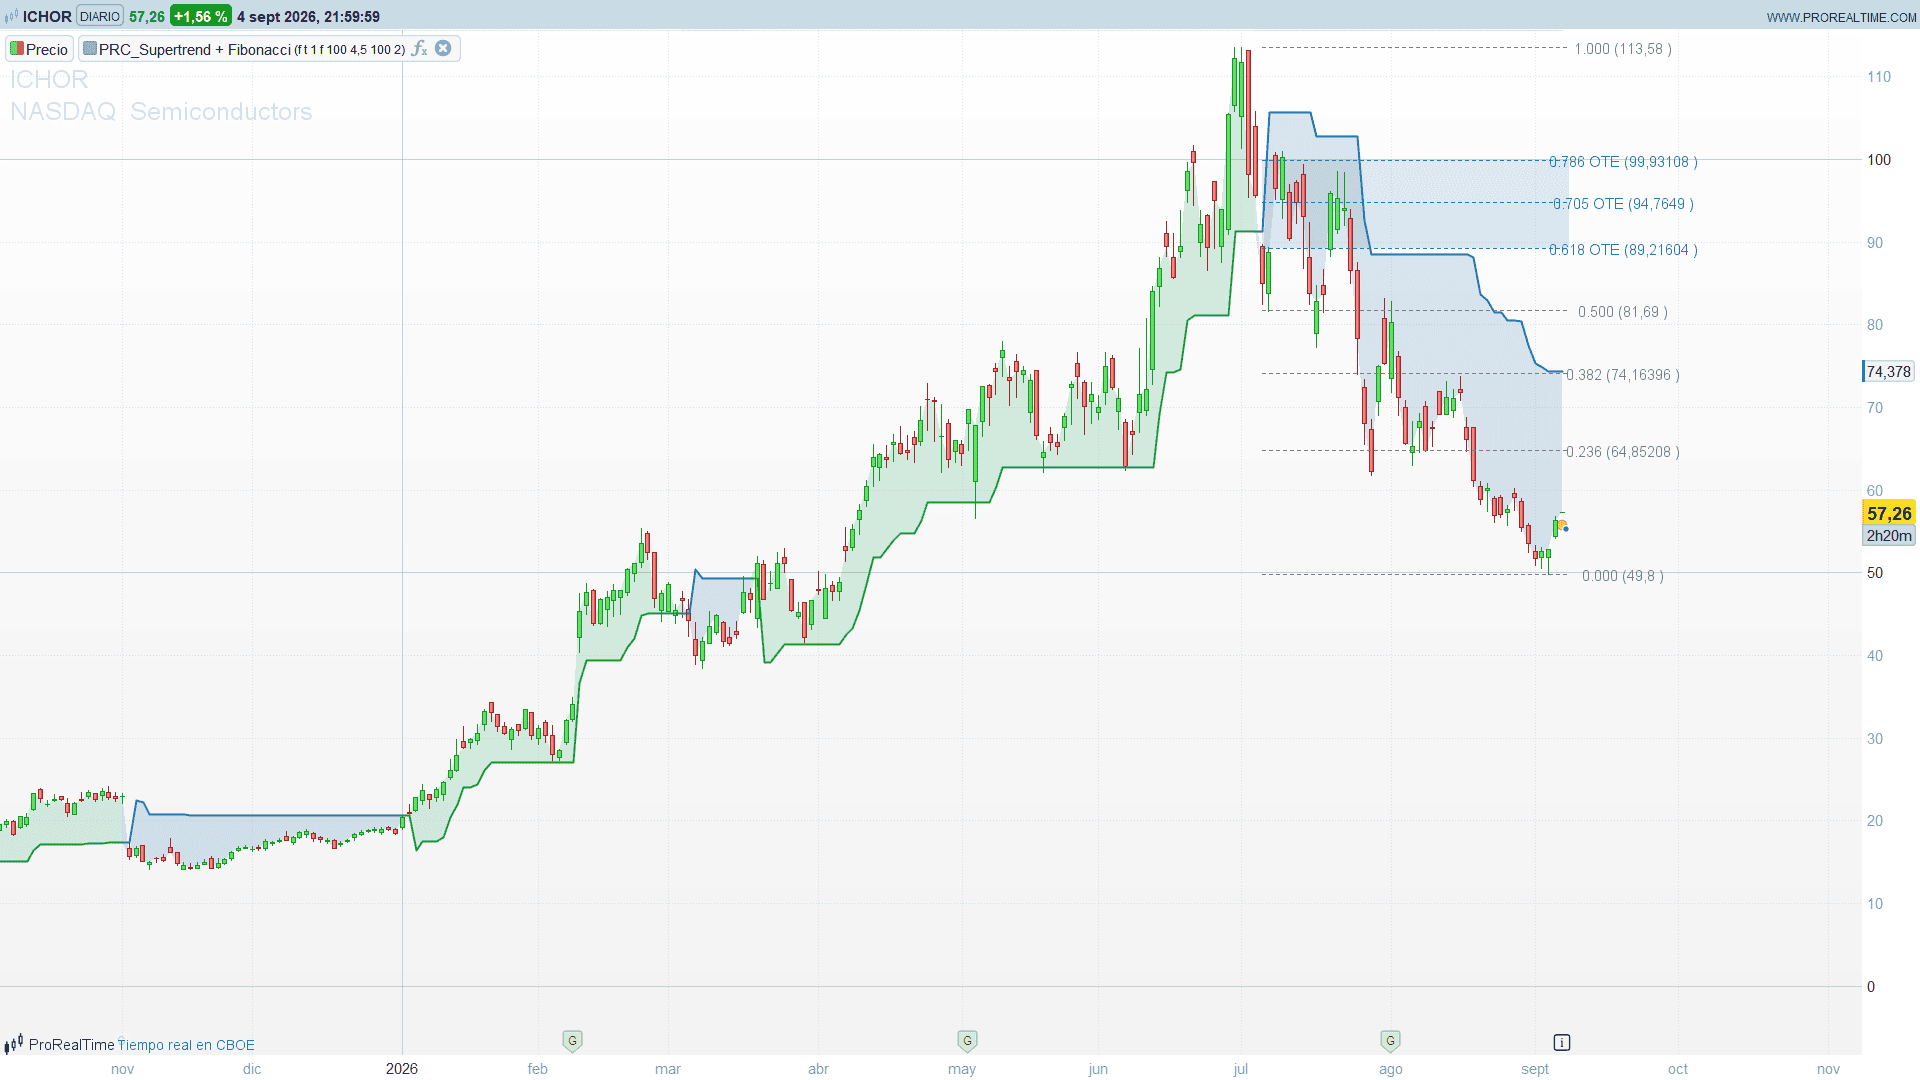
Supertrend + Fibonacci OTE Grid & Bands removes that choice. A slow Supertrend defines where the current leg started, the running high and low of that leg define its extremes, and the grid is drawn between them. When the Supertrend flips, the old grid is discarded and a new one is anchored on the new leg. There is nothing to pick and nothing to re-drag.
What you get is a retracement map that is always measuring the leg you are actually in, with the Optimal Trade Entry zone — 0.618 to 0.786 — shaded on top of it.
Theory Behind the Indicator
1. The Supertrend as an anchor, not as a signal
The default settings are ATR 100 with a multiplier of 4.5. That is a very slow Supertrend, and deliberately so: it is not there to give entries. Its job is to answer one question — when did the current leg begin? — and to answer it rarely enough that the grid is stable.
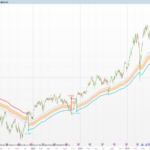
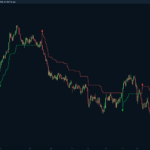
The stop line trails in the usual way: bands are placed at hl2 ± 4.5 × ATR, each band only moves in the favourable direction unless the previous close broke through it, and the direction flips when price closes beyond the active band. On the chart, the line is drawn below price in an uptrend, above it in a downtrend, and the space between the line and the close is shaded in the trend colour.
The line is intentionally cut on the flip bar, so you do not get a vertical stroke jumping from one side of price to the other.
2. The leg extremes
On the bar the trend flips, the anchors are reset. In an uptrend, the high of the flip bar and the lowest low of the last five bars; in a downtrend, the highest high of the last five bars and the low of the flip bar. That five-bar look-back matters: the actual extreme of a leg is usually a bar or two before the Supertrend registers the flip, so taking only the flip bar would systematically clip the anchor.
From there, the anchors extend with the running maximum and minimum of the leg. Every new high in an uptrend widens the grid, and every level moves with it.
3. The grid, and the direction that surprises people
The levels are 0, 0.236, 0.382, 0.5, 0.618, 0.705, 0.786 and 1.0, drawn from the anchor of the leg to the current bar, with the price value of each level written on the right edge.
Now the part that looks backwards until you think about it: in an uptrend the 0.000 level is the leg high and the 1.000 is the leg low, and in a downtrend the reverse. The grid is not measuring how far the trend has advanced — it is measuring how far the retracement has come back from the extreme. Zero is “at the extreme, no pullback”; one is “the whole leg has been given back”. That is why the 0.618–0.786 band ends up where you actually want to buy a pullback in an uptrend, which is the whole point of the OTE concept.
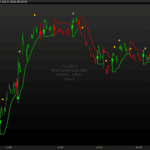
A level within 1 ATR of the close is highlighted in a distinct colour and drawn three times thicker. That single feature does more work than it looks like it should: it turns a static grid into something that tells you, at a glance, which line the market is currently negotiating with.
4. The alternative: Fibonacci Bands
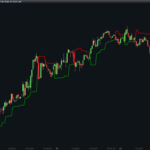
The second mode drops the anchored grid entirely and draws the same ratios as bands running parallel to the Supertrend, at fractions of ATR × 2 away from it, on the opposite side to the trend. The 1.000 band is the Supertrend line itself; the 0.000 band is the far edge.
This turns the tool into a channel rather than a retracement map. It never re-anchors, so it is continuous and smooth, but it also stops telling you anything about the structure of the current leg. I find the grid mode far more useful, and I suspect most people will — the bands mode is closer to a Keltner channel with extra lines.
How to Read It
The practical sequence is short.
Wait for the leg. The Supertrend is slow on purpose. A fresh flip means the grid has just re-anchored on a leg that has barely developed, and the levels will move a lot over the next bars as the running extreme extends. Grids on young legs are not stable.
Watch which level is highlighted. The thick, coloured line is the one price is trading around right now. In a healthy trend, price working the 0.236–0.382 area and rejecting is continuation. Price working the OTE zone is the deeper pullback that the indicator is built to find.
Use the 1.000 as invalidation. It is the origin of the leg. A retracement beyond it is not a retracement any more, and it usually precedes the Supertrend flip that will re-anchor everything.
The OTE shading between 0.618 and 0.786 is the zone the indicator is named after, and it is where the tool expects the pullback to end in a trend that is still intact.
The Code
//PRC_Supertrend + Fibonacci OTE Grid & Bands
//version = 1
//08.09.2026
//Ivan Gonzalez @ www.prorealcode.com
//Translated from "Supertrend + Fibonacci OTE Grid & Bands [BigBeluga]", Pine v6
// ----------------------------------------------------------------
defparam drawonlastbaronly = true
// ---------------------------------------------------------------- Inputs
fibMode = 0            // 0 = OTE Grid (anchored per trend leg), 1 = Fibonacci Bands
showLabels = 1         // 1 = right-edge text labels
proxThreshold = 1.0    // ATR distance under which a level is highlighted
nonOteDim = 0          // 1 = fade the non-OTE levels
stAtrPeriod = 100      // Supertrend ATR period
stFactor = 4.5         // Supertrend multiplier
atrLength = 100        // ATR period for the bands and the proximity test
outerRatio = 2.0       // max band distance, in ATR

// ------------------------------------------------------------- Palette
upR = 20
upG = 160
upB = 95               // bullish trend
dnR = 30
dnG = 120
dnB = 175              // bearish trend
hlR = 200
hlG = 145
hlB = 20               // active level
gyR = 120
gyG = 123
gyB = 134              // plain fibonacci levels

// ----------------------------------------------- Supertrend (ta.supertrend)
warmST = max(stAtrPeriod, atrLength) + 2
stAtr = averagetruerange[stAtrPeriod]
srcMid = (high + low) / 2
rawUp = srcMid + stFactor * stAtr
rawDn = srcMid - stFactor * stAtr

// averagetruerange[p] is undefined until bar p-1. Feeding that undefined into
// the trailing recursion below would keep the whole supertrend undefined for
// the rest of the history, so the seed bar is the first one with a valid ATR.
IF barindex < warmST THEN
   bandUp = high
   bandDn = low
   stDir = 1
   stLine = high
ELSIF barindex = warmST THEN
   bandUp = rawUp
   bandDn = rawDn
   stDir = 1
   stLine = rawUp
ELSE
   IF rawDn > bandDn[1] OR close[1] < bandDn[1] THEN
      bandDn = rawDn
   ELSE
      bandDn = bandDn[1]
   ENDIF
   IF rawUp < bandUp[1] OR close[1] > bandUp[1] THEN
      bandUp = rawUp
   ELSE
      bandUp = bandUp[1]
   ENDIF
   // stDir[1] = 1 means the previous supertrend sat on the upper band, which
   // is the test the Pine source writes as prevSuperTrend == prevUpperBand
   IF stDir[1] = 1 THEN
      IF close > bandUp THEN
         stDir = -1
      ELSE
         stDir = 1
      ENDIF
   ELSE
      IF close < bandDn THEN
         stDir = 1
      ELSE
         stDir = -1
      ENDIF
   ENDIF
   IF stDir = -1 THEN
      stLine = bandDn
   ELSE
      stLine = bandUp
   ENDIF
ENDIF

// dir < 0 is the bullish side, exactly as in the original
IF stDir < 0 THEN
   trR = upR
   trG = upG
   trB = upB
ELSE
   trR = dnR
   trG = dnG
   trB = dnB
ENDIF

// ------------------------------------------------- Extremes of the leg
hh5 = highest[5](high)
ll5 = lowest[5](low)

IF barindex <= warmST THEN
   legHi = high
   legLo = low
   legStart = barindex
ELSIF stDir <> stDir[1] THEN
   IF stDir < 0 THEN
      legHi = high
      legLo = ll5
   ELSE
      legHi = hh5
      legLo = low
   ENDIF
   legStart = barindex
ELSE
   legHi = max(legHi[1], high)
   legLo = min(legLo[1], low)
   legStart = legStart[1]
ENDIF

// ------------------------------------------------------ Fibonacci Bands
bandAtr = averagetruerange[atrLength]
IF stDir < 0 THEN
   bandMult = 1.0
ELSE
   bandMult = -1.0
ENDIF
totalDist = bandMult * bandAtr * outerRatio

IF fibMode = 1 AND barindex > warmST THEN
   fb100 = stLine
   fb786 = stLine + totalDist * 0.214
   fb705 = stLine + totalDist * 0.295
   fb618 = stLine + totalDist * 0.382
   fb50 = stLine + totalDist * 0.500
   fb382 = stLine + totalDist * 0.618
   fb236 = stLine + totalDist * 0.764
   fb0 = stLine + totalDist
ELSE
   fb100 = undefined
   fb786 = undefined
   fb705 = undefined
   fb618 = undefined
   fb50 = undefined
   fb382 = undefined
   fb236 = undefined
   fb0 = undefined
ENDIF

// ------------------------------------------------- OTE Grid level values
IF stDir < 0 THEN
   lv0 = legHi
   lv100 = legLo
   legSpan = lv0 - lv100
   lv236 = lv0 - legSpan * 0.236
   lv382 = lv0 - legSpan * 0.382
   lv50 = lv0 - legSpan * 0.500
   lv618 = lv0 - legSpan * 0.618
   lv705 = lv0 - legSpan * 0.705
   lv786 = lv0 - legSpan * 0.786
ELSE
   lv0 = legLo
   lv100 = legHi
   legSpan = lv100 - lv0
   lv236 = lv0 + legSpan * 0.236
   lv382 = lv0 + legSpan * 0.382
   lv50 = lv0 + legSpan * 0.500
   lv618 = lv0 + legSpan * 0.618
   lv705 = lv0 + legSpan * 0.705
   lv786 = lv0 + legSpan * 0.786
ENDIF

$lvVal[0] = lv0
$lvVal[1] = lv236
$lvVal[2] = lv382
$lvVal[3] = lv50
$lvVal[4] = lv618
$lvVal[5] = lv705
$lvVal[6] = lv786
$lvVal[7] = lv100
$lvOte[0] = 0
$lvOte[1] = 0
$lvOte[2] = 0
$lvOte[3] = 0
$lvOte[4] = 1
$lvOte[5] = 1
$lvOte[6] = 1
$lvOte[7] = 0

// ------------------------------------------------------------- Drawing
proxRange = bandAtr * proxThreshold
gridX1 = legStart
gridX2 = barindex + 1
labelX = barindex + 9

IF islastbarupdate AND barindex > warmST THEN

   IF fibMode = 0 THEN
      // OTE zone band first, so the level lines stay on top of it
      DRAWRECTANGLE(gridX1, lv618, gridX2, lv786) COLOURED(0,0,0,0) FILLCOLOR(trR,trG,trB,35)

      FOR iLv = 0 TO 7 DO
         lvY = $lvVal[iLv]
         IF abs(close - lvY) <= proxRange THEN
            DRAWSEGMENT(gridX1, lvY, gridX2, lvY) COLOURED(hlR,hlG,hlB,255) STYLE(line,3)
         ELSIF $lvOte[iLv] = 1 THEN
            DRAWSEGMENT(gridX1, lvY, gridX2, lvY) COLOURED(trR,trG,trB,255) STYLE(dottedline,1)
         ELSIF nonOteDim = 1 THEN
            DRAWSEGMENT(gridX1, lvY, gridX2, lvY) COLOURED(gyR,gyG,gyB,100) STYLE(dottedline,1)
         ELSE
            DRAWSEGMENT(gridX1, lvY, gridX2, lvY) COLOURED(gyR,gyG,gyB,255) STYLE(dottedline,1)
         ENDIF
      NEXT

      // DRAWTEXT centres the string on the anchor, so the labels are pushed
      // to the right of the last bar instead of being left-aligned on it
      IF showLabels = 1 THEN
         DRAWTEXT("0.000 (#lv0#)", labelX, lv0) COLOURED(gyR,gyG,gyB)
         DRAWTEXT("0.236 (#lv236#)", labelX, lv236) COLOURED(gyR,gyG,gyB)
         DRAWTEXT("0.382 (#lv382#)", labelX, lv382) COLOURED(gyR,gyG,gyB)
         DRAWTEXT("0.500 (#lv50#)", labelX, lv50) COLOURED(gyR,gyG,gyB)
         DRAWTEXT("0.618 OTE (#lv618#)", labelX, lv618) COLOURED(trR,trG,trB)
         DRAWTEXT("0.705 OTE (#lv705#)", labelX, lv705) COLOURED(trR,trG,trB)
         DRAWTEXT("0.786 OTE (#lv786#)", labelX, lv786) COLOURED(trR,trG,trB)
         DRAWTEXT("1.000 (#lv100#)", labelX, lv100) COLOURED(gyR,gyG,gyB)
      ENDIF
   ENDIF

   IF fibMode = 1 AND showLabels = 1 THEN
      DRAWTEXT("0.000 (#fb0#)", labelX, fb0) COLOURED(gyR,gyG,gyB)
      DRAWTEXT("0.236 (#fb236#)", labelX, fb236) COLOURED(gyR,gyG,gyB)
      DRAWTEXT("0.382 (#fb382#)", labelX, fb382) COLOURED(gyR,gyG,gyB)
      DRAWTEXT("0.500 (#fb50#)", labelX, fb50) COLOURED(gyR,gyG,gyB)
      DRAWTEXT("0.618 OTE (#fb618#)", labelX, fb618) COLOURED(trR,trG,trB)
      DRAWTEXT("0.705 OTE (#fb705#)", labelX, fb705) COLOURED(trR,trG,trB)
      DRAWTEXT("0.786 OTE (#fb786#)", labelX, fb786) COLOURED(trR,trG,trB)
      DRAWTEXT("1.000 ST (#fb100#)", labelX, fb100) COLOURED(gyR,gyG,gyB)
   ENDIF

ENDIF

// ------------------------------------------------------- Plotted series
// The line is cut on the flip bar so it does not draw the vertical jump from
// one side of price to the other. The fill uses its own series collapsed onto
// close on that bar: COLORBETWEEN bridges an undefined hole and would paint a
// vertical band right across the chart on every trend change.
IF barindex <= warmST OR stDir <> stDir[1] THEN
   stPlot = undefined
ELSE
   stPlot = stLine
ENDIF

IF barindex <= warmST OR stDir <> stDir[1] OR fibMode = 1 THEN
   stFill = close
ELSE
   stFill = stLine
ENDIF
COLORBETWEEN(stFill, close, trR, trG, trB, 45)

// OTE zone of the bands mode
COLORBETWEEN(fb618, fb786, trR, trG, trB, 35)

RETURN stPlot AS "Supertrend" COLOURED(trR,trG,trB) STYLE(line,2), fb0 AS "Fib Band 0.000" COLOURED(gyR,gyG,gyB) STYLE(dottedline,1), fb236 AS "Fib Band 0.236" COLOURED(gyR,gyG,gyB) STYLE(dottedline,1), fb382 AS "Fib Band 0.382" COLOURED(gyR,gyG,gyB) STYLE(dottedline,1), fb50 AS "Fib Band 0.500" COLOURED(gyR,gyG,gyB) STYLE(dottedline,1), fb618 AS "Fib Band 0.618 OTE" COLOURED(trR,trG,trB) STYLE(dottedline,1), fb705 AS "Fib Band 0.705 OTE" COLOURED(trR,trG,trB) STYLE(dottedline,1), fb786 AS "Fib Band 0.786 OTE" COLOURED(trR,trG,trB) STYLE(dottedline,1)
The whole grid is repainted from scratch on the last bar rather than kept as eight moving objects, which is why defparam drawonlastbaronly = true is at the top. The visual result is the same, because the grid is discarded and rebuilt on every trend flip anyway.
The trend-coloured candles of the original are not included. The shading between the stop line and the close already carries the same information, and drawing candles bar by bar is incompatible with the last-bar repaint the grid needs.
Settings Worth Touching
Supertrend ATR Period (100) and Multiplier (4.5) decide how often the grid re-anchors, and they are the only settings that change the indicator qualitatively. Halve them and you get a grid that resets every few days — which sounds more responsive and in practice is much worse, because you spend most of the time looking at levels measured on a leg three bars old.
Grid Highlight Distance (1.0 ATR) controls how eagerly a level lights up. On a quiet instrument, 1 ATR can highlight two levels at once. Drop it to 0.5 if you want the highlight to mean “at the level” rather than “near it”.
Max Band ATR Multiplier (2.0) only matters in bands mode. It is the width of the whole channel.
Dim Non-OTE Levels is worth switching on if you only trade the OTE zone. It fades everything else and leaves the shaded band as the visual centre of the chart.
Honest Criticism
The running extreme never retreats. A single spike bar early in a leg permanently widens the grid, and every level stays scaled to a high that the market touched once, for one bar, weeks ago. On instruments with long wicks this drifts the whole grid away from the range that actually mattered. Anchoring on a body extreme instead of the wick would fix it, at the cost of missing genuine breakout extremes.
The grid is only as good as the flip. Everything hangs off the Supertrend direction, so a whipsaw in the stop line does not just cost you one bad signal — it throws away the entire grid and rebuilds it on a leg that may not exist. That is the argument for keeping the ATR period long, and the argument against using this tool on instruments where a 100-period ATR Supertrend flips frequently.
Eight levels is more than anyone uses. The 0.236 and the 0.382 are decoration for a tool built around the OTE zone. They add lines to the chart and do not add decisions. The dimming option exists precisely because the author knew this.
And the thing to be aware of: this indicator has no concept of a failed retracement. It draws the levels and highlights the nearest one whether the trend is healthy or dying. A price sitting on the 0.786 in a trend that is about to flip looks exactly like a price sitting on the 0.786 in a trend that is about to resume. The grid gives you geometry, not confirmation, and it should be paired with something that reads momentum.
Conclusion
The value here is the anchoring, not the ratios. Fibonacci levels are the least interesting part of any Fibonacci tool — what decides whether they are useful is which two points you measure between, and that is exactly the decision this indicator takes out of your hands and makes consistently, bar after bar, with a rule you can inspect.
Use it as a map of the leg you are in. Keep the Supertrend slow. And treat the highlighted level as the question the market is asking right now, not as the answer.