

United Volume ATR Trailing Stop
The United Volume ATR Trailing Stop is an evolution of my original “Another ATR Trailing Stop indicator” published years ago on ProRealCode. While the original version used pure price action to determine when to adjust the trailing stop level, this new version incorporates volume analysis to create a more intelligent stop placement mechanism.
The core idea is simple: instead of adjusting the trailing stop based solely on price making new highs or lows, we use volume-derived momentum to determine when conditions are favorable for tightening the stop.
Evolution from the Original
The original Another ATR Trailing Stop indicator worked by tracking price extremes and placing a stop at a fixed ATR distance. It served well for trend following but had a limitation: it treated all price movements equally regardless of the underlying buying or selling pressure.
This new version addresses that limitation by integrating United Volume analysis. The trailing stop now considers whether buyers or sellers are in control before deciding to adjust its level. This creates a more adaptive stop that respects the actual market dynamics rather than just price geometry.
United Volume Concept
United Volume is a technique that decomposes total bar volume into estimated buying volume and selling volume based on candle structure. The concept recognizes that within any single bar, both buyers and sellers are active, and the candle shape reveals the balance of power.
The calculation considers the full range of the candle (high minus low), the position of the open and close within that range, and how volume likely distributed across the bullish and bearish portions of the bar.
- For green (bullish) candles, the distance from open to low and from high to close represents selling pressure, while the remainder represents buying pressure.
- For red (bearish) candles, the distance from high to open and from close to low represents buying pressure, while the remainder represents selling pressure.
By applying this decomposition and averaging over a short period, we get a smoothed picture of whether buyers or sellers are currently dominant.
How the Indicator Works
The indicator maintains a trailing stop level that follows price at an ATR-based distance. What makes it unique is the condition for adjusting that stop.
- In an uptrend, the stop only tightens (moves higher) when the United Volume spread is declining. This means buying pressure is weakening relative to selling pressure. The logic is that we want to protect profits when momentum is fading, but give the trade room to breathe when buyers are still in control.
- In a downtrend, the stop only tightens (moves lower) when the United Volume spread is rising. This indicates selling pressure is weakening, suggesting we should protect short profits as bearish momentum fades.
Trend reversals occur when price crosses the trailing stop level. At that point, the stop flips to track the opposite direction.
Heiken Ashi Option
The indicator includes an option to calculate United Volume using Heiken Ashi candles instead of standard candles. Heiken Ashi smooths the candle structure which can reduce noise in the volume decomposition. This is particularly useful on lower timeframes or choppy instruments.
Normalization
The spread between buying and selling volume is normalized against its historical maximum over a lookback period. This converts the raw spread into a percentage scale, making the readings comparable across different instruments and timeframes. Without normalization, a high-volume stock would show much larger spread values than a low-volume stock, making the indicator difficult to interpret consistently.
Parameters
- p is the ATR period used to calculate the trailing stop distance. Default is 14.
- mult is the ATR multiplier that determines how far the stop sits from the price extreme. Default is 2. Higher values give the trade more room but reduce protection.
- mode controls the trailing stop behavior on trend changes. When set to 0, the stop appears as a straight line. When set to 1 or higher, the stop jumps to the recent extreme on reversal, then trails from there.
- normPeriod is the lookback period for normalizing the volume spread. Default is 200. Longer periods create more stable normalization but adapt slower to regime changes.
- uperiod is the averaging period for United Volume calculations. Default is 7. Shorter periods make the volume analysis more reactive.
- useAVG enables or disables additional smoothing on the volume spread line. Default is 1 (enabled). Disable for more responsive but noisier signals.
- useHA enables Heiken Ashi candle calculation for volume decomposition. Default is 0 (standard candles).
//PRC_UnitedVol ATR TrailingStop
//10.02.2026
//Nicolas @ www.prorealcode.com
//Sharing ProRealTime knowledge

// --- settings
p=14 //ATR period
mult=2 //multiplier
mode=1 //trailing stop mode (0=straight line)
normPeriod = 200
uperiod = 7
useAVG = 1
useHA = 1
// --- end of settings

atr = AverageTrueRange[p](close) * mult

//united volumes
// calculate acelerate volume
if useHA then
   xClose = (open+high+low+close)/4
   IF BarIndex=0 THEN
      xOpen = open
      xHigh = high
      xLow = low
   ELSe
      xOpen = (xOpen[1] + xClose[1])/2
      xHigh = Max(Max(high, xOpen), xClose)
      xLow = Min(Min(low, xOpen), xClose)
   ENDIF
else
   xclose=close
   xopen=open
   xhigh=high
   xlow=low
endif
//Full Range
a = xhigh-xlow
//Green Candle
b = xopen-xlow
c = xhigh-xclose
//Red Candle
d = xhigh-xopen
e = xclose-xlow
//Unitary volume
volUniBuy    = volume/(a+b+c)
volUniSell   = volume/(a+d+e)
//Volume calculated by candle
VolBuyGreen  = a*volUniBuy
VolBuyRed    = (d+e)*volUniSell
VolSellGreen = (b+c)*volUniBuy
VolSellRed   = a*volUniSell

if close>=open then
   VolBuyGreen = VolBuyRed
   VolSellGreen = 0
else
   VolSellRed = VolSellGreen
   VolBuyRed = 0
endif
//Averages
AverageVolBuy    = Average[uPeriod](VolBuyGreen)
AverageVolSell   = Average[uPeriod](VolSellRed)

//
if barindex>uperiod then
   spread=averagevolbuy-averagevolsell
   maxspread=highest[normPeriod](abs(spread))
   spreadp=abs(spread)/maxspread*100

   if averagevolbuy>averagevolsell then
      spread2=spreadp
   else
      spread2=-spreadp
   endif
endif
if useAVG then
   spreadline=average[uperiod](spread2)
else
   spreadline=spread2
endif

once trend=1

if trend=1 then
   hh=max(hh,close)
   ll=hh
   if spreadline<spreadline[1] then
      hhlevel=hh-atr
      ts=hhlevel
   endif
   r=0
   g=168
else
   ll=min(ll,close)
   hh=ll
   if spreadline>spreadline[1] then
      lllevel=ll+atr
      ts=lllevel
   endif
   r=255
   g=0
endif

if close crosses over ts then
   trend=1
   if mode>0 then
      ts=ll
   endif
elsif close crosses under ts then
   trend=-1
   if mode>0 then
      ts=hh
   endif
endif

//color change
if close crosses over ts then
   r=0
   g=168
elsif close crosses under ts then
   r=255
   g=0
endif

return ts coloured(r,g,0) style(line,3)
Display
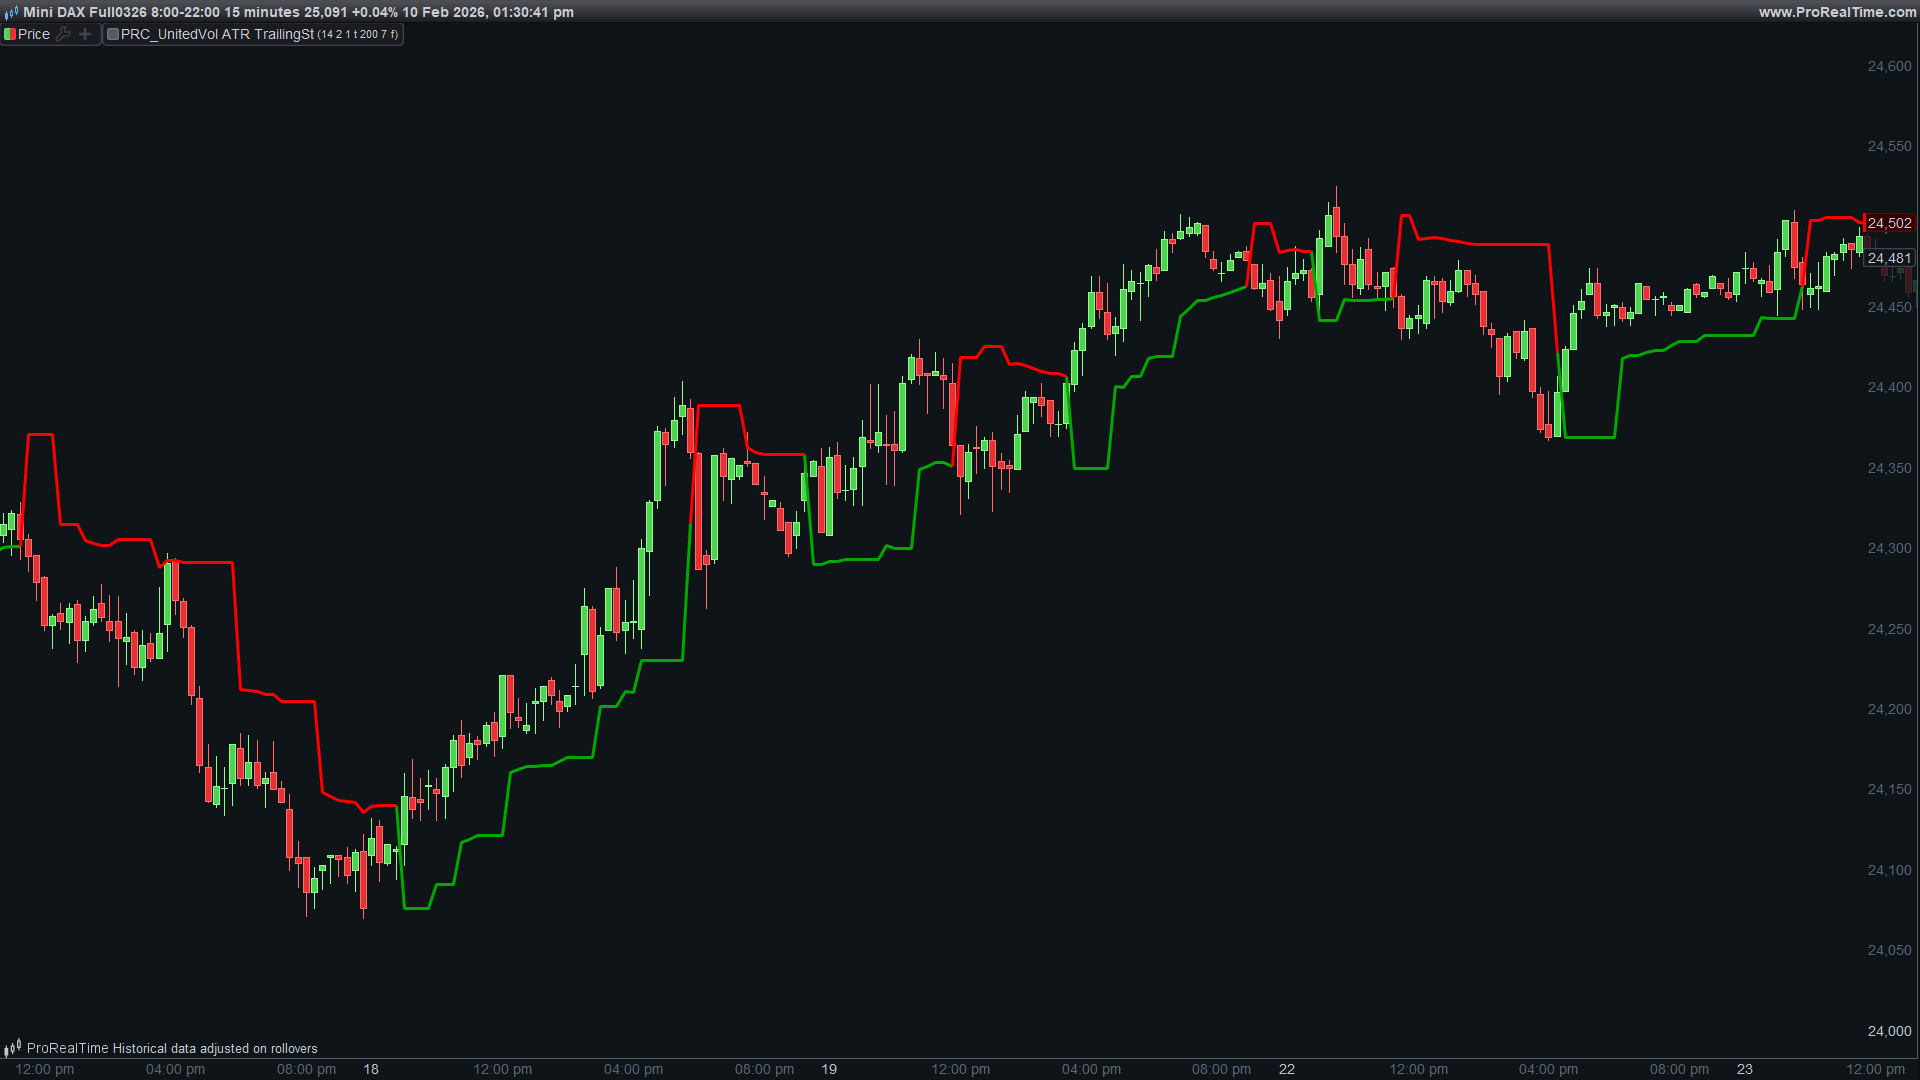
The trailing stop line is colored green during uptrends and red during downtrends. Color changes occur at the moment of trend reversal, providing clear visual feedback when the stop is breached.
Trading Applications
- For trend following, use the trailing stop as your exit mechanism. Enter trades based on your preferred entry signal and let the United Volume ATR Trailing Stop manage the exit. The volume-aware logic helps you stay in trends longer when momentum supports the move.
- For position management, use the stop level to scale out of positions. When the stop tightens due to weakening volume momentum, consider reducing position size rather than waiting for a full stop-out.
- For market analysis, observe how often the stop tightens versus how often price actually reverses. If the stop frequently tightens but price continues, you may need to increase the mult parameter. If price frequently reverses without the stop tightening first, the volume analysis is providing early warning signals.
Comparison to Original Version
The original ATR Trailing Stop adjusted whenever price made a new extreme in the trend direction. This new version is more selective. It only adjusts when volume analysis confirms that momentum is shifting. The result is often a trailing stop that gives winning trades more room while still protecting against genuine reversals.
In strong trends with consistent volume, the new version will trail less aggressively than the original. In weakening trends where volume diverges from price, the new version will tighten faster, potentially capturing more profit before the reversal.
Feedback Welcome
This indicator represents several years of iteration on the trailing stop concept. If you find interesting applications or have suggestions for further enhancements, please share your experience in the comments below.