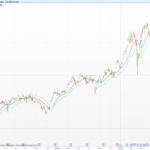
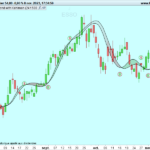
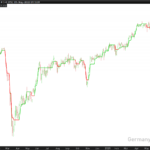
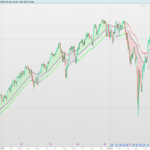
Innovation-Gated Hull Supertrend
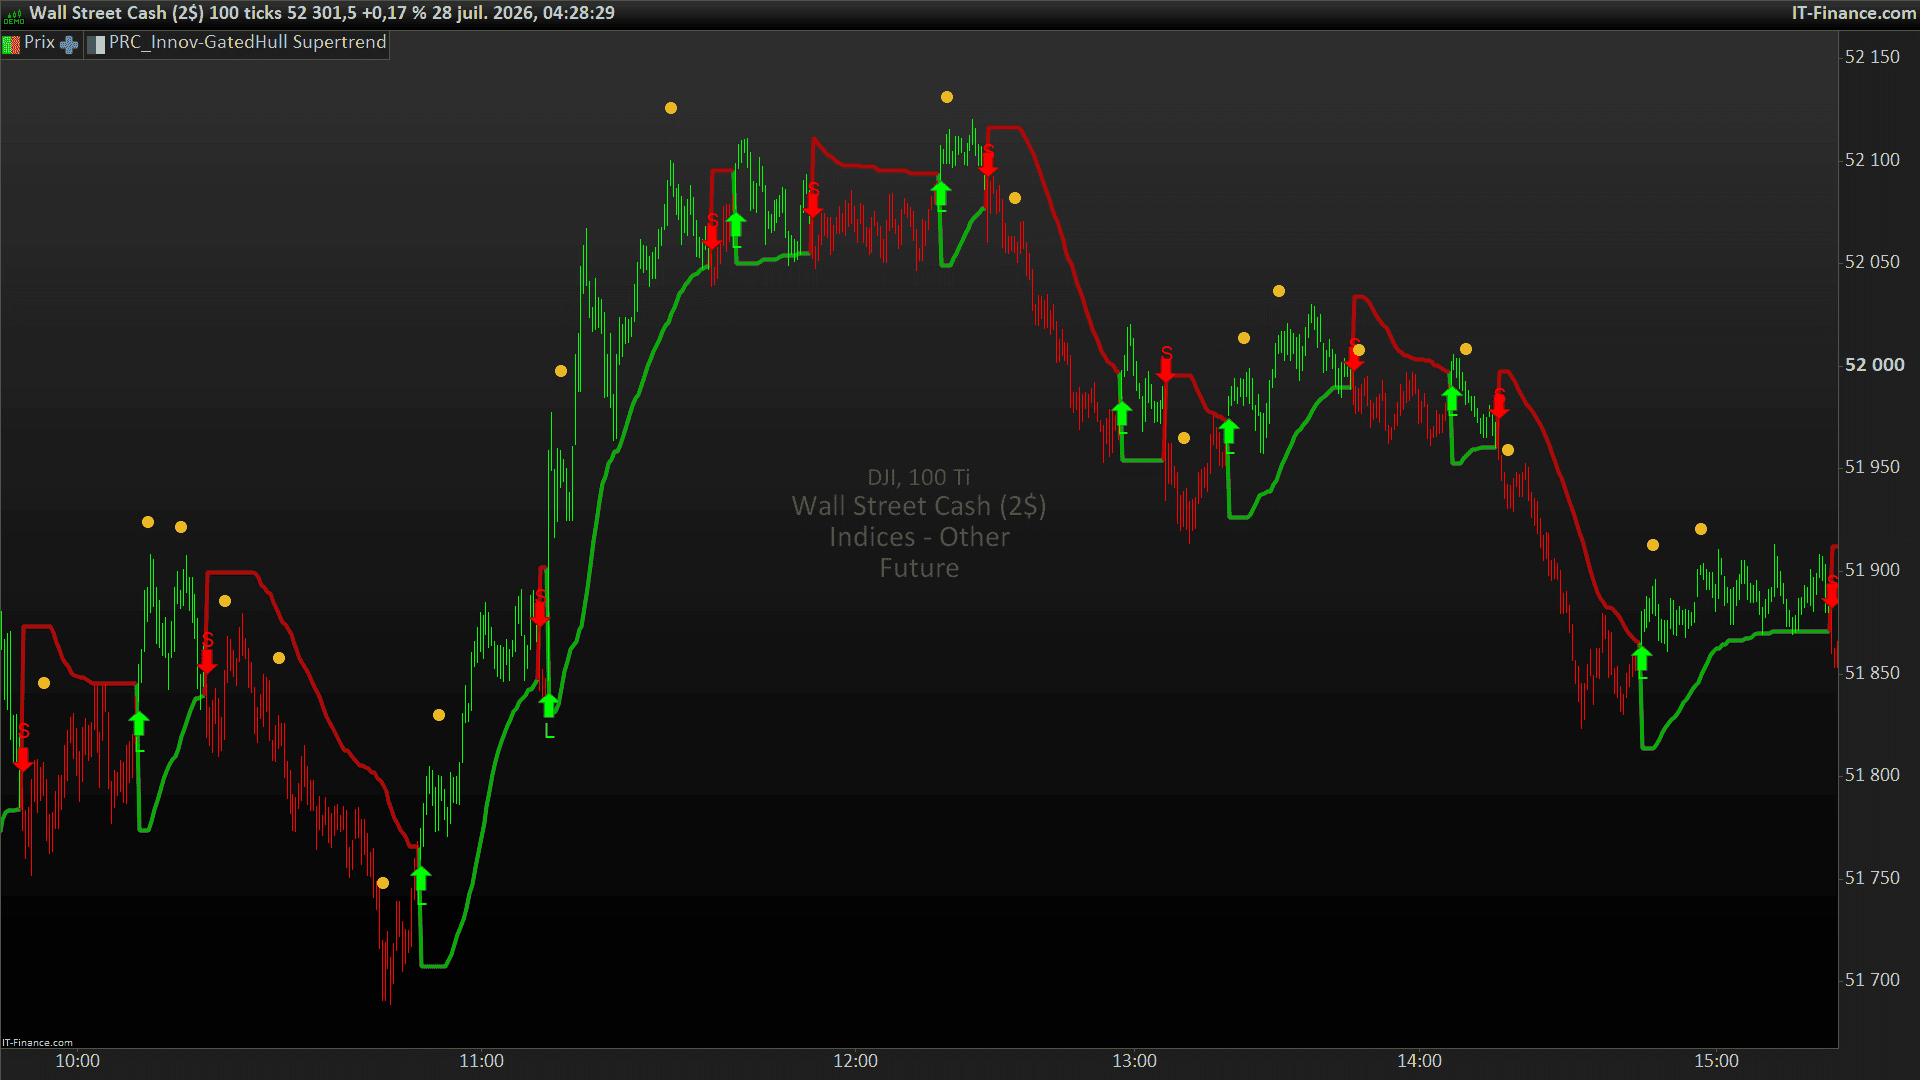
The Innovation-Gated Hull Supertrend is a trend-following overlay that replaces the usual hl2 midline of a Supertrend with a Hull moving average which has first been passed through an adaptive Kalman filter. Rather than smoothing everything by the same amount, the filter measures how far each new Hull reading falls from its own forecast, expresses that distance in units of current volatility, and pushes the result through a logistic gate. When the gate opens the filter trusts the incoming data and tracks price closely; when the gate stays shut it holds its line and lets noise wash over it.
The ATR bands built on top of that filtered line inherit the same gate. During quiet phases the band factor is expanded, pushing the trailing stop further away from price so that ordinary chop cannot reach it; the moment a genuine impulse lifts the gate, the factor contracts back toward its base value and the stop tightens up behind the move. The result is a Supertrend that behaves differently in ranges than it does in trends, without any extra smoothing lag being added to the line itself.
It suits discretionary swing and intraday traders looking for a whipsaw-resistant trailing stop or trend bias filter, and anyone who wants a worked, fully inlined example of a Kalman update written in ProBuilder. Candles are repainted in the trend colour, direction flips are marked with arrows and L/S labels, and each innovation impulse is flagged with an orange dot.
Description
The indicator runs in five stages: a Hull projection, a volatility estimate, the gated Kalman update, an adaptive band factor, and finally the Supertrend itself.
1. Hull projection. The Hull is built by hand from three WeightedAverage calls rather than taken from the built-in HullAverage, because the half-period and root-period here are ROUNDed instead of truncated: hull = WeightedAverage[round(sqrt(len))](2*WeightedAverage[round(len/2)](src) - WeightedAverage[len](src)). On odd lengths that produces a slightly different curve — with the default length of 55 the half period is 28 rather than 27 — so the two are not interchangeable.
2. Volatility base. Two independent readings of dispersion are taken: AverageTrueRange over the candles, and STD — the population standard deviation over N periods, the same measure that underlies Bollinger Bands — applied to the Hull itself. volMode selects ATR alone, StdDev alone, or the 50/50 blend used by default. Each reading is held at zero until its own window has fully formed, so a partial average never reaches the filter, and the final figure is floored at TickSize (the instrument’s smallest price increment) so it can never become a zero divisor.
3. The innovation gate. This is the heart of the indicator. The innovation is the gap between the new Hull reading and the estimate the filter carried into the bar. Divided by current volatility it becomes a dimensionless score: roughly “how many units of normal movement did this surprise us by”. That score is compared against a threshold and pushed through a logistic curve via EXP, giving a gate between 0 and 1. The gate then drives both Kalman noise terms in opposite directions — measurement noise is divided by the admission factor (so the filter believes the new data more) while process noise is multiplied up (so the filter accepts that the underlying level may genuinely have moved). Both effects push the Kalman gain higher exactly when a real move is under way, and let it fall back toward heavy smoothing when nothing is happening.
4. Adaptive bands and the Supertrend. The band factor is baseFact * (1 + qExp * (1 - gate)), so a closed gate inflates it by up to qExp and an open gate returns it to the base value. Bands are placed at that factor times ATR either side of the filtered line, and then locked in the classic Supertrend manner. Note that the band-locking tests and the direction test read the real close, not the filtered value — the filter positions the bands, but price alone decides when they flip.
Key variables:
- hullVal: the raw Hull projection, before any filtering.
- hullWarm: first bar index at which the Hull is fully formed,
safeLen + rootLen - 2; used to gate every downstream calculation. - volSafe: the volatility yardstick the innovation is measured against, floored at one tick.
- kEst / kCov: the filter’s state — current estimate of the level, and its error covariance. Both are self-referencing series that carry across bars.
- kInit: flag marking whether the estimate has ever been set; it replaces a null test on the first usable bar.
- kInnov: the innovation,
hullVal - prediction. - kScore: the innovation normalised by volatility — the quantity the gate actually judges.
- kGate: the logistic gate, 0 (quiet) to 1 (impulse). Its argument is clamped to ±60 before
EXPto keep the exponential in range. - kAdm: admission factor,
aFloor + (1-aFloor)*kGate; the floor guarantees the filter never stops listening entirely. - kGain: the Kalman gain — the fraction of the innovation actually applied to the estimate this bar.
- adaptFact: the volatility-adjusted band multiplier.
- upBand / dnBand / stLine: the locked upper and lower bands and the active Supertrend line.
- stDir: raw direction, +1 when the upper band is active (downtrend), -1 when the lower band is active (uptrend).
- trendVal: latching trend state, +1 long / -1 short, driving all colouring.
The three curves are declared with UNDEFINED and only assigned a value on bars where they should appear. A variable left UNDEFINED is neither drawn nor counted in the chart’s scaling, which is what allows the two hidden curves to be switched off with the display constants without squashing the price axis.
Code
// =============================================================================
// Innovation-Gated Hull Supertrend
// -----------------------------------------------------------------------------
// A Supertrend centred on a Hull moving average that has been passed through an
// adaptive Kalman filter. The filter's noise terms are modulated by a logistic
// "innovation gate", and the same gate widens or tightens the ATR bands.
//
// Every setting is a plain constant in the block below - edit them to retune.
// Apply the indicator on the PRICE chart.
// =============================================================================

// ---- Calculation settings ---------------------------------------------------
pxSrc = customclose // price source
hullLen = 55 // Hull length

// ---- Innovation filter ------------------------------------------------------
volLen = 21 // volatility length
volMode = 2 // volatility model: 0 = ATR, 1 = StdDev, 2 = blend
mNoise = 4.0 // measurement noise
pNoise = 0.03 // process noise
innThr = 0.80 // innovation threshold
gSharp = 4.00 // gate sharpness
aFloor = 0.12 // admission floor
pBoost = 4.00 // process boost

// ---- Supertrend -------------------------------------------------------------
atrLen = 12 // ATR period
baseFact = 1.70 // band factor
adaptOn = 1 // adapt bands with innovation (1 = on, 0 = off)
qExp = 0.35 // quiet band expansion

// ---- Display ----------------------------------------------------------------
showST = 1 // show Supertrend
showFH = 0 // show filtered Hull
showHP = 0 // show raw Hull projection
paintCdl = 1 // paint candles according to trend
showLS = 1 // show long and short signals

longR = 0 // uptrend colour
longG = 255
longB = 0
shortR = 255 // downtrend colour
shortG = 0
shortB = 0
grayR = 120 // neutral colour
grayG = 123
grayB = 134

// =============================================================================
// 1) Hull projection
// hull = WMA( 2*WMA(src, len/2) - WMA(src, len), sqrt(len) )
// The half and root periods are ROUNDed rather than truncated, so this curve
// differs slightly from the built-in HullAverage on odd lengths.
// =============================================================================
safeLen = MAX(hullLen, 1)
halfLen = MAX(ROUND(safeLen * 0.5), 1)
rootLen = MAX(ROUND(SQRT(safeLen)), 1)

fastWma = WeightedAverage[halfLen](pxSrc)
slowWma = WeightedAverage[safeLen](pxSrc)
rawHull = 2.0 * fastWma - slowWma
hullVal = WeightedAverage[rootLen](rawHull)

// First BarIndex at which hullVal is fully formed: (safeLen-1) + (rootLen-1).
hullWarm = safeLen + rootLen - 2

// =============================================================================
// 2) Volatility base - ATR, population StdDev of the Hull, or a blend.
// Both readings are held at 0 until their own warm-up has elapsed so that
// partial windows never feed the filter.
// =============================================================================
IF BarIndex >= volLen - 1 THEN
atrVol = AverageTrueRange[volLen](close)
ELSE
atrVol = 0
ENDIF

IF BarIndex >= hullWarm + volLen - 1 THEN
stdVol = STD[volLen](hullVal)
ELSE
stdVol = 0
ENDIF

IF volMode = 0 THEN
volRaw = atrVol
ELSIF volMode = 1 THEN
volRaw = stdVol
ELSE
volRaw = (atrVol + stdVol) * 0.5
ENDIF

// Floor the volatility at one tick so it can never be a divisor of zero.
volSafe = MAX(volRaw, TickSize)

// =============================================================================
// 3) Innovation-gated Kalman update
// innovation = source - prior estimate
// score = |innovation| / volatility
// gate = logistic( clamp(sharpness*(score-threshold), -60, 60) )
// admission = floor + (1-floor)*gate
// R' = R / admission measurement noise shrinks on impulse
// Q' = Q * (1 + boost*gate) process noise grows on impulse
// K = (P+Q') / (P+Q'+R')
// =============================================================================
mnSafe = MAX(mNoise, TickSize)
pnSafe = MAX(pNoise, TickSize)
thSafe = MAX(innThr, TickSize)
shSafe = MAX(gSharp, TickSize)
flSafe = MIN(MAX(aFloor, TickSize), 1.0)
boSafe = MAX(pBoost, 0.0)

// Is the Hull available on this bar?
IF BarIndex >= hullWarm THEN
srcRdy = 1
ELSE
srcRdy = 0
ENDIF

// Prediction and prior covariance carry over from the previous bar's state.
// kInit is the "has the estimate ever been set" flag.
IF kInit[1] = 1 THEN
prediction = kEst[1]
priorCov = kCov[1]
kInnov = hullVal - prediction
ELSE
prediction = hullVal
priorCov = 1.0
kInnov = 0
ENDIF

kScore = ABS(kInnov) / volSafe
gateIn = MIN(MAX(shSafe * (kScore - thSafe), -60.0), 60.0) // inlined clamp
kGate = 1.0 / (1.0 + EXP(0 - gateIn)) // logistic gate
kAdm = flSafe + (1.0 - flSafe) * kGate

adaptMN = mnSafe / kAdm // measurement noise, shrunk by admission
adaptPN = pnSafe * (1.0 + boSafe * kGate) // process noise, boosted by the gate
predCov = priorCov + adaptPN
kGain = predCov / (predCov + adaptMN)

// The estimate and covariance only move once the Hull exists; the gate, score,
// admission and gain are computed on every bar regardless.
IF srcRdy = 1 THEN
kEst = prediction + kGain * kInnov
kCov = (1.0 - kGain) * predCov
kInit = 1
ELSE
kEst = kEst[1]
kCov = kCov[1]
kInit = 0
ENDIF

// =============================================================================
// 4) Band factor - bands WIDEN when the gate is quiet and tighten on impulses.
// =============================================================================
factSafe = MAX(baseFact, TickSize)
expSafe = MAX(qExp, 0.0)

IF adaptOn = 1 THEN
adaptFact = factSafe * (1.0 + expSafe * (1.0 - kGate))
ELSE
adaptFact = factSafe
ENDIF

// =============================================================================
// 5) Supertrend on the filtered Hull
// =============================================================================
safeAtrLen = MAX(atrLen, 1)
stAtr = AverageTrueRange[safeAtrLen](close)

// First bar on which BOTH the ATR and the filtered Hull exist.
stRdyBar = MAX(hullWarm, safeAtrLen - 1)

IF BarIndex >= stRdyBar THEN
upRaw = kEst + adaptFact * stAtr
dnRaw = kEst - adaptFact * stAtr

// Fall back to the raw band while no previous band exists.
IF BarIndex >= stRdyBar + 1 THEN
pUp = upBand[1]
pDn = dnBand[1]
ELSE
pUp = upRaw
pDn = dnRaw
ENDIF

// Band locking - both tests read the real close[1], not the filtered line.
IF dnRaw > pDn OR close[1] < pDn THEN
dnBand = dnRaw
ELSE
dnBand = pDn
ENDIF

IF upRaw < pUp OR close[1] > pUp THEN
upBand = upRaw
ELSE
upBand = pUp
ENDIF

// Direction: default to 1 on the very first ready bar.
IF BarIndex < stRdyBar + 1 THEN stDir = 1 ELSIF stLine[1] = pUp THEN IF close > upBand THEN
stDir = -1
ELSE
stDir = 1
ENDIF
ELSE
IF close < dnBand THEN stDir = 1 ELSE stDir = -1 ENDIF ENDIF IF stDir = -1 THEN stLine = dnBand ELSE stLine = upBand ENDIF ELSE stDir = 1 // direction stays 1 through warm-up ENDIF // ============================================================================= // 6) Signals and latching trend state // stDir only ever holds +1 or -1, so a cross of zero is an exact flip test. // ============================================================================= IF BarIndex >= 1 THEN
longSig = (stDir CROSSES UNDER 0) // 1 -> -1 : lower band, uptrend
shortSig = (stDir CROSSES OVER 0) // -1 -> 1 : upper band, downtrend
ELSE
longSig = 0
shortSig = 0
ENDIF

impSig = (kScore CROSSES OVER thSafe) // innovation impulse

trendVal = trendVal[1]
IF longSig = 1 AND shortSig = 0 THEN
trendVal = 1
ENDIF
IF shortSig = 1 THEN
trendVal = -1
ENDIF

IF trendVal = 1 THEN
cR = longR
cG = longG
cB = longB
ELSIF trendVal = -1 THEN
cR = shortR
cG = shortG
cB = shortB
ELSE
cR = grayR
cG = grayG
cB = grayB
ENDIF

// =============================================================================
// 7) Output
// UNDEFINED keeps a hidden curve out of the chart and out of the scaling.
// =============================================================================
hullPlot = UNDEFINED
IF showHP = 1 AND BarIndex >= hullWarm THEN
hullPlot = hullVal
ENDIF

fhPlot = UNDEFINED
IF showFH = 1 AND kInit = 1 THEN
fhPlot = kEst
ENDIF

stPlot = UNDEFINED
IF showST = 1 AND BarIndex >= stRdyBar THEN
stPlot = stLine
ENDIF

// Overdraw the candle in the trend colour.
IF paintCdl = 1 THEN
DRAWCANDLE(open, high, low, close) COLOURED(cR, cG, cB) BORDERCOLOR(cR, cG, cB)
ENDIF

sigOff = stAtr * 0.5
IF showLS = 1 AND longSig = 1 THEN
DRAWARROWUP(BarIndex, low - sigOff) COLOURED(cR, cG, cB)
DRAWTEXT("L", BarIndex, low - 2 * sigOff) COLOURED(cR, cG, cB)
ENDIF
IF showLS = 1 AND shortSig = 1 THEN
DRAWARROWDOWN(BarIndex, high + sigOff) COLOURED(cR, cG, cB)
DRAWTEXT("S", BarIndex, high + 2 * sigOff) COLOURED(cR, cG, cB)
ENDIF
IF impSig = 1 THEN
DRAWPOINT(BarIndex, high + 3 * sigOff, 3) COLOURED(255, 200, 0)
ENDIF

RETURN hullPlot COLOURED(grayR, grayG, grayB, 89) STYLE(LINE, 1) AS "Hull Projection", fhPlot COLOURED(255, 255, 255) STYLE(LINE, 2) AS "IGH", stPlot COLOURED(cR, cG, cB, 166) STYLE(LINE, 4) AS "IGH Supertrend"
How to use
Create a new indicator, paste the code, and apply it to the price chart. If it opens in a separate window underneath the chart, drag it onto the price panel — it is designed as an overlay and its values are in price units.
Every setting is a plain constant in the block at the top of the code; edit those to retune and re-apply. What you see on the chart:
- IGH Supertrend — the thick trailing line, green below price in an uptrend, red above price in a downtrend. This is the main output.
- Candle colouring — candles are overdrawn in the current trend colour, so bias is readable at a glance. Set
paintCdl = 0to keep your normal candles. - Arrows and L/S labels — printed on the bar where direction flips. Set
showLS = 0to hide them. - Orange dots — an innovation impulse: the normalised surprise crossed the threshold, meaning the filter has just opened its gate. These often appear a bar or two before a flip and are useful as an early heads-up.
- IGH (white) and Hull Projection (grey) — the filtered line and the raw Hull, both hidden by default. Set
showFH = 1andshowHP = 1to display them; putting the two side by side is the quickest way to see how much work the gate is doing.
Tuning guidance:
- baseFact and atrLen behave exactly as on a normal Supertrend — raise the factor for a looser stop and fewer flips.
- qExp controls how much extra room the bands get when nothing is happening. Raise it if you are still being stopped out inside ranges; set
adaptOn = 0to disable adaptation entirely and compare against a fixed-factor baseline. - innThr and gSharp set where the gate opens and how abruptly. A lower threshold or higher sharpness makes the indicator more reactive and produces more orange dots.
- mNoise and pNoise are the underlying smoothing balance: a high measurement-to-process ratio means a slower, steadier line. Change these last, and one at a time.
Practical use: treat the line as a trailing stop and directional filter rather than a standalone entry trigger. It pairs well with a higher-timeframe trend read — take only the flips that agree with the larger picture — or with a momentum or volume confirmation on the signal bar. Because the direction test reads the closing price, a flip is only final once the bar has closed; intrabar the line can move, so wait for the close before acting on a signal.
Allow for the warm-up: with the default settings nothing is plotted for roughly the first 60 bars while the Hull, the ATR and the filter’s covariance settle. Before trading it, put it on the instrument and timeframe you actually intend to use, check how it handles the recent ranges there, and confirm the flip frequency is one you can live with.