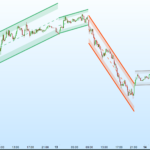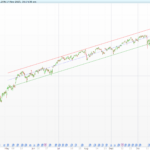






VWAP Price Channel
Introduction
A Donchian channel is the simplest way to mark the range of the last N bars: the highest high and the lowest low. Its weakness is that it moves in steps. After a new high the upper band stays flat until that high leaves the window, and then it jumps, which says little about where the market is actually trading in between.
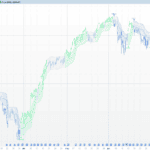
The VWAP Price Channel by SamRecio keeps the Donchian logic for the extremes and lets each band drift with a volume-weighted average anchored at the last extreme. When price makes a new high, the upper band starts there and then follows the VWAP of the highs traded since that bar. The lower band does the same with the lows. The result is a channel that tightens around price as the market moves away from its last extreme, weighted by where the volume was traded.
Theory Behind the Indicator
For a window of N bars (20 by default):
- New high: the bar’s high equals the highest high of the window. The upper band is set to that high, and a VWAP of the highs is anchored at that bar.
- Following bars: the upper band moves by the same amount as that anchored VWAP from one bar to the next. If the highest high of the window has changed (the old high left the window), the band is not allowed to sit above the new highest high.
- Lower band: the mirror image with the lows, an anchored VWAP of the lows and the lowest low of the window as a floor.
The direction of the channel is given by the last extreme: after a new high the market is in an up phase, after a new low in a down phase. The mid line is the average of both bands, and the underlying Donchian channel is available as well.
Key Features at a Glance
- Bands reset to the Donchian extreme on every new high or new low.
- Between extremes, each band follows the change of a VWAP anchored at its last extreme.
- The band is never pushed beyond the current highest high or lowest low.
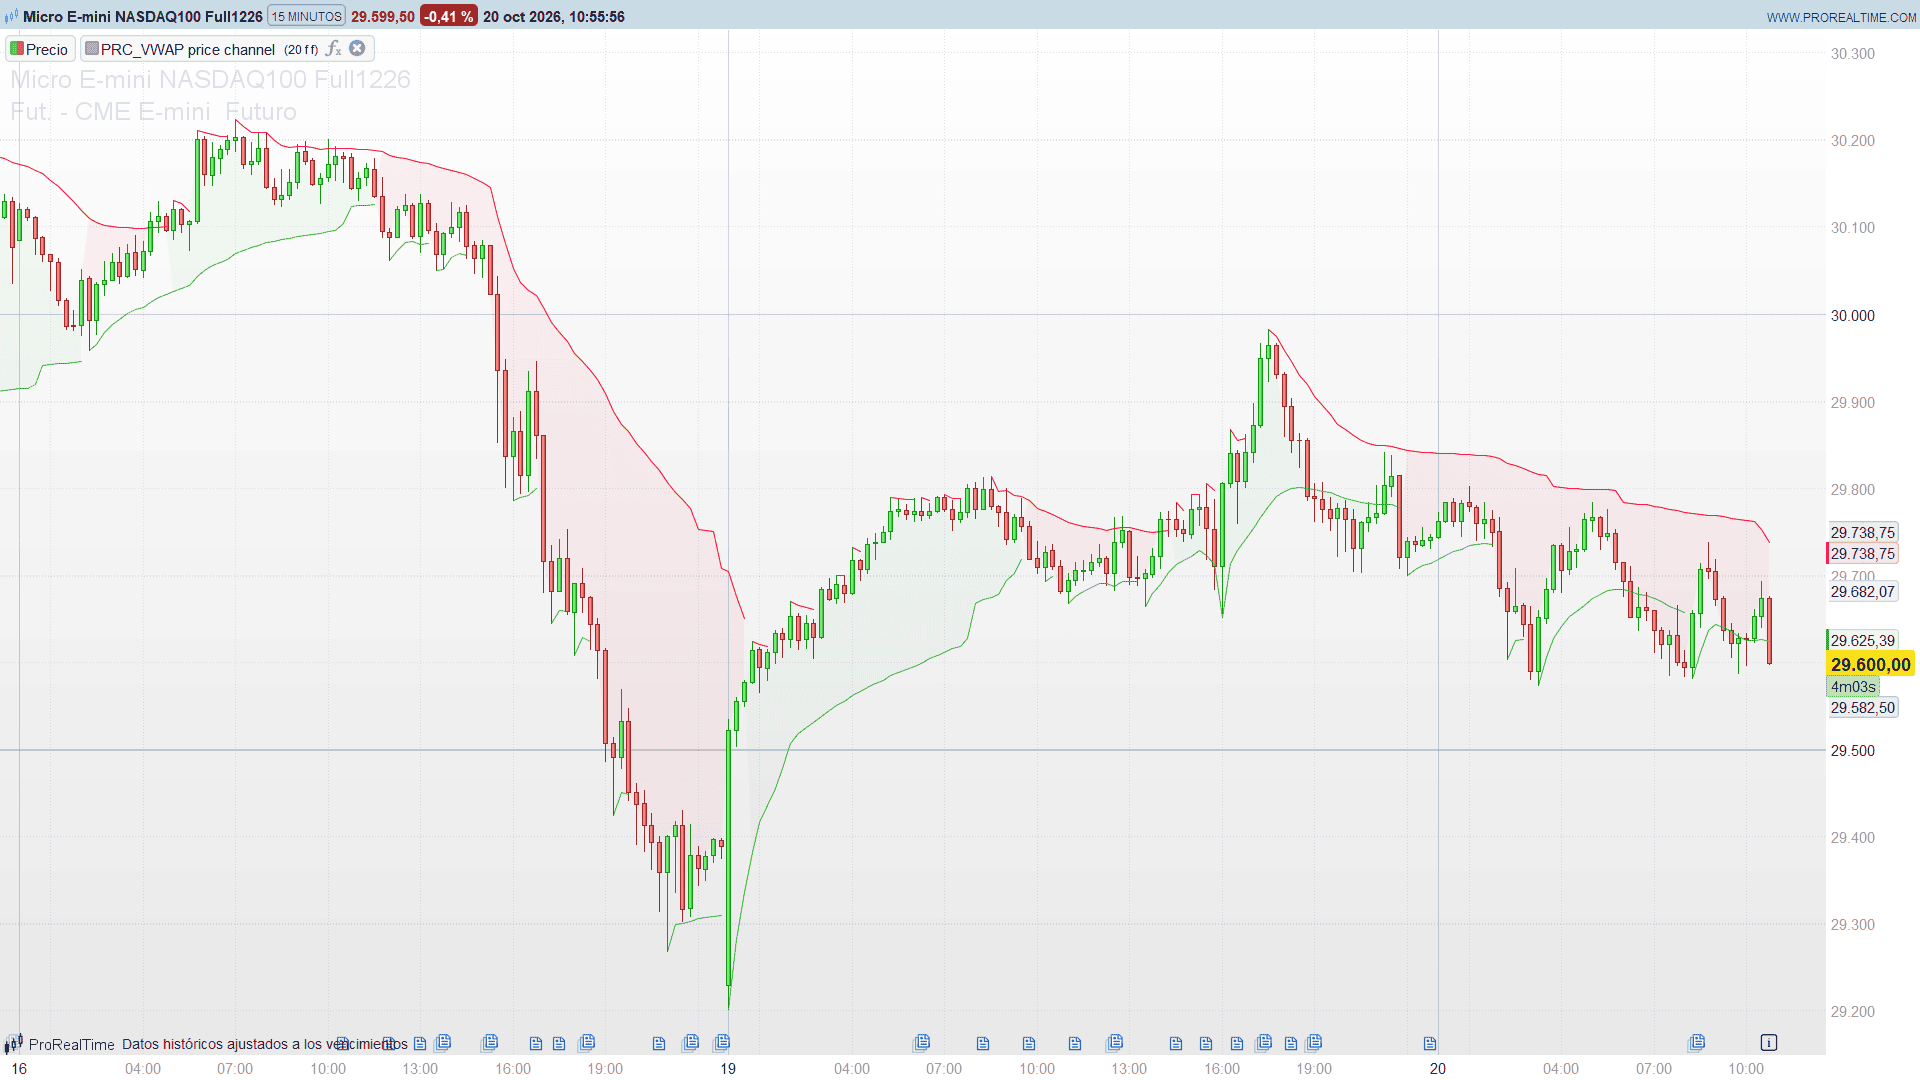
- The band that has just been reset is hidden on that bar, so a new extreme shows as a break in the line.
- Light fill between the opposite band and the close shows the current phase.
- Optional mid line and Donchian channel.
How to Read the Indicator
- Green fill below price: the last extreme was a new high. The lower band acts as the trailing reference of the up phase.
- Red fill above price: the last extreme was a new low. The upper band is the reference of the down phase.
- Break in the red line: a new high on that bar; break in the green line: a new low.
- Bands converging: price is moving away from its extremes and the volume-weighted average follows it, a sign that the range is being repriced.
The bands need volume. On instruments without volume data they only appear on the bars that print a new extreme.
Practical Applications
- Trend phases: the colour of the fill gives a simple up or down state based on the last extreme.
- Trailing reference: in an up phase the green band can serve as a dynamic stop level that adapts to where volume was traded.
- Higher timeframe channel: the code includes a commented TIMEFRAME line to calculate the channel on a higher timeframe and display it on the current chart.
Indicator Configuration
- len (default 20): length of the highest high and lowest low window.
- showMid (default 0): 1 shows the mid line between both bands.
- showDC (default 0): 1 shows the underlying Donchian channel.
- Higher timeframe: uncomment
TIMEFRAME(1 hour, updateonclose)andTIMEFRAME(default)in the code and set the timeframe you need.
The Code
//---------------------------------------------------------------
// PRC_VWAP Price Channel
// version = 0
// 20.10.2026
// Iván González @ www.prorealcode.com
// Author: SamRecio
// Sharing ProRealTime knowledge
//--------------------------------------------------------------------//
// Settings
//--------------------------------------------------------------------//
len = 20           // Length of the highest high / lowest low window
showMid = 0        // 1 = show the mid line
showDC = 0         // 1 = show the Donchian channel (highest high / lowest low)
//--------------------------------------------------------------------//
// Optional higher timeframe: uncomment this line AND the TIMEFRAME(default)
// line before the display block (for example TIMEFRAME(1 hour, updateonclose))
//--------------------------------------------------------------------//
//TIMEFRAME(1 hour, updateonclose)
hst = highest[len](high)
lst = lowest[len](low)
// The window needs len bars before the first new high or new low
isReady = 0
IF barindex >= len - 1 THEN
   isReady = 1
ENDIF
newHigh = 0
newLow = 0
IF isReady = 1 AND high = hst THEN
   newHigh = 1
ENDIF
IF isReady = 1 AND low = lst THEN
   newLow = 1
ENDIF
//--------------------------------------------------------------------//
// VWAP of the highs anchored on every new high, VWAP of the lows anchored
// on every new low
//--------------------------------------------------------------------//
IF newHigh = 1 OR barindex = 0 THEN
   hPV = high * volume
   hVol = volume
ELSE
   hPV = hPV + high * volume
   hVol = hVol + volume
ENDIF
IF newLow = 1 OR barindex = 0 THEN
   lPV = low * volume
   lVol = volume
ELSE
   lPV = lPV + low * volume
   lVol = lVol + volume
ENDIF
// Without volume the VWAP has no value
hOk = 0
hVwap = 0
IF hVol > 0 THEN
   hOk = 1
   hVwap = hPV / hVol
ENDIF
lOk = 0
lVwap = 0
IF lVol > 0 THEN
   lOk = 1
   lVwap = lPV / lVol
ENDIF
//--------------------------------------------------------------------//
// Channel: starts at the new extreme and then follows the change of its
// anchored VWAP, never beyond the current highest high / lowest low
//--------------------------------------------------------------------//
IF newHigh = 1 THEN
   upBand = hst
   upOk = 1
ELSIF upOk[1] = 1 AND hOk = 1 AND hOk[1] = 1 THEN
   IF hst = hst[1] THEN
      upBand = upBand[1] + (hVwap - hVwap[1])
   ELSE
      upBand = min(hst, upBand[1] + (hVwap - hVwap[1]))
   ENDIF
   upOk = 1
ELSE
   upBand = close
   upOk = 0
ENDIF
IF newLow = 1 THEN
   loBand = lst
   loOk = 1
ELSIF loOk[1] = 1 AND lOk = 1 AND lOk[1] = 1 THEN
   IF lst = lst[1] THEN
      loBand = loBand[1] + (lVwap - lVwap[1])
   ELSE
      loBand = max(lst, loBand[1] + (lVwap - lVwap[1]))
   ENDIF
   loOk = 1
ELSE
   loBand = close
   loOk = 0
ENDIF
midOk = 0
midL = close
IF upOk = 1 AND loOk = 1 THEN
   midOk = 1
   midL = (upBand + loBand) / 2
ENDIF
// Trend: dirV marks the bar of the new extreme, dirT keeps the last one
IF newHigh = 1 THEN
   dirV = 1
   dirT = 1
ELSIF newLow = 1 THEN
   dirV = -1
   dirT = -1
ELSE
   dirV = 0
   IF barindex = 0 THEN
      dirT = 0
   ELSE
      dirT = dirT[1]
   ENDIF
ENDIF
//TIMEFRAME(default)
//--------------------------------------------------------------------//
// Display
//--------------------------------------------------------------------//
// The upper band is hidden on the bars that print a new high, the lower band on new lows
uA = 255
IF dirV = 1 OR upOk = 0 THEN
   uA = 0
ENDIF
lA = 255
IF dirV = -1 OR loOk = 0 THEN
   lA = 0
ENDIF
// Fill between each band and the close (alpha 13 = 95% transparent): the upper one
// while the last extreme was a new low, the lower one while it was a new high
uFill = upBand
ufA = 13
IF dirT = 1 OR upOk = 0 THEN
   uFill = close
   ufA = 0
ENDIF
lFill = loBand
lfA = 13
IF dirT = -1 OR loOk = 0 THEN
   lFill = close
   lfA = 0
ENDIF
COLORBETWEEN(uFill, close, 255, 3, 62, ufA)
COLORBETWEEN(lFill, close, 61, 170, 69, lfA)
mA = 0
IF showMid = 1 AND midOk = 1 THEN
   mA = 255
ENDIF
dA = 0
IF showDC = 1 AND isReady = 1 THEN
   dA = 255
ENDIF
RETURN upBand COLOURED(255, 3, 62, uA) AS "Upper", loBand COLOURED(61, 170, 69, lA) AS "Lower", midL COLOURED(120, 123, 134, mA) AS "Mid", hst COLOURED(0, 77, 146, dA) AS "DC Upper", lst COLOURED(0, 77, 146, dA) AS "DC Lower"
Conclusion
The VWAP Price Channel keeps the clarity of a Donchian channel and removes its stair-step behaviour, letting each band follow the volume-weighted price since the last extreme. It gives a clean phase reading and a band that adapts to where the market is really trading.