Dynamic Grid Indicator — A Volatility-Scaled Ladder Around a Hull Baseline
Introduction
Horizontal levels are the oldest tool on a chart and the least portable one. A round number, a pivot, a fixed percentage band — they all describe the market at the moment you drew them, and they all go stale as soon as volatility changes. A one percent band is enormous on a bund future and invisible on a small cap.
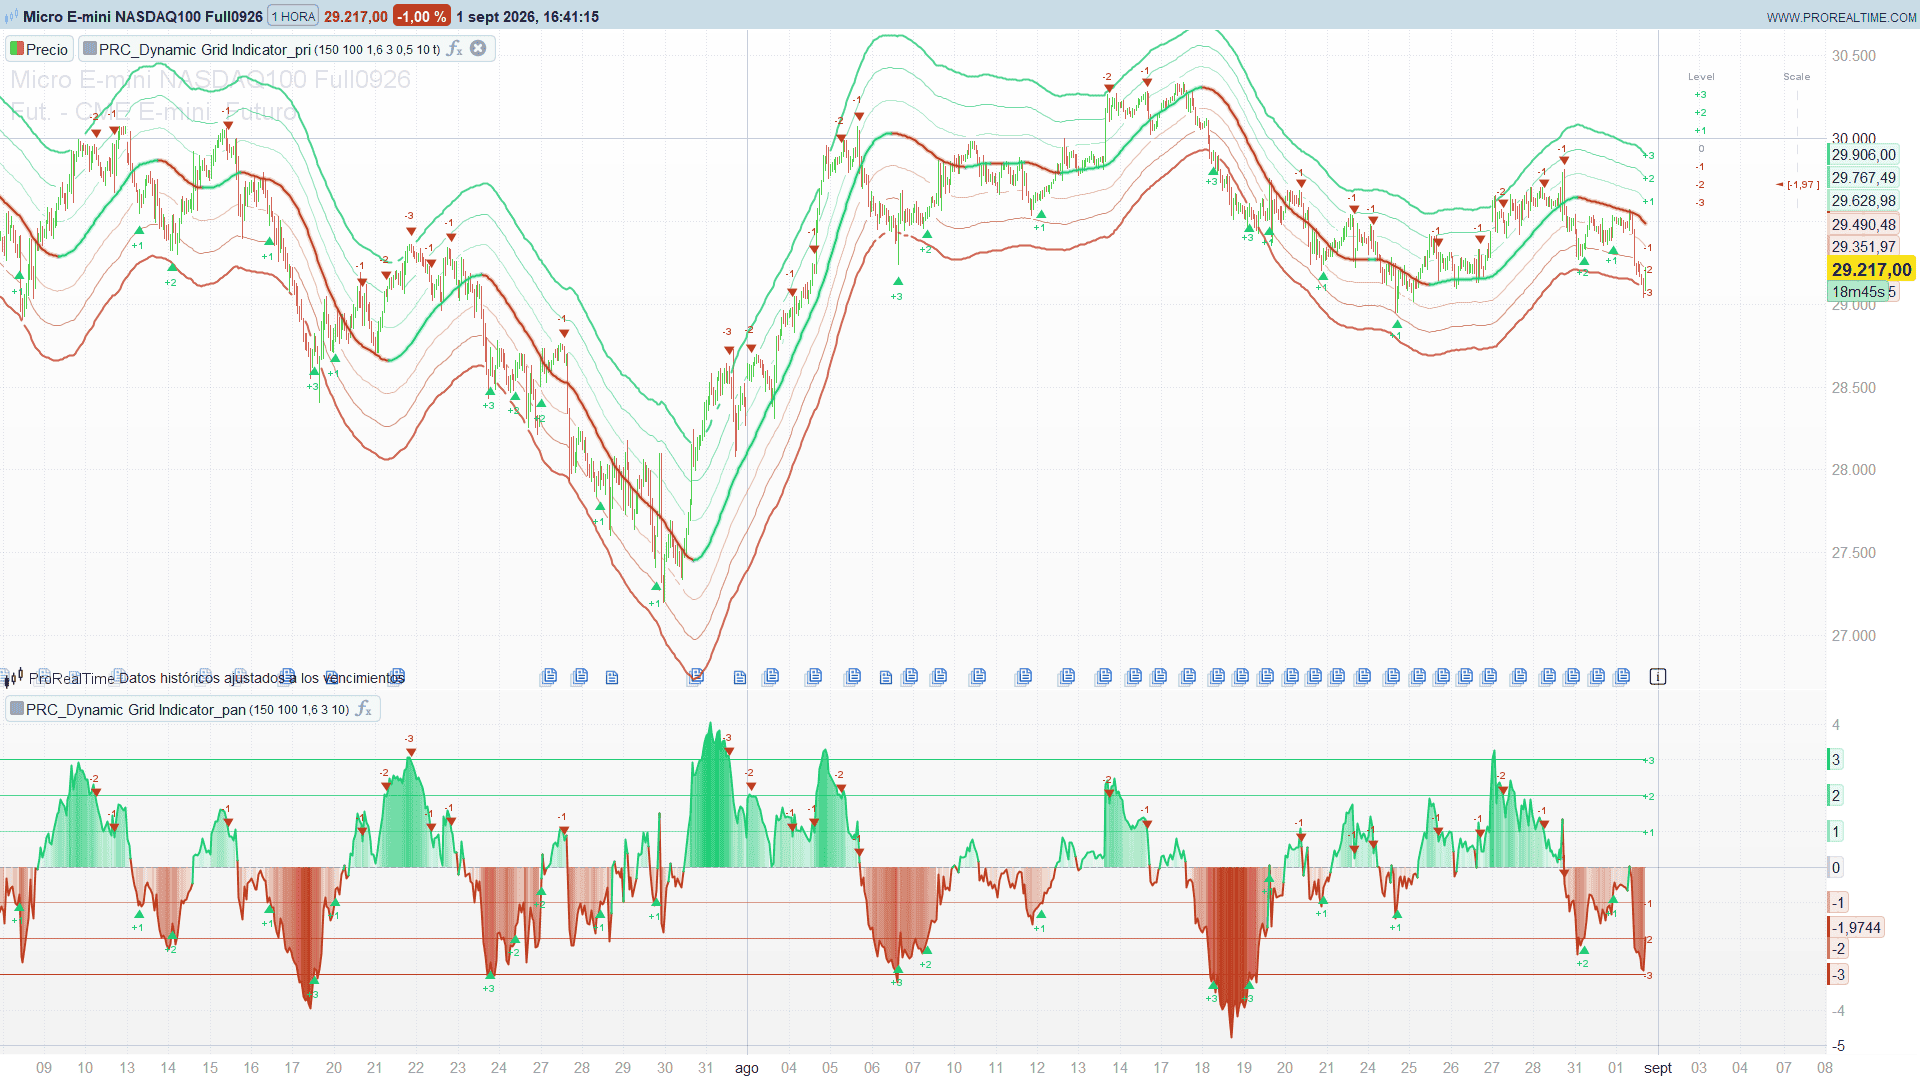
The Dynamic Grid Indicator, designed by BigBeluga, solves that by refusing to measure in price at all. It measures in volatility steps. A Hull moving average becomes the centre of the chart, one step is defined as ATR × multiplier, and a symmetric ladder of up to five rails is projected on each side. The +2 rail is not a price. It is the place that sits two steps of volatility above the baseline, and it moves every bar as both the Hull and the ATR move.
Two things are then built on that ladder, and they are what make the tool worth the space it takes on the chart: a proximity filter that opens the grid where price is standing, and an oscillator that is the very same grid seen from the side.
The Grid Itself
The construction is short enough to write out in full:
baseline = Hull moving average of the close over 150 bars
step     = ATR(100) × 1.6
rail k   = baseline ± k × step        for k = 1 .. 5
The Hull average is the right choice for the centre and not an arbitrary one. A ladder built around a laggy average spends most of its life mispositioned: price reaches the third rail simply because the centre has not caught up yet, not because anything happened. Hull removes most of that lag, so a reading of “three steps out” is closer to a statement about price than about the average.
The step is where the adaptation lives. In a compression the ATR shrinks, the rails close in, and a small move is enough to reach the second one. In an expansion the whole ladder spreads apart and the same absolute move barely leaves the first. The geometry of the chart changes with the regime, which is the behaviour you want and the one a fixed grid cannot have.
The Proximity Filter
Each rail is drawn with an opacity that grows with its distance from the centre — the outer ones are solid, the inner ones faint — and then a second rule is applied on top of it:
distance = the smallest gap between the rail and any of
           close, open, hl2, hlc3, hlcc4 on this bar
if distance ≤ threshold × step   ->   the rail is not drawn on this bar
With the default sensitivity of 0.5, a rail disappears while price is within half a step of it. The effect on a chart is that the ladder stays intact except for the section the market is passing through, which opens.
It is easy to read this as decoration. It is not. It turns every rail into a per-bar binary state — price is here now — and the shape of the gap tells you how the level was met. A short clean notch is a touch and a rejection. A long open corridor is price sitting on the level, working it, neither accepting nor rejecting. That distinction is normally something you squint at; here it is the drawing.
Five reference prices are tested rather than just the close, so a bar that reaches through the rail intra-bar and closes away from it still opens the gap. The filter is about contact, not about settlement.
The Oscillator Is the Same Grid, Flattened
The panel plots one number:
position = (close − baseline) / step
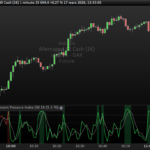
That is the distance from price to the Hull, measured in steps of volatility. And because a step is exactly the spacing of the rails, the horizontal lines at +1, +2, +3 in the panel are the rails on the price chart. The panel is not a second indicator that happens to agree with the first. It is the same picture with the baseline straightened out.
What this buys is comparability. A reading of 2.4 means the same thing on a five-minute index chart and on a daily currency chart: price is two and a bit steps of its own recent volatility above its own baseline. Price levels are not comparable across instruments; this is. It is the same reason a z-score is more useful than a raw deviation, and it is the single most transferable idea in the whole design.
The area between the line and zero is filled, and its density grows with distance from zero, so a glance at the panel gives you the magnitude before you read the axis.
The Signals
A signal fires when the close crosses a rail, and the label tells you which rail:
▲ +k— the close has crossed back up over the lower railk.▼ −k— the close has crossed back down under the upper railk.
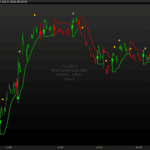
Note the direction carefully, because it decides what kind of tool this is. The bullish mark appears at the bottom of the grid, when price returns from an extension to the downside. The bearish one appears at the top. There is no breakout logic anywhere in the indicator: every signal is a return towards the baseline. This is a mean-reversion instrument that reports re-entries, and treating a ▼ −3 as a short-continuation trigger is reading it backwards.
The number is not cosmetic either. Coming back inside through the first rail is an ordinary oscillation; coming back through the third means price had travelled three steps of volatility away from its own average and gave up. Same direction, very different event, and the label is the only place that distinction is recorded.
Two filters protect the output. A cross is only accepted on a closed bar, so a wick that pierces a rail and retraces before the bar ends never leaves a mark. And a minimum spacing of minGap bars is enforced between consecutive signals, which prevents the cluster of near-duplicates you get whenever price oscillates around a single rail. When several rails are crossed on the same bar, the outermost one names the signal.
The Dashboard
The panel in the top right corner is a vertical ruler of the grid, from +numLevels down to −numLevels, with a marker on the row price currently occupies and the exact reading in brackets. It answers one question — where am I in the ladder right now — without having to read the oscillator’s axis, and the marker clamps to the outermost row you have configured, so it keeps reporting when price leaves the grid entirely.
It is pinned to the window rather than to a price, so it stays put when you pan and zoom.
Two Files
The indicator ships as two ProBuilder files, because the price ladder and the oscillator live in different places on the chart:
PRC_Dynamic-Grid-Indicator— insert it on price. Hull baseline, the rails with the proximity filter, the right-edge level names, the signal arrows and the dashboard.PRC_Dynamic-Grid-Indicator-Panel— insert it in a new panel. The oscillator, its fill, the flattened rails and the same signal marks in step units.
Each one carries its own engine, so they can be used together or separately.
Code — price chart
Insert this one on price.
//----------------------------------------------
//PRC_Dynamic Grid Indicator by BigBeluga
//version = 0
//01.09.2026
//Ivan Gonzalez @ www.prorealcode.com
//Original author: BigBeluga
//Sharing ProRealTime knowledge
//----------------------------------------------
// PRICE CHART side of the indicator -> insert it "on price".
// A Hull baseline plus a symmetric ATR grid: every level sits exactly
// k * (ATR * multiplier) away from the Hull, so the whole ladder breathes
// with volatility instead of being a fixed set of prices.
// A level fades out while price is standing on it (proximity filter) and
// a signal is printed every time the close crosses one of the rails.
// The oscillator pane is a separate file: PRC_Dynamic-Grid-Indicator-Panel.
//----------------------------------------------
DEFPARAM DRAWONLASTBARONLY = TRUE

// === Inputs (expose them as indicator variables) ===
hmaLength  = 150       // Hull period of the central baseline
atrLength  = 100       // ATR period used to size the grid step
atrMult    = 1.6       // ATR multiplier: distance between two levels
numLevels  = 3         // levels drawn on each side (1 to 5)
thresholdP = 0.5       // proximity sensitivity, as a fraction of one step
minGap     = 10        // minimum number of bars between two signals
showDash   = 1         // 1 = draw the position dashboard, 0 = hide it

// Bullish colour (#1ecc75)
bullR = 30
bullG = 204
bullB = 117

// Bearish colour (#c04020)
bearR = 192
bearG = 64
bearB = 32

// Dashboard placement, in pixels from the top right corner of the window
dashX   = -215
dashY   = -45
dashCol = 95           // gap between the "Level" and the "Scale" columns
rowH    = 18           // row height

maxSig  = 200          // ring buffer capacity for the signal marks

// === Core calculations ===
centerLine = average[hmaLength, 7](close)          // 7 = Hull
atrVal     = averagetruerange[atrLength](close) * atrMult
proxDist   = atrVal * thresholdP
warmUp     = max(hmaLength + round(sqrt(hmaLength)) + 5, atrLength + 5)

// Position of price inside the grid, in steps. Only used by the dashboard.
oscV = 0
IF barindex > warmUp AND atrVal > 0 THEN
   oscV = (close - centerLine) / atrVal
ENDIF

// === Dynamic levels ===
upr1 = centerLine + atrVal * 1
lwr1 = centerLine - atrVal * 1
upr2 = centerLine + atrVal * 2
lwr2 = centerLine - atrVal * 2
upr3 = centerLine + atrVal * 3
lwr3 = centerLine - atrVal * 3
upr4 = centerLine + atrVal * 4
lwr4 = centerLine - atrVal * 4
upr5 = centerLine + atrVal * 5
lwr5 = centerLine - atrVal * 5

$gU[1] = upr1
$gU[2] = upr2
$gU[3] = upr3
$gU[4] = upr4
$gU[5] = upr5
$gL[1] = lwr1
$gL[2] = lwr2
$gL[3] = lwr3
$gL[4] = lwr4
$gL[5] = lwr5

// === Opacity of each rail ===
// Two effects stacked:
//   - the further the level, the more opaque it is (38 -> 204)
//   - if any of the five reference prices of the bar is closer than
//     proxDist, the segment is switched off (alpha 0) so the level
//     "opens" and lets the candles through.
pHl2   = (high + low) / 2
pHlc3  = (high + low + close) / 3
pHlcc4 = (high + low + close + close) / 4

FOR k = 1 TO 5 DO
   IF k <= numLevels THEN
      aBase = round(38 + 166 * k / numLevels)

      dU = abs(close - $gU[k])
      dU = min(dU, abs(open - $gU[k]))
      dU = min(dU, abs(pHl2 - $gU[k]))
      dU = min(dU, abs(pHlc3 - $gU[k]))
      dU = min(dU, abs(pHlcc4 - $gU[k]))
      IF dU <= proxDist THEN
         $aU[k] = 0
      ELSE
         $aU[k] = aBase
      ENDIF

      dL = abs(close - $gL[k])
      dL = min(dL, abs(open - $gL[k]))
      dL = min(dL, abs(pHl2 - $gL[k]))
      dL = min(dL, abs(pHlc3 - $gL[k]))
      dL = min(dL, abs(pHlcc4 - $gL[k]))
      IF dL <= proxDist THEN
         $aL[k] = 0
      ELSE
         $aL[k] = aBase
      ENDIF
   ELSE
      $aU[k] = 0
      $aL[k] = 0
   ENDIF
NEXT

aU1 = $aU[1]
aU2 = $aU[2]
aU3 = $aU[3]
aU4 = $aU[4]
aU5 = $aU[5]
aL1 = $aL[1]
aL2 = $aL[2]
aL3 = $aL[3]
aL4 = $aL[4]
aL5 = $aL[5]

// Levels above numLevels are switched off with undefined, not with alpha:
// a transparent series would still stretch the price scale.
IF numLevels >= 1 THEN
   pU1 = upr1
   pL1 = lwr1
ELSE
   pU1 = undefined
   pL1 = undefined
ENDIF
IF numLevels >= 2 THEN
   pU2 = upr2
   pL2 = lwr2
ELSE
   pU2 = undefined
   pL2 = undefined
ENDIF
IF numLevels >= 3 THEN
   pU3 = upr3
   pL3 = lwr3
ELSE
   pU3 = undefined
   pL3 = undefined
ENDIF
IF numLevels >= 4 THEN
   pU4 = upr4
   pL4 = lwr4
ELSE
   pU4 = undefined
   pL4 = undefined
ENDIF
IF numLevels >= 5 THEN
   pU5 = upr5
   pL5 = lwr5
ELSE
   pU5 = undefined
   pL5 = undefined
ENDIF

// === Baseline colour ===
IF centerLine > centerLine[1] THEN
   trR = bullR
   trG = bullG
   trB = bullB
ELSE
   trR = bearR
   trG = bearG
   trB = bearB
ENDIF
glowLine = centerLine

// === Signal engine ===
// A signal is only accepted on a CONFIRMED bar. The $ arrays keep their state
// between ticks, so the engine runs ONCE per bar and reads the last CLOSED bar:
// a cross that shows up and vanishes again inside the live candle can never
// leave a permanent mark behind.
IF barindex = 0 THEN
   $gS[0] = 0 - 1        // last bar already processed
   $gS[1] = 0            // marks stored in the ring buffer
   $gS[2] = 0 - 999      // bar of the last accepted signal
ENDIF

IF barindex > warmUp AND barindex > $gS[0] THEN
   $gS[0] = barindex
   nSig  = $gS[1]
   lastB = $gS[2]

   cA = close[1]
   cB = close[2]

   // Bearish: the close drops back under an upper rail. The outermost
   // rail crossed on that bar is the one that names the signal.
   bearLv = 0
   IF numLevels >= 1 AND cA < upr1[1] AND cB >= upr1[2] THEN
      bearLv = 1
   ENDIF
   IF numLevels >= 2 AND cA < upr2[1] AND cB >= upr2[2] THEN
      bearLv = 2
   ENDIF
   IF numLevels >= 3 AND cA < upr3[1] AND cB >= upr3[2] THEN
      bearLv = 3
   ENDIF
   IF numLevels >= 4 AND cA < upr4[1] AND cB >= upr4[2] THEN
      bearLv = 4
   ENDIF
   IF numLevels >= 5 AND cA < upr5[1] AND cB >= upr5[2] THEN
      bearLv = 5
   ENDIF

   // Bullish: the close climbs back over a lower rail.
   bullLv = 0
   IF numLevels >= 1 AND cA > lwr1[1] AND cB <= lwr1[2] THEN
      bullLv = 1
   ENDIF
   IF numLevels >= 2 AND cA > lwr2[1] AND cB <= lwr2[2] THEN
      bullLv = 2
   ENDIF
   IF numLevels >= 3 AND cA > lwr3[1] AND cB <= lwr3[2] THEN
      bullLv = 3
   ENDIF
   IF numLevels >= 4 AND cA > lwr4[1] AND cB <= lwr4[2] THEN
      bullLv = 4
   ENDIF
   IF numLevels >= 5 AND cA > lwr5[1] AND cB <= lwr5[2] THEN
      bullLv = 5
   ENDIF

   // One single spacing gate shared by both sides.
   sigOn = 0
   IF (bearLv > 0 OR bullLv > 0) AND (barindex - 1 - lastB) >= minGap THEN
      sigOn = 1
      lastB = barindex - 1
   ENDIF

   nPend = 0
   IF sigOn = 1 AND bearLv > 0 THEN
      nPend = nPend + 1
      $pdD[nPend] = 0 - 1
      $pdL[nPend] = bearLv
   ENDIF
   IF sigOn = 1 AND bullLv > 0 THEN
      nPend = nPend + 1
      $pdD[nPend] = 1
      $pdL[nPend] = bullLv
   ENDIF

   // Marks go to a ring buffer and are repainted from it on the last bar,
   // so DRAWONLASTBARONLY can clean the grid labels without erasing history.
   IF nPend > 0 THEN
      FOR p = 1 TO nPend DO
         WHILE nSig >= maxSig DO
            FOR q = 1 TO nSig - 1 DO
               $sgX[q] = $sgX[q+1]
               $sgY[q] = $sgY[q+1]
               $sgT[q] = $sgT[q+1]
               $sgD[q] = $sgD[q+1]
               $sgL[q] = $sgL[q+1]
            NEXT
            nSig = nSig - 1
         WEND
         nSig = nSig + 1
         $sgX[nSig] = barindex - 1
         $sgD[nSig] = $pdD[p]
         $sgL[nSig] = $pdL[p]
         // The Y of a mark is frozen on its own bar, never read at repaint time.
         IF $pdD[p] = 1 THEN
            $sgY[nSig] = low[1] - 0.45 * atrVal
            $sgT[nSig] = low[1] - 0.95 * atrVal
         ELSE
            $sgY[nSig] = high[1] + 0.45 * atrVal
            $sgT[nSig] = high[1] + 0.95 * atrVal
         ENDIF
      NEXT
   ENDIF

   $gS[1] = nSig
   $gS[2] = lastB
ENDIF

// === Drawing ===
IF islastbarupdate THEN
   nDraw = $gS[1]

   // Signal marks, repainted from the ring buffer
   IF nDraw > 0 THEN
      FOR i = 1 TO nDraw DO
         mkX = $sgX[i]
         mkY = $sgY[i]
         mkT = $sgT[i]
         mkL = $sgL[i]
         IF $sgD[i] = 1 THEN
            DRAWTEXT("▲", mkX, mkY, sansserif, bold, 12) COLOURED(bullR, bullG, bullB, 255)
            DRAWTEXT("+#mkL#", mkX, mkT, sansserif, bold, 10) COLOURED(bullR, bullG, bullB, 255)
         ELSE
            DRAWTEXT("▼", mkX, mkY, sansserif, bold, 12) COLOURED(bearR, bearG, bearB, 255)
            DRAWTEXT("-#mkL#", mkX, mkT, sansserif, bold, 10) COLOURED(bearR, bearG, bearB, 255)
         ENDIF
      NEXT
   ENDIF

   // Right edge level names
   xLbl = barindex + 3
   FOR k = 1 TO numLevels DO
      lbK = k
      DRAWTEXT("+#lbK#", xLbl, $gU[k], sansserif, bold, 10) COLOURED(bullR, bullG, bullB, 255)
      DRAWTEXT("-#lbK#", xLbl, $gL[k], sansserif, bold, 10) COLOURED(bearR, bearG, bearB, 255)
   NEXT

   // Position dashboard, pinned to the window instead of to a price
   IF showDash = 1 THEN
      oscShow = round(oscV * 100) / 100
      nlNeg   = 0 - numLevels

      DRAWTEXT("Level", dashX, dashY, sansserif, bold, 10) COLOURED(150, 150, 150, 255) ANCHOR(topright, xshift, yshift)
      DRAWTEXT("Scale", dashX + dashCol, dashY, sansserif, bold, 10) COLOURED(150, 150, 150, 255) ANCHOR(topright, xshift, yshift)

      rowN = 0
      FOR i = numLevels DOWNTO nlNeg DO
         rowN = rowN + 1
         rowY = dashY - rowN * rowH
         lvI  = i

         IF i > 0 THEN
            DRAWTEXT("+#lvI#", dashX, rowY, sansserif, bold, 10) COLOURED(bullR, bullG, bullB, 255) ANCHOR(topright, xshift, yshift)
         ELSIF i < 0 THEN
            DRAWTEXT("#lvI#", dashX, rowY, sansserif, bold, 10) COLOURED(bearR, bearG, bearB, 255) ANCHOR(topright, xshift, yshift)
         ELSE
            DRAWTEXT("0", dashX, rowY, sansserif, bold, 10) COLOURED(150, 150, 150, 255) ANCHOR(topright, xshift, yshift)
         ENDIF

         // The row that holds the current reading. The marker clamps to the
         // outermost row in use, so the readout keeps working when price walks
         // out of the grid.
         isCur = 0
         IF round(oscV) = i THEN
            isCur = 1
         ENDIF
         IF i = numLevels AND oscV >= numLevels THEN
            isCur = 1
         ENDIF
         IF i = nlNeg AND oscV <= nlNeg THEN
            isCur = 1
         ENDIF

         IF isCur = 1 THEN
            IF oscV >= 0 THEN
               mkR = bullR
               mkG = bullG
               mkB = bullB
            ELSE
               mkR = bearR
               mkG = bearG
               mkB = bearB
            ENDIF
            DRAWTEXT("◄ [#oscShow#]", dashX + dashCol, rowY, sansserif, bold, 10) COLOURED(mkR, mkG, mkB, 255) ANCHOR(topright, xshift, yshift)
         ELSE
            DRAWTEXT("│", dashX + dashCol, rowY, sansserif, standard, 10) COLOURED(150, 150, 150, 102) ANCHOR(topright, xshift, yshift)
         ENDIF
      NEXT
   ENDIF
ENDIF

RETURN glowLine AS "Hull glow" COLOURED(trR, trG, trB, 51) STYLE(line, 5), centerLine AS "Hull baseline" COLOURED(trR, trG, trB, 255) STYLE(line, 2), pU1 AS "+1" COLOURED(bullR, bullG, bullB, aU1) STYLE(line, 1), pL1 AS "-1" COLOURED(bearR, bearG, bearB, aL1) STYLE(line, 1), pU2 AS "+2" COLOURED(bullR, bullG, bullB, aU2) STYLE(line, 1), pL2 AS "-2" COLOURED(bearR, bearG, bearB, aL2) STYLE(line, 1), pU3 AS "+3" COLOURED(bullR, bullG, bullB, aU3) STYLE(line, 2), pL3 AS "-3" COLOURED(bearR, bearG, bearB, aL3) STYLE(line, 2), pU4 AS "+4" COLOURED(bullR, bullG, bullB, aU4) STYLE(line, 2), pL4 AS "-4" COLOURED(bearR, bearG, bearB, aL4) STYLE(line, 2), pU5 AS "+5" COLOURED(bullR, bullG, bullB, aU5) STYLE(line, 2), pL5 AS "-5" COLOURED(bearR, bearG, bearB, aL5) STYLE(line, 2)
Code — oscillator panel
Insert this one in a new panel.
//----------------------------------------------
//PRC_Dynamic Grid Indicator by BigBeluga (panel)
//version = 0
//01.09.2026
//Ivan Gonzalez @ www.prorealcode.com
//Original author: BigBeluga
//Sharing ProRealTime knowledge
//----------------------------------------------
// OSCILLATOR side of the indicator -> insert it in a NEW PANEL.
// It plots the very same grid, but normalised: the distance from price to the
// Hull baseline measured in grid steps. The +1/-1 ... +5/-5 horizontal lines
// ARE the rails of the price chart, flattened. Reading 2.4 means price sits
// 2.4 steps above the baseline, whatever the instrument or the volatility.
// The price chart side is a separate file: PRC_Dynamic-Grid-Indicator.
//----------------------------------------------
DEFPARAM DRAWONLASTBARONLY = TRUE

// === Inputs (expose them as indicator variables) ===
hmaLength  = 150       // Hull period of the central baseline
atrLength  = 100       // ATR period used to size the grid step
atrMult    = 1.6       // ATR multiplier: distance between two levels
numLevels  = 3         // levels drawn on each side (1 to 5)
minGap     = 10        // minimum number of bars between two signals

// Bullish colour (#1ecc75)
bullR = 30
bullG = 204
bullB = 117

// Bearish colour (#c04020)
bearR = 192
bearG = 64
bearB = 32

maxSig = 200           // ring buffer capacity for the signal marks

// === Core calculations ===
centerLine = average[hmaLength, 7](close)          // 7 = Hull
atrVal     = averagetruerange[atrLength](close) * atrMult
warmUp     = max(hmaLength + round(sqrt(hmaLength)) + 5, atrLength + 5)

oscOn  = 0
oscRaw = 0
IF barindex > warmUp AND atrVal > 0 THEN
   oscRaw = (close - centerLine) / atrVal
   oscOn  = 1
ENDIF

IF oscOn = 1 THEN
   oscV = oscRaw
ELSE
   oscV = undefined
ENDIF

zeroLn = 0            // reference curve for the fill (plotted below as a literal)

// === Levels of the grid, seen from the oscillator ===
// Same opacity ramp as on the price chart, only stronger: the further the
// level, the more opaque (51 -> 255). No proximity filter here: in the panel
// the rails never sit on top of the candles.
FOR k = 1 TO 5 DO
   IF k <= numLevels THEN
      $aO[k] = round(51 + 204 * k / numLevels)
   ELSE
      $aO[k] = 0
   ENDIF
NEXT

aO1 = $aO[1]
aO2 = $aO[2]
aO3 = $aO[3]
aO4 = $aO[4]
aO5 = $aO[5]

IF numLevels >= 1 THEN
   pO1 = 1
   pD1 = 0 - 1
ELSE
   pO1 = undefined
   pD1 = undefined
ENDIF
IF numLevels >= 2 THEN
   pO2 = 2
   pD2 = 0 - 2
ELSE
   pO2 = undefined
   pD2 = undefined
ENDIF
IF numLevels >= 3 THEN
   pO3 = 3
   pD3 = 0 - 3
ELSE
   pO3 = undefined
   pD3 = undefined
ENDIF
IF numLevels >= 4 THEN
   pO4 = 4
   pD4 = 0 - 4
ELSE
   pO4 = undefined
   pD4 = undefined
ENDIF
IF numLevels >= 5 THEN
   pO5 = 5
   pD5 = 0 - 5
ELSE
   pO5 = undefined
   pD5 = undefined
ENDIF

// === Oscillator line and fill ===
IF oscRaw >= 0 THEN
   fR = bullR
   fG = bullG
   fB = bullB
ELSE
   fR = bearR
   fG = bearG
   fB = bearB
ENDIF

// The density of the fill carries the magnitude: the further the oscillator
// sits from the zero line, the more opaque the band, saturating at +/-4 steps.
IF oscOn = 1 THEN
   fillSrc = oscRaw
   aFill   = round(255 * min(abs(oscRaw) / 4, 1))
ELSE
   fillSrc = 0
   aFill   = 0
ENDIF
COLORBETWEEN(fillSrc, zeroLn, fR, fG, fB, aFill)

// === Signal engine ===
// Same engine as the price chart file: one pass per bar, on the last CLOSED
// bar, with the marks kept in a ring buffer so they survive DRAWONLASTBARONLY.
IF barindex = 0 THEN
   $gS[0] = 0 - 1        // last bar already processed
   $gS[1] = 0            // marks stored in the ring buffer
   $gS[2] = 0 - 999      // bar of the last accepted signal
ENDIF

upr1 = centerLine + atrVal * 1
lwr1 = centerLine - atrVal * 1
upr2 = centerLine + atrVal * 2
lwr2 = centerLine - atrVal * 2
upr3 = centerLine + atrVal * 3
lwr3 = centerLine - atrVal * 3
upr4 = centerLine + atrVal * 4
lwr4 = centerLine - atrVal * 4
upr5 = centerLine + atrVal * 5
lwr5 = centerLine - atrVal * 5

IF barindex > warmUp AND barindex > $gS[0] THEN
   $gS[0] = barindex
   nSig  = $gS[1]
   lastB = $gS[2]

   cA = close[1]
   cB = close[2]

   bearLv = 0
   IF numLevels >= 1 AND cA < upr1[1] AND cB >= upr1[2] THEN
      bearLv = 1
   ENDIF
   IF numLevels >= 2 AND cA < upr2[1] AND cB >= upr2[2] THEN
      bearLv = 2
   ENDIF
   IF numLevels >= 3 AND cA < upr3[1] AND cB >= upr3[2] THEN
      bearLv = 3
   ENDIF
   IF numLevels >= 4 AND cA < upr4[1] AND cB >= upr4[2] THEN
      bearLv = 4
   ENDIF
   IF numLevels >= 5 AND cA < upr5[1] AND cB >= upr5[2] THEN
      bearLv = 5
   ENDIF

   bullLv = 0
   IF numLevels >= 1 AND cA > lwr1[1] AND cB <= lwr1[2] THEN
      bullLv = 1
   ENDIF
   IF numLevels >= 2 AND cA > lwr2[1] AND cB <= lwr2[2] THEN
      bullLv = 2
   ENDIF
   IF numLevels >= 3 AND cA > lwr3[1] AND cB <= lwr3[2] THEN
      bullLv = 3
   ENDIF
   IF numLevels >= 4 AND cA > lwr4[1] AND cB <= lwr4[2] THEN
      bullLv = 4
   ENDIF
   IF numLevels >= 5 AND cA > lwr5[1] AND cB <= lwr5[2] THEN
      bullLv = 5
   ENDIF

   sigOn = 0
   IF (bearLv > 0 OR bullLv > 0) AND (barindex - 1 - lastB) >= minGap THEN
      sigOn = 1
      lastB = barindex - 1
   ENDIF

   nPend = 0
   IF sigOn = 1 AND bearLv > 0 THEN
      nPend = nPend + 1
      $pdD[nPend] = 0 - 1
      $pdL[nPend] = bearLv
   ENDIF
   IF sigOn = 1 AND bullLv > 0 THEN
      nPend = nPend + 1
      $pdD[nPend] = 1
      $pdL[nPend] = bullLv
   ENDIF

   IF nPend > 0 THEN
      FOR p = 1 TO nPend DO
         WHILE nSig >= maxSig DO
            FOR q = 1 TO nSig - 1 DO
               $sgX[q] = $sgX[q+1]
               $sgY[q] = $sgY[q+1]
               $sgT[q] = $sgT[q+1]
               $sgD[q] = $sgD[q+1]
               $sgL[q] = $sgL[q+1]
            NEXT
            nSig = nSig - 1
         WEND
         nSig = nSig + 1
         $sgX[nSig] = barindex - 1
         $sgD[nSig] = $pdD[p]
         $sgL[nSig] = $pdL[p]
         // Y frozen on the event bar, in oscillator units
         IF $pdD[p] = 1 THEN
            $sgY[nSig] = oscRaw[1] - 0.30
            $sgT[nSig] = oscRaw[1] - 0.70
         ELSE
            $sgY[nSig] = oscRaw[1] + 0.30
            $sgT[nSig] = oscRaw[1] + 0.70
         ENDIF
      NEXT
   ENDIF

   $gS[1] = nSig
   $gS[2] = lastB
ENDIF

// === Drawing ===
IF islastbarupdate THEN
   nDraw = $gS[1]

   IF nDraw > 0 THEN
      FOR i = 1 TO nDraw DO
         mkX = $sgX[i]
         mkY = $sgY[i]
         mkT = $sgT[i]
         mkL = $sgL[i]
         IF $sgD[i] = 1 THEN
            DRAWTEXT("▲", mkX, mkY, sansserif, bold, 12) COLOURED(bullR, bullG, bullB, 255)
            DRAWTEXT("+#mkL#", mkX, mkT, sansserif, bold, 10) COLOURED(bullR, bullG, bullB, 255)
         ELSE
            DRAWTEXT("▼", mkX, mkY, sansserif, bold, 12) COLOURED(bearR, bearG, bearB, 255)
            DRAWTEXT("-#mkL#", mkX, mkT, sansserif, bold, 10) COLOURED(bearR, bearG, bearB, 255)
         ENDIF
      NEXT
   ENDIF

   xLbl = barindex + 3
   FOR k = 1 TO numLevels DO
      lbK = k
      lbN = 0 - k
      DRAWTEXT("+#lbK#", xLbl, lbK, sansserif, bold, 10) COLOURED(bullR, bullG, bullB, 255)
      DRAWTEXT("#lbN#", xLbl, lbN, sansserif, bold, 10) COLOURED(bearR, bearG, bearB, 255)
   NEXT
ENDIF

RETURN 0 AS "Zero" COLOURED(150, 150, 150, 128) STYLE(dottedline, 1), pO1 AS "+1" COLOURED(bullR, bullG, bullB, aO1) STYLE(line, 1), pD1 AS "-1" COLOURED(bearR, bearG, bearB, aO1) STYLE(line, 1), pO2 AS "+2" COLOURED(bullR, bullG, bullB, aO2) STYLE(line, 1), pD2 AS "-2" COLOURED(bearR, bearG, bearB, aO2) STYLE(line, 1), pO3 AS "+3" COLOURED(bullR, bullG, bullB, aO3) STYLE(line, 1), pD3 AS "-3" COLOURED(bearR, bearG, bearB, aO3) STYLE(line, 1), pO4 AS "+4" COLOURED(bullR, bullG, bullB, aO4) STYLE(line, 1), pD4 AS "-4" COLOURED(bearR, bearG, bearB, aO4) STYLE(line, 1), pO5 AS "+5" COLOURED(bullR, bullG, bullB, aO5) STYLE(line, 1), pD5 AS "-5" COLOURED(bearR, bearG, bearB, aO5) STYLE(line, 1), oscV AS "Grid oscillator" COLOURED(fR, fG, fB, 255) STYLE(line, 2)
Settings
hmaLength (150) — the period of the Hull baseline. This is the parameter that decides what “away from the average” means. Shortening it makes the centre chase price, which compresses the readings towards zero and thins out the signals; lengthening it turns the baseline into a slow anchor and lets the oscillator reach much larger values.
atrLength (100) and atrMult (1.6) — together they define one step. The long ATR is deliberate: a short one would make the ladder react to the same bars that are supposed to be measured against it, and the grid would breathe in time with the noise. The multiplier is the real dial — raise it and the rails move out, signals become rarer and each one means more.
numLevels (3) — rails on each side, from 1 to 5. Three is a sensible default on intraday charts; five is worth having on instruments that trend hard, where the outer rails actually get visited.
thresholdP (0.5) — proximity sensitivity, as a fraction of one step. Lower it to 0.2 and the rails only open on a real touch; raise it towards 1.0 and the grid spends most of its time with a hole in it.
minGap (10) — minimum bars between two signals. On a fast chart this is the difference between a readable set of marks and a wall of them.
showDash (1) and dashX / dashY / dashCol / rowH — the dashboard and its placement, in pixels from the top right corner of the window. Move it with dashY.
bullR/G/B and bearR/G/B — the two colours, used for the rails, the baseline, the oscillator and the marks.
Notes and Limitations
The signals lag one bar. The engine works on the last closed bar, which is what makes a mark permanent once it appears: nothing that happens inside the live candle can create or destroy one. The price you would trade at is the open of the following bar, not the close of the crossing bar, and any evaluation of the tool should use that.
A returning signal is not a reversal. The mark says price has come back inside the ladder. Whether it keeps going towards the baseline, stalls at the next rail, or turns around and leaves again is not something the indicator claims to know. In a strong trend the grid is crossed repeatedly on the way out, and every one of those crossings on the far side produces a countertrend mark that goes nowhere. A trend filter of your own — the slope of the baseline is already computed and colours it — is what separates the two situations.
The grid needs its warm-up. With the defaults, nothing is valid before roughly bar 168, the time the Hull and the ATR need to produce meaningful values.
A reading beyond ±4 is rare and worth respecting. Because the step already scales with volatility, getting four steps away from a Hull baseline means the move is fast relative to the very volatility it is generating. Those readings are where the tool is most informative, and also where the mean-reversion assumption is most likely to be wrong.
The signal history is capped at 200 marks, which on any normal chart is more than fits on screen.
Conclusion
The idea worth taking from this indicator, even if you never load it, is the normalisation. Dividing the distance to a baseline by the local ATR turns an unportable price gap into a number that means the same thing everywhere — and once you have that number, the horizontal levels draw themselves. The proximity filter is a nice piece of chart craft on top of it, and the dashboard is convenient, but the (close − baseline) / step line is the part that transfers to whatever else you are already using.
The marks are best read as questions rather than answers: price has come three steps out and turned back — is that a market that is done, or one taking a breath? The indicator is honest about only asking.
Share it with the community and let us know how you use it in the comments below.