





Efficient Trend Step: A Trend Line That Only Moves on Confirmed Breaks
Introduction
Most trend lines follow price bar by bar. In a clean trend that works, but in a noisy market the line wiggles with every swing, flips direction on every pullback and gives one false signal after another.
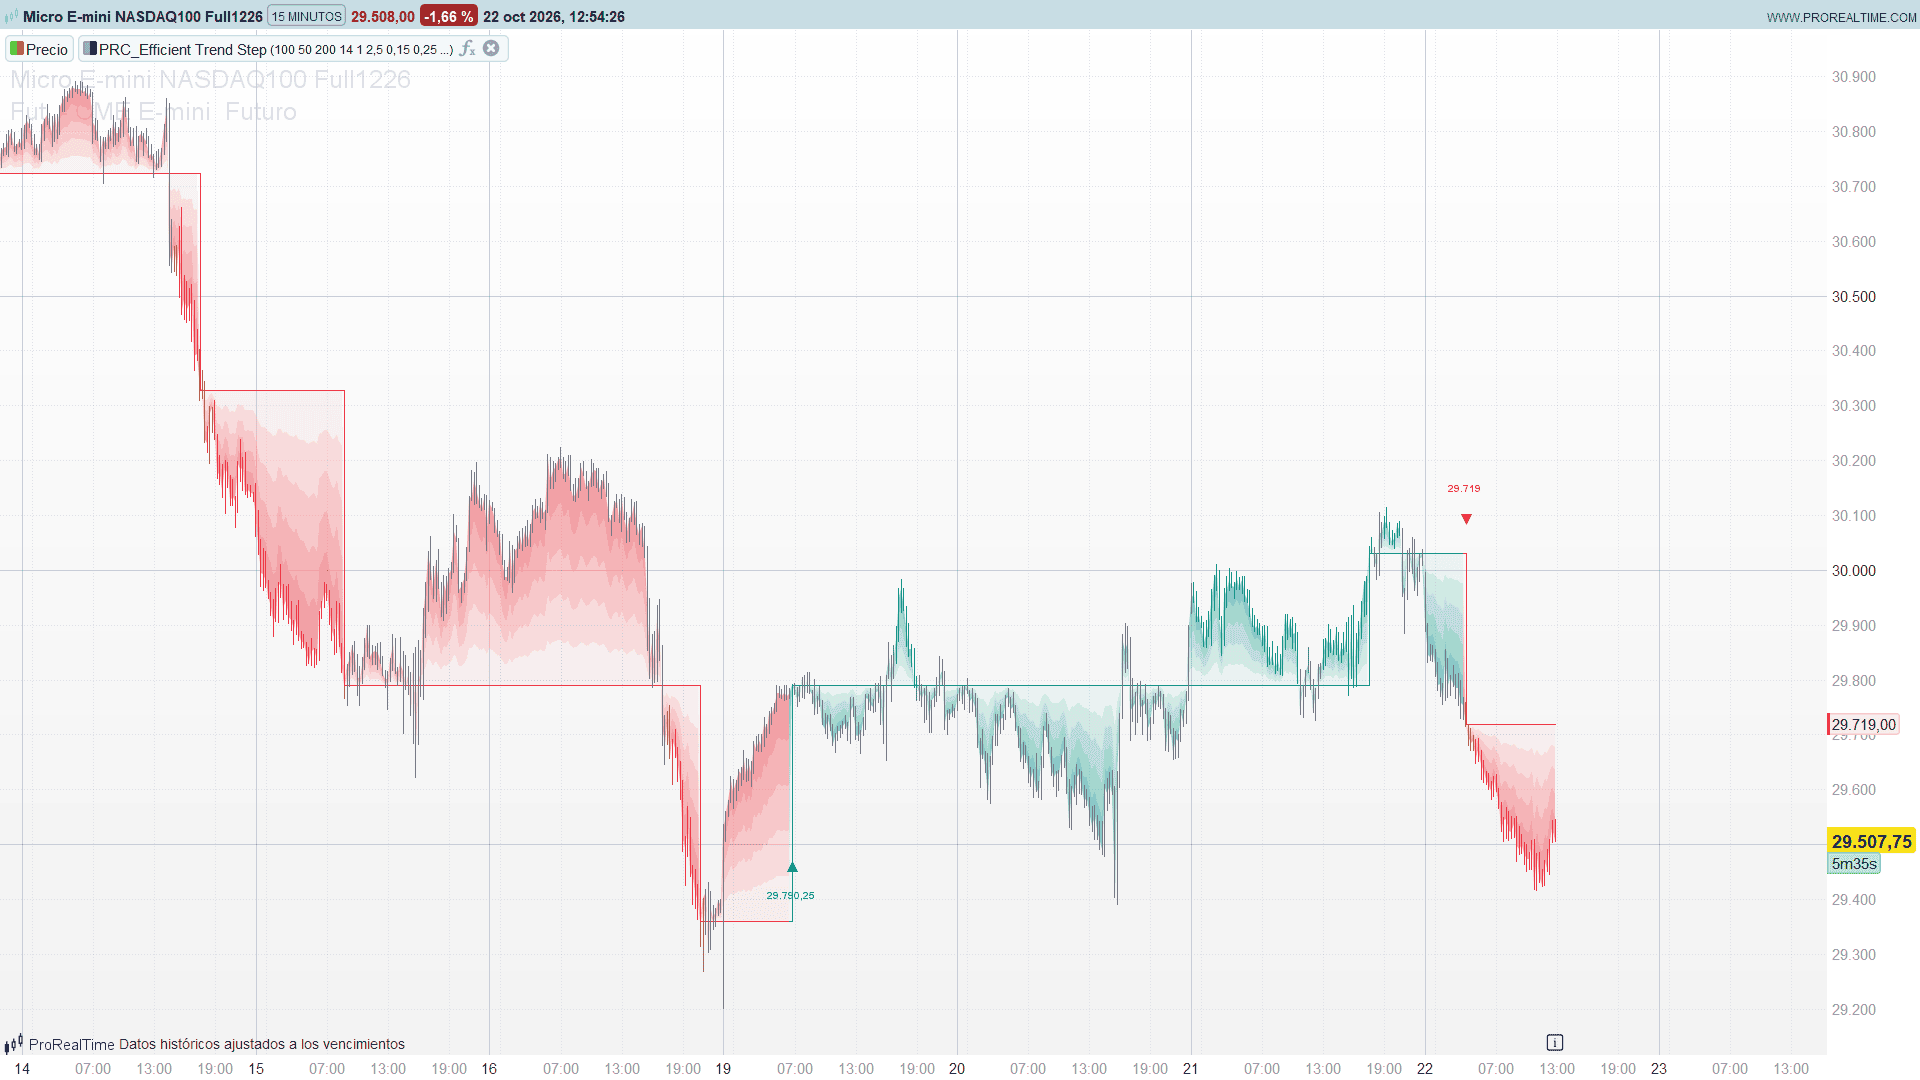
Efficient Trend Step [Noise Detection] by NeuraAlgo takes the opposite approach: it is a staircase. The line stays flat while price moves inside a noise band and only jumps to a new level when price breaks that band by a confirmed amount. The width of the band adapts to how efficiently the market is moving, and two noise filters stop single spikes and choppy phases from creating new steps. The result is a trend line that ignores most of the noise and only moves when the market really goes somewhere.
Theory Behind the Indicator
The indicator is built in four layers.
1. Efficiency of the move. The efficiency ratio compares the net move of the source over the last 100 bars with the sum of all the bar-to-bar moves in the same period. A value close to 1 means price travelled in an almost straight line; a value close to 0 means it went back and forth and got nowhere.
2. Adaptive step size. Two standard deviations of the source are calculated, a fast one (50 bars) and a slow one (200 bars), and blended with the efficiency ratio as the weight: when the market is efficient the fast deviation dominates and the band follows the trend closely; when the market is noisy the slow deviation dominates and the band widens. The step size is the larger of that blended deviation and the ATR multiplied by the ATR Step Multiplier.
3. Confirmed breaks. The upper threshold is the previous step plus the step size plus a confirmation margin (0.25 ATR by default); the lower threshold is the mirror image below. When the source closes above the upper threshold, the step jumps to the source and the trend turns bullish; below the lower threshold, it jumps down and the trend turns bearish. Inside the band, the step does not move.
4. Noise detection.
- Spike filter: a bar whose close-to-close move is larger than 2.5 ATR and larger than the usual bar move (an exponential average of the absolute bar-to-bar changes) is treated as a spike, and the step holds on that bar.
- Choppy filter: when the efficiency ratio falls below the Minimum Efficiency (0.15), the market is considered choppy. In that state only a break against the current direction is accepted: the trend can reverse, but it cannot add new steps in its own direction while the market is just noise.
On top of that, the trend strength is the distance from the source to the step measured in ATRs, clipped between -1 and +1 and smoothed with an exponential average. It drives the colour of the candles.
Key Features at a Glance
- Trend line drawn as a staircase that only moves on confirmed breaks.
- Step size that adapts to the efficiency of the market.
- Spike filter that holds the step on abnormal single-bar moves.
- Choppy filter that blocks new steps in the trend direction while the market has no direction.
- Gradient fill between the step and the price.
- Candles coloured by trend strength, from grey to green in uptrends and from red to grey in downtrends.
- Buy / Sell labels on full reversals, with the new step level.
How to Read the Indicator
- Green staircase: bullish trend. Red staircase: bearish trend. Grey: no break yet (only at the start of the history).
- A flat line means price is still inside its noise band. A pullback that does not break the lower threshold leaves the uptrend intact.
- A new step in the same direction is a trend extension: price broke the band again in the direction of the trend.
- Buy / Sell labels appear only on a full reversal (bearish to bullish or bullish to bearish), with the level of the new step.
- Candle colours: bright green or red candles mean price is far from the step, at least one ATR away: the trend is strong. Candles fading to grey mean price is coming back to the step: the trend is losing strength, and a reversal becomes possible.
- The fill goes from transparent at the step to half-opaque at the price, so the wider and more coloured it is, the more room price has above (or below) the step.
Practical Applications
- Trend filter: take trades only in the direction of the staircase, and ignore the setups against it.
- Trailing reference: the step only moves on confirmed breaks, so it can be used as a reference level for a trailing stop, or the opposite threshold as the level that would flip the trend.
- Reversal entries: the Buy / Sell labels mark the bars where the trend reverses after a confirmed break, already filtered for spikes.
- Regime reading: a long flat step with grey candles is a consolidation; a series of steps with bright candles is a trending market.
Indicator Configuration
Trend settings:
- length (default 100): bars of the efficiency ratio.
- fast (default 50): bars of the fast standard deviation.
- slow (default 200): bars of the slow standard deviation.
- Source: price used for the calculations, selected in the indicator settings (default close).
Noise detection:
- atrLength (default 14): ATR period.
- atrMult (default 1.0): minimum step size in ATRs.
- spikeMult (default 2.5): a bar moving more than this many ATRs is a spike.
- minEfficiency (default 0.15): below this efficiency the market is choppy.
Trend confirmation:
- confirmATR (default 0.25): extra margin, in ATRs, that price must clear beyond the step size to confirm a break.
Bar strength and display:
- smoothness (default 5, from 1 to 20): smoothing of the trend strength used to colour the candles.
- colorBars (default 1): 1 = colour the candles, 0 = keep the standard candles.
- showSignals (default 1): 1 = show the Buy / Sell labels.
- bullR, bullG, bullB / bearR, bearG, bearB / rngR, rngG, rngB: bullish, bearish and range colours.
The indicator needs some history before it starts: the staircase appears after max(fast, slow, atrLength) bars, 200 bars with the default settings. On a chart with little history, load more bars.
The Code
//---------------------------------------------------------------
// PRC_Efficient Trend Step [Noise Detection]
// version = 0
// 21.10.2026
// Iván González @ www.prorealcode.com
// Author: NeuraAlgo
// Sharing ProRealTime knowledge
//--------------------------------------------------------------------//

// ===================== INPUTS =====================
// Trend settings
length = 100          // Efficiency Length: bars of the efficiency ratio
fast = 50             // Fast Volatility Length
slow = 200            // Slow Volatility Length
src = customclose     // Source: choose it in the indicator settings (default close)

// Noise detection
atrLength = 14        // ATR Length
atrMult = 1.0         // ATR Step Multiplier
spikeMult = 2.5       // Spike Detection Multiplier
minEfficiency = 0.15  // Minimum Efficiency: below it the market is choppy

// Trend confirmation
confirmATR = 0.25     // Reversal Confirmation, in ATR

// Bar strength
smoothness = 5        // Gradient Smoothness (1 to 20)
colorBars = 1         // 1 = colour the candles with the trend strength gradient

// Buy / Sell signals
showSignals = 1       // 1 = show the Buy / Sell labels

// Colours: bullish, bearish and range
bullR = 8
bullG = 153
bullB = 129
bearR = 242
bearG = 54
bearB = 69
rngR = 120
rngG = 123
rngB = 134

// ===================== CALCULATIONS =====================
lenV = max(1, round(length))
fastV = max(1, round(fast))
slowV = max(1, round(slow))
atrLenV = max(1, round(atrLength))
smoothV = max(1, min(20, round(smoothness)))

// First bar where the ATR and both deviations have a value: the step starts there
warmIdx = max(max(fastV, slowV), atrLenV) - 1

// Bar-to-bar moves (0 on the first bar, so no undefined value enters a sum)
IF barindex = 0 THEN
   srcMove = 0
   barMove = 0
ELSE
   srcMove = abs(src - src[1])
   barMove = abs(close - close[1])
ENDIF

// Efficiency ratio: net move over the period / sum of all the bar-to-bar moves.
// 0 until there are enough bars, and 0 when the price did not move at all
pathSum = summation[lenV](srcMove)
er = 0
IF barindex >= lenV THEN
   IF pathSum > 0 THEN
      er = abs(src - src[lenV]) / pathSum
   ENDIF
ENDIF

// Adaptive deviation: efficient market -> fast deviation, noisy market -> slow one
fastDev = std[fastV](src * 2)
slowDev = std[slowV](src * 2)
dev = er * fastDev + (1 - er) * slowDev

atrV = averagetruerange[atrLenV](close)
stepSize = max(dev, atrV * atrMult)

// Usual size of a bar-to-bar move: exponential average of the absolute close
// change, seeded with its simple average of the first atrLength moves
avgMove = average[atrLenV](barMove)
IF barindex < atrLenV THEN
   normMove = 0
ELSIF barindex = atrLenV THEN
   normMove = avgMove
ELSE
   normMove = normMove[1] + 2 / (atrLenV + 1) * (barMove - normMove[1])
ENDIF

// Spike: a single bar that moves much more than the ATR and than usual
spike = 0
IF barindex >= atrLenV THEN
   IF barMove > atrV * spikeMult AND barMove > normMove THEN
      spike = 1
   ENDIF
ENDIF

// Choppy: the market moves without much net directional progress
choppy = 0
IF er < minEfficiency THEN
   choppy = 1
ENDIF

// ===================== CONFIRMED TREND STEP =====================
ONCE started = 0
ONCE startBar = 0
ONCE stepV = 0
ONCE dir = 0

IF started = 1 THEN
   prevStep = stepV[1]
   prevDir = dir[1]
ELSE
   prevStep = src
   prevDir = 0
ENDIF

upperV = prevStep + stepSize + atrV * confirmATR
lowerV = prevStep - stepSize - atrV * confirmATR

// The step holds during a spike and otherwise moves only on a confirmed break.
// In a choppy market only a break against the current direction is accepted
IF barindex >= warmIdx AND atrV <> undefined AND dev <> undefined THEN
   IF started = 0 THEN
      startBar = barindex
   ENDIF
   started = 1
   IF spike = 1 THEN
      stepV = prevStep
      dir = prevDir
   ELSIF src > upperV THEN
      IF choppy = 0 OR prevDir <= 0 THEN
         stepV = src
         dir = 1
      ELSE
         stepV = prevStep
         dir = prevDir
      ENDIF
   ELSIF src < lowerV THEN
      IF choppy = 0 OR prevDir >= 0 THEN
         stepV = src
         dir = -1
      ELSE
         stepV = prevStep
         dir = prevDir
      ENDIF
   ELSE
      stepV = prevStep
      dir = prevDir
   ENDIF
ENDIF

// ===================== COLOURS =====================
IF dir = 1 THEN
   lR = bullR
   lG = bullG
   lB = bullB
ELSIF dir = -1 THEN
   lR = bearR
   lG = bearG
   lB = bearB
ELSE
   lR = rngR
   lG = rngG
   lB = rngB
ENDIF

// Step line drawn as a stair: on the bar where the step jumps, the sloped
// connection of the line is hidden (alpha 0) and the stair is drawn with a
// horizontal and a vertical segment
jump = 0
IF started = 1 THEN
   plotStep = stepV
   IF stepV <> prevStep THEN
      jump = 1
   ENDIF
ELSE
   plotStep = undefined
ENDIF

lA = 255
IF jump = 1 THEN
   lA = 0
   DRAWSEGMENT(barindex - 1, prevStep, barindex, prevStep) COLOURED(lR, lG, lB, 255)
   DRAWSEGMENT(barindex, prevStep, barindex, stepV) COLOURED(lR, lG, lB, 255)
ENDIF

// Gradient fill between the step and the price: transparent at the step and
// 50% opaque at the price, in 5 bands. Nothing before the first break
IF started = 1 THEN
   fillTop = stepV
ELSE
   fillTop = close
ENDIF
IF started = 1 AND dir <> 0 THEN
   fA = 128
ELSE
   fA = 0
ENDIF
gapV = close - fillTop
lv1 = fillTop + gapV * 0.2
lv2 = fillTop + gapV * 0.4
lv3 = fillTop + gapV * 0.6
lv4 = fillTop + gapV * 0.8
a1 = round(fA * 0.1)
a2 = round(fA * 0.3)
a3 = round(fA * 0.5)
a4 = round(fA * 0.7)
a5 = round(fA * 0.9)
COLORBETWEEN(fillTop, lv1, lR, lG, lB, a1)
COLORBETWEEN(lv1, lv2, lR, lG, lB, a2)
COLORBETWEEN(lv2, lv3, lR, lG, lB, a3)
COLORBETWEEN(lv3, lv4, lR, lG, lB, a4)
COLORBETWEEN(lv4, close, lR, lG, lB, a5)

// ===================== BAR STRENGTH =====================
// Distance from the source to the step in ATRs, clipped to [-1, 1] and smoothed
// with an exponential average seeded with its simple average
rawG = 0
IF started = 1 THEN
   rawG = max(0 - 1, min(1, (src - stepV) / max(atrV, ticksize)))
ENDIF
avgG = average[smoothV](rawG)

gOk = 0
IF started = 1 THEN
   kG = barindex - startBar + 1
   IF kG >= smoothV THEN
      gOk = 1
      IF kG = smoothV THEN
         sGrad = avgG
      ELSE
         sGrad = sGrad[1] + 2 / (smoothV + 1) * (rawG - sGrad[1])
      ENDIF
   ENDIF
ENDIF

// Uptrend: range colour -> bullish colour as the strength goes 0 -> 1
// Otherwise: bearish colour -> range colour as the strength goes -1 -> 0
IF gOk = 1 THEN
   IF dir = 1 THEN
      tG = max(0, min(1, sGrad))
      cR = round(rngR + (bullR - rngR) * tG)
      cG = round(rngG + (bullG - rngG) * tG)
      cB = round(rngB + (bullB - rngB) * tG)
   ELSE
      tG = max(0, min(1, sGrad + 1))
      cR = round(bearR + (rngR - bearR) * tG)
      cG = round(bearG + (rngG - bearG) * tG)
      cB = round(bearB + (rngB - bearB) * tG)
   ENDIF
   IF colorBars = 1 THEN
      DRAWCANDLE(open, high, low, close) COLOURED(cR, cG, cB, 255) BORDERCOLOR(cR, cG, cB, 255)
   ENDIF
ENDIF

// ===================== BUY / SELL LABELS =====================
// Only a full reversal (down -> up or up -> down) is labelled, with the new
// step level, 6 ATR(30) below the low (buy) or above the high (sell)
atrLbl = averagetruerange[30](close)
IF showSignals = 1 AND dir = 1 AND dir[1] = -1 THEN
   dropY = low - atrLbl * 6
   DRAWTEXT("▲", barindex, dropY) COLOURED(bullR, bullG, bullB, 255)
   DRAWTEXT("#stepV#", barindex, dropY - atrLbl, SansSerif, Bold, 10) COLOURED(bullR, bullG, bullB, 255)
ENDIF
IF showSignals = 1 AND dir = -1 AND dir[1] = 1 THEN
   riseY = high + atrLbl * 6
   DRAWTEXT("▼", barindex, riseY) COLOURED(bearR, bearG, bearB, 255)
   DRAWTEXT("#stepV#", barindex, riseY + atrLbl, SansSerif, Bold, 10) COLOURED(bearR, bearG, bearB, 255)
ENDIF

RETURN plotStep COLOURED(lR, lG, lB, lA) STYLE(line, 1) AS "Filtered Trend Step"