Dual Thrust Strategy indicator

Dual Thrust Strategy indicator

The Dual Thrust trading algorithm is a famous strategy developed by Michael Chalek. It has been commonly used in futures, forex and equity markets. The idea of Dual Thrust is similar to a typical breakout system, however dual thrust uses the historical price to construct update the look back period — theoretically making it more stable in any given period.

Calculation parameters and upper and lower rails

(1). The highest price of N on High, HH, the lowest price of Close on N Day;

(2). The highest price of Closed N on the N day, the lowest price LL of Low on the N day;

(3). Range = Max(HH – LC, HC – LL)

(4). Calculate the upper track: Buyline = Open + K1 * Range

(5). Calculate the lower rail: Sellline = Open – K2 * Range

Construction system

(1). When the price breaks above the upper rail, if it holds the short position at that time, it will close the position first and then open the multiple position; if there is no position, it will open the multiple position directly.

(2). When the price breaks down the lower track, if it holds multiple positions at that time, it will close the position first, then open the short position; if there is no position, open the short position directly.

Dual Thrust feature

When K1<K2, the long is relatively easy to be triggered; when K1>K2, the short is relatively easy to be triggered, and when K1>K2, the short is relatively easy to be triggered. Therefore, when using this strategy, investors can refer to the optimal parameters of historical data testing on the one hand, and on the other hand, they can start with their own judgments on the post-trend or from other major cycle technical indicators. Adjust the values ​​of K1 and K.

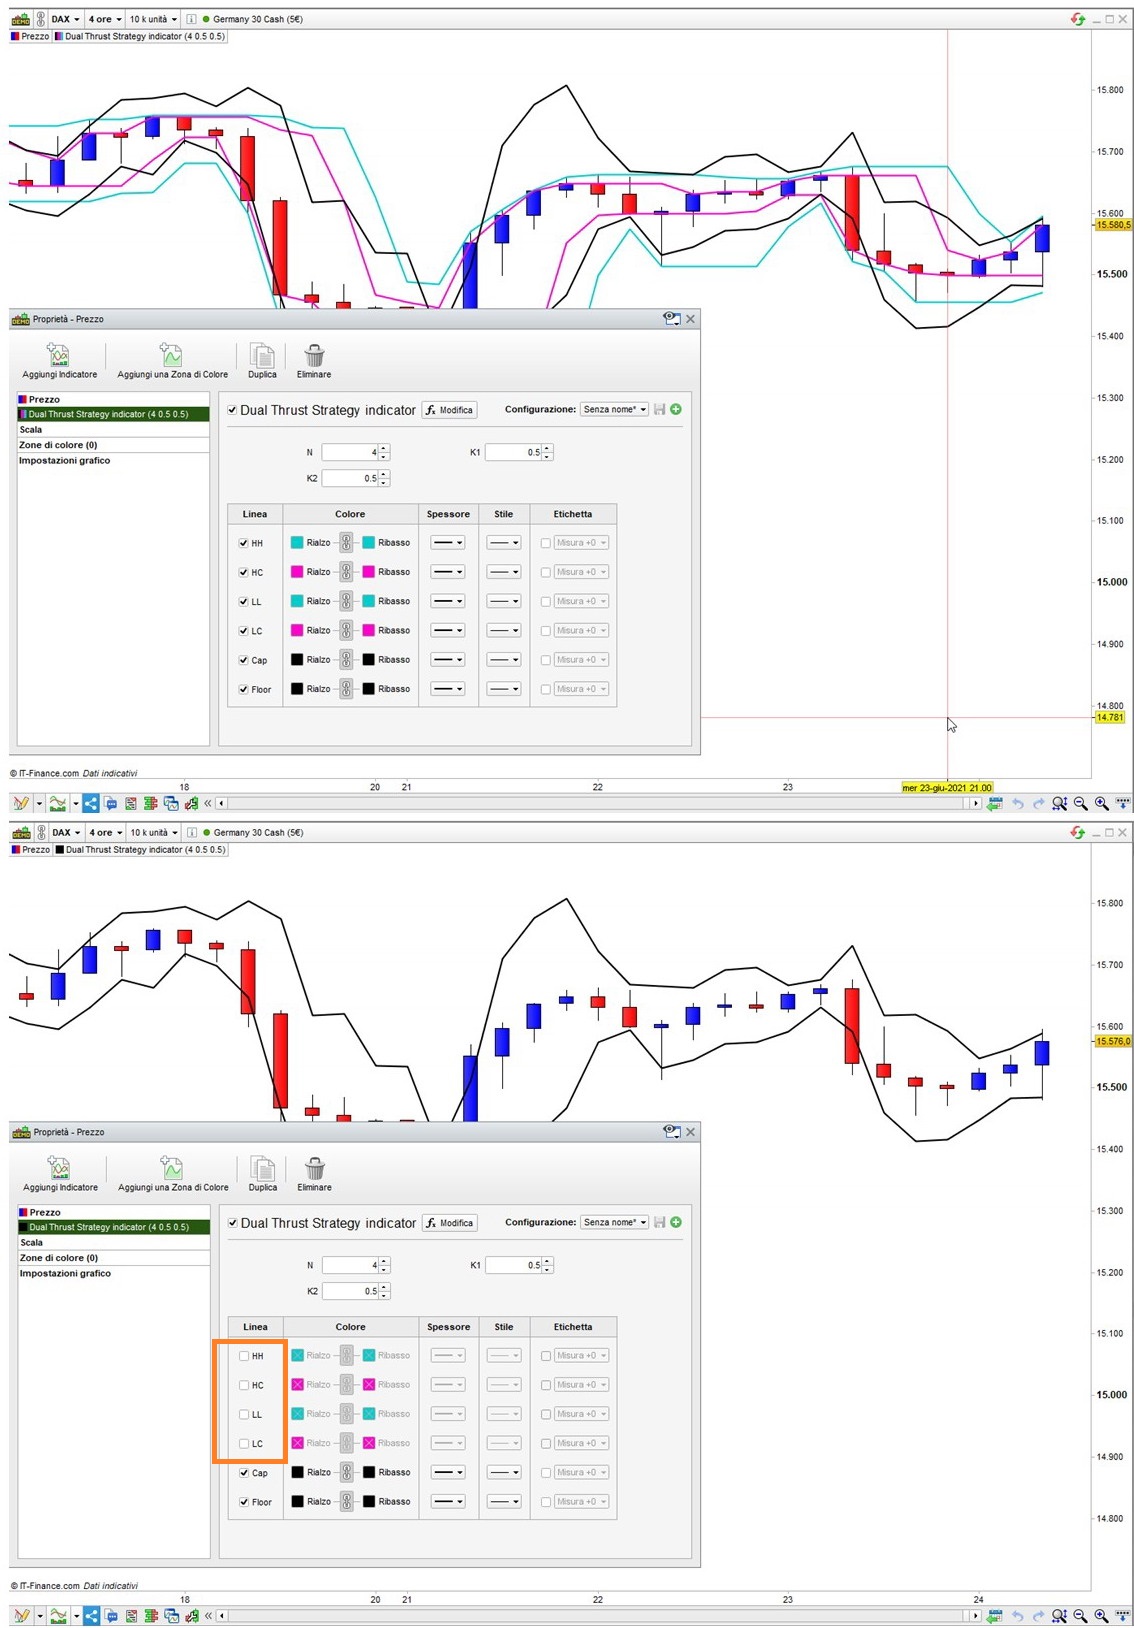
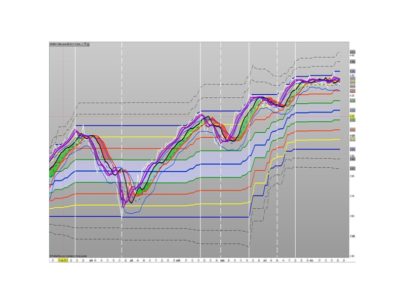
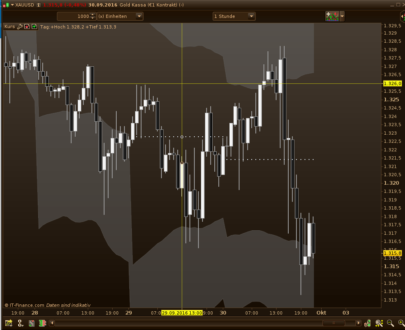
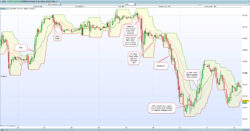
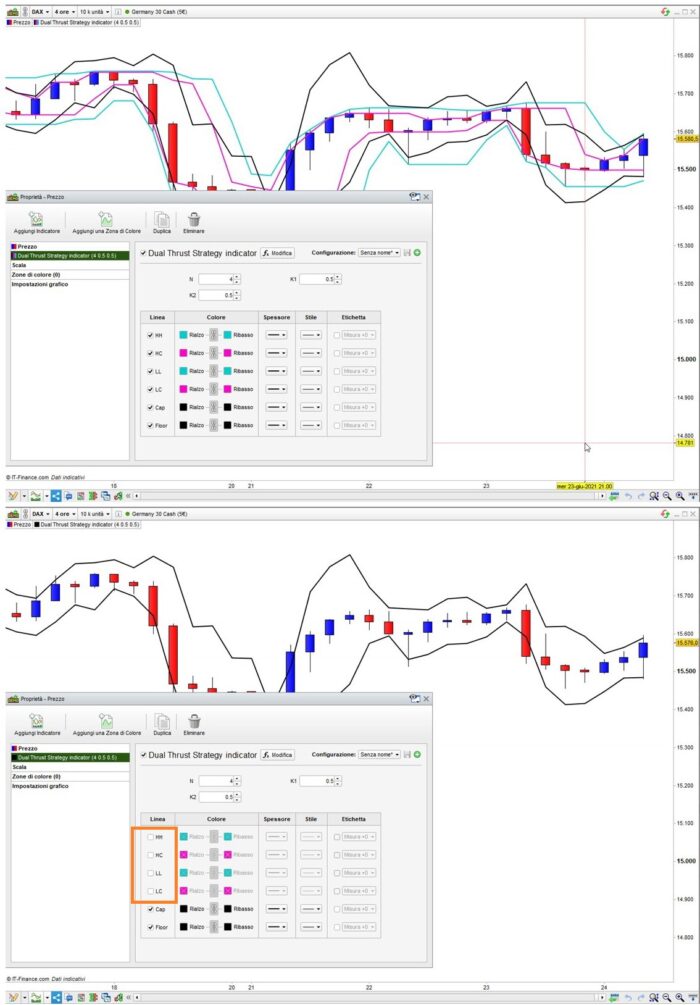
Following this request https://www.prorealcode.com/topic/convert-request-dual-thrust-trading-algorithm/, I wrote this indicator, to visually help coding a strategy.

Share this

Risk disclosure:

No information on this site is investment advice or a solicitation to buy or sell any financial instrument. Past performance is not indicative of future results. Trading may expose you to risk of loss greater than your deposits and is only suitable for experienced investors who have sufficient financial means to bear such risk.

ProRealTime ITF files and other attachments : How to import ITF files into ProRealTime platform?

PRC is also on YouTube, subscribe to our channel for exclusive content and tutorials
avatar
Register or

Likes

avatar
Related users ' posts
Nicolas
9 years ago
T3 Velocity
T3 Velocity
16
Indicators
tatankayotanka As you can do to set a marker directly in the price property page and then view it such as m...
Nicolas It may be a good idea to discuss this in the forum instead. Please open a new topic in probu...
Wester Hi, is this more or less the same as the TTM Squeeze indicator (john carter)
Nicolas I don't know really, just like you I found a lot of different formulas there and there on th...
CarlosFC  Thanks a lot Nicolas. I posted it. Carlos.
besho hello Nicolas how can i get this indicator i tried copy and paste the code but i didn't...
Guibourse Hi ! I am asking once again for your help : would it be possible to use the ATR as a "take p...
Tradingrob Many thanks for the indicator, however if the price is below the indicator, then the indicat...
aldtrading Merci pour ton travail ! J'ai de bons résultats en utilisant cet indicateur
Etienne Hi, I'm quite late in this thread. I'd just like to propose an enhancement because this in...
Nicolas Thanks Etienne.
Bard Hi Nicolas, I wanted to make this scaled indicator above between -1 and +1 instead of 0 to +...
Nicolas The code is correct, don't know if the label and color are the same as other trading softwar...
peppe novellino Hi Nicolas, the settings of the alligators are not editable. How can I change it? Thanks in ...
pabo_swe I got very bad performance with this script, it was slow... it seems like if one breaks out ...
juju333 Merci Nicolas, j'utilisais avec bonheur ce code dans la 10.3, il ne tourne plus dans la v11....
Nicolas Remplacer les lignes 11 et par 12 avec: yearlyHigh = Highest[max(1,BarIndex - lastYearBarI...
juju333 merci !!!
Madrosat Bonjour Nicolas Je souhaiterais faire colorier le fond du graphique supérieur en vert lorsq...
Nicolas Merci d'ouvrir un sujet dans le forum approprié.
Nwab Hello Mr Nicolas.. Please how can I set this up as an indicator to work on mt5. Your guidan...
Nicolas
9 years ago
Kuskus Starlight
Kuskus Starlight
5
Indicators
luigiR sara ovviamente mia premura condividerla nn appena sara pronta
Nicolas Why are posting your question here?! Its not related to this indicator...Please use the foru...
luigiR Hi Nicholas, excuse me, but I don't know about this opportunity, I try, sorry again
larouedegann best with this hour IF TIME =081000 THEN plushaut=highest[2](high) plusbas = lowest[2](lo...
CanAny1Trade Hi! I'm trying to put together a similar indicator but struggling. I want to mark the NY Pit...
jeanphi0034 Hello, I would like to use the QQE indicator which is based on smooth RSI as far as I unders...
ilstefano Bonjour Nicolas, te serait il possible de rajouter la fast ATR manquante dans le code? Merci
Nicolas Désolé je ne comprends pas la question ?
Ruddy
9 years ago
Newbie Okay... Scrap that call for help! I've gone through the documentation and taught myself... I...
Nicolas Please open a new topic for this query in the screeners forum.
Newbie Fantastic work here. This is fantastic for entry spotting.
supertiti
9 years ago
Murray math levels
Murray math levels
2
Indicators
MonopolyTm Hello, Do you think it is possible to code something similar to the example in the following...
robertogozzi Why HAUT and BAS have been calculated AFTER line 8? Shouldn't they be calculated BEFORE lin...
zilliq Be careful, It works only if you are in daily timeframe, and on your graphic you are on hou...
DerPat I guess you are right, like always. If you change n to 24 you have at least the hours of a d...
gabri DerPat, you can also change line1 to read as follow to adapt this script to hourly timefram...
supertiti
9 years ago
Nicolas
9 years ago
ALMA MACD
ALMA MACD
7
Indicators
Arnaud HALVICK Great indicator, thank you!
JMat45 Hi Nicolas, just reviewing this indicator and noticed that you have double assigned the vari...
Nicolas That would not make any difference because the code is read from top to bottom.
Pere
9 years ago
Low-High Bands
Low-High Bands
5
Indicators
supertiti Hola Petrus Estas aficionado de vino para tener este mote ? El canal de donchian es la bas...
Petrus Hombre, no te diré que no me guste el vino, y en especial éste, pero aún me faltan muchos tr...
Petrus Saludos desde Barcelona!
Nicolas Use the wrench of the price chart! Upper left of the window
Dymjohn The wrench shows options for the components of the indicator not how to show in the main cha...
Nicolas http://www.prorealcode.com/topic/overlapping-indicators/  
Conte Caimano
9 years ago
Butterworth Filter
Butterworth Filter
7
Indicators
Nicolas Do I need to change the code accordingly to your formula?
StefanoCG ciao Fabio ... non hai mica tutti i torti ... la notte bisognerebbe dormire per non scrivere...

Top