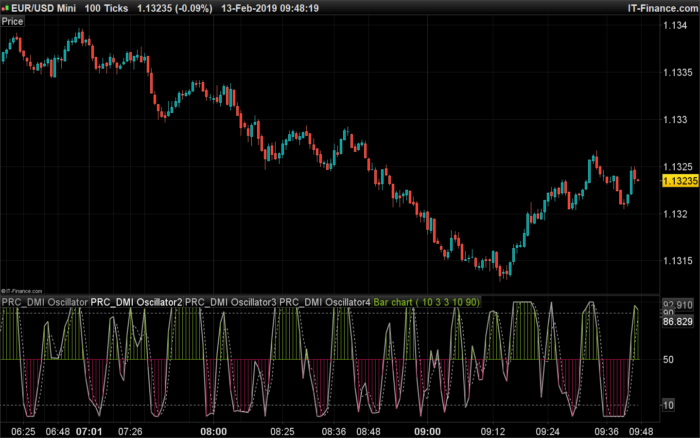
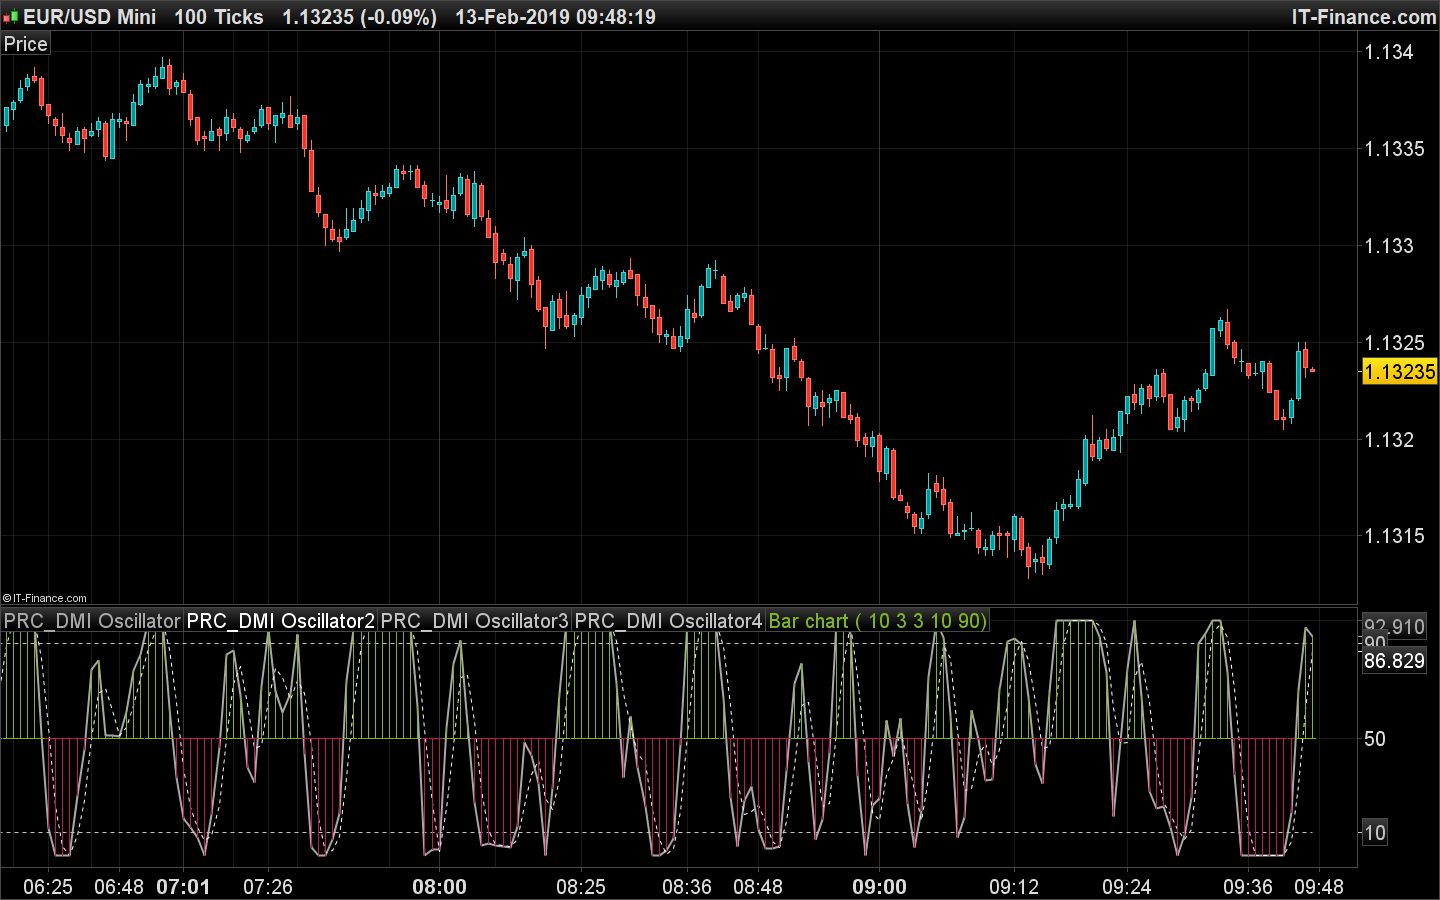
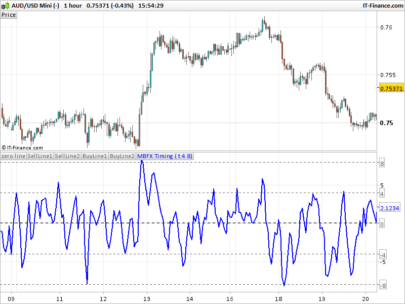
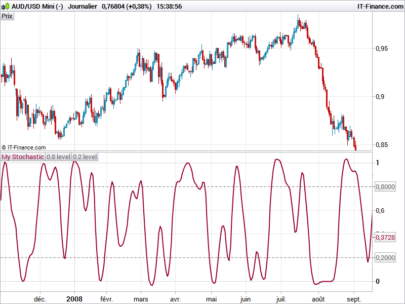
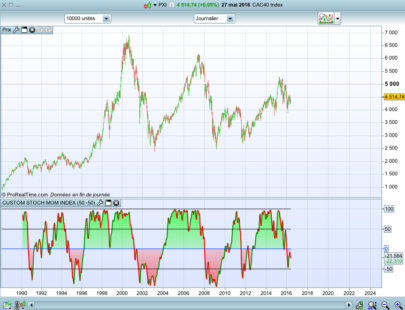
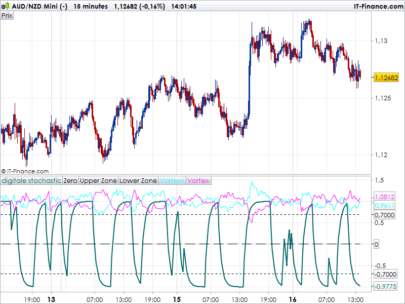
“The DMI stochastic uses the basic formulation for a 10, 3, 3 stochastic oscillator found in most charting packages but replaces the closing price of the price bar with the value of the 10-period DMI oscillator. The overbought and oversold levels are different also. They occur at the 10 and 90 levels instead of the more usual 20 and 80 levels. The DMI stochastic is much faster and less smooth than a stochastic based on price. However, it reaches extremes quickly, which allows for timely entries and exits.”
Barbara Star
|
1 2 3 4 5 6 7 8 9 10 11 12 13 14 15 16 17 18 19 20 21 22 23 24 25 26 27 28 29 30 31 32 33 34 35 36 37 38 39 40 41 42 43 44 45 46 47 48 49 50 51 52 53 54 55 56 57 58 59 60 61 62 |
//PRC_DMI Oscillator | indicator //12.02.2019 //Nicolas @ www.prorealcode.com //Sharing ProRealTime knowledge // --- settings DMIlength = 10 //DMI Length Stolength = 3 //DMI Stochastic Length Signallength = 3 //Stochastic signal line length os = 10 //Oversold ob = 90 //Overbought // --- end of settings if barindex>DMIlength then // DMI Osc Calc hiDiff = high - high[1] loDiff = low[1] - low if hiDiff>loDiff and hiDiff>0 then plusDM=hiDiff else plusDM=0 endif if loDiff>hiDiff and loDiff>0 then minusDM=loDiff else minusDM=0 endif wwma = ((wwma[1]) * (DMIlength - 1) + AverageTrueRange[1](close)) / DMIlength ATR = wwma wwmaPlus = ((wwmaPlus[1]) * (DMIlength - 1) + plusDM) / DMIlength wwmaMinus = ((wwmaMinus[1]) * (DMIlength - 1) + minusDM) / DMIlength PlusDI = 100 * wwmaPlus / ATR MinusDI = 100 * wwmaMinus / ATR osc = PlusDI - MinusDI // DMI Stochastic Calc hi = highest[Stolength](osc) lo = lowest[Stolength](osc) Stoch = summation[Stolength](osc-lo) / summation[Stolength](hi-lo) *100 if Stoch>50 then r=128 g=181 b=33 drawbarchart(50,Stoch,50,50) coloured(r,g,b) else r=194 g=25 b=89 drawbarchart(50,50,Stoch,50) coloured(r,g,b) endif signal = average[Signallength](stoch) endif return Stoch coloured(168,168,168) style(line,2),signal style(dottedline,1), ob coloured(195,195,195) style(dottedline,1) ,os coloured(195,195,195) style(dottedline,1) |
Share this
No information on this site is investment advice or a solicitation to buy or sell any financial instrument. Past performance is not indicative of future results. Trading may expose you to risk of loss greater than your deposits and is only suitable for experienced investors who have sufficient financial means to bear such risk.
ProRealTime ITF files and other attachments :
Find other exclusive trading pro-tools on ![]()
PRC is also on YouTube, subscribe to our channel for exclusive content and tutorials


Thanks a lot Nicolas !
hum…not sure it’s ok though: according to Trader article: “the DMI is a 10 period +DI minus a 10 period -DI). Beside, is it’s a Sto oscillo, why do we have a -1000 or + 2000 level on display on your capture?
In the article, her DMI Stoc oscillates between 0 and 100: any idea please ?
You are right, there’s something wrong. It’s late here, I’ll have a better look by tomorrow..
I think there’s a bug with the stochastic indicator, I made a technical report to PRT, will change the code once it has been revised.
Code is updated, entirely recoded with the help of another platform program and it is now correct.
Great, thanks a lot Nicolas !
Top Nicolas ! Merci
Thank’s! Great indicator:)