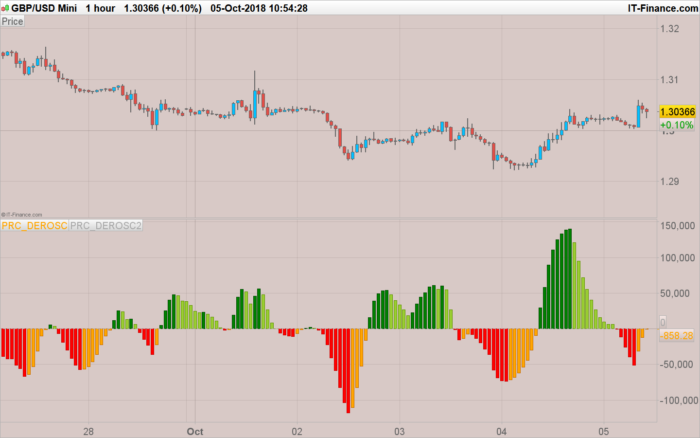
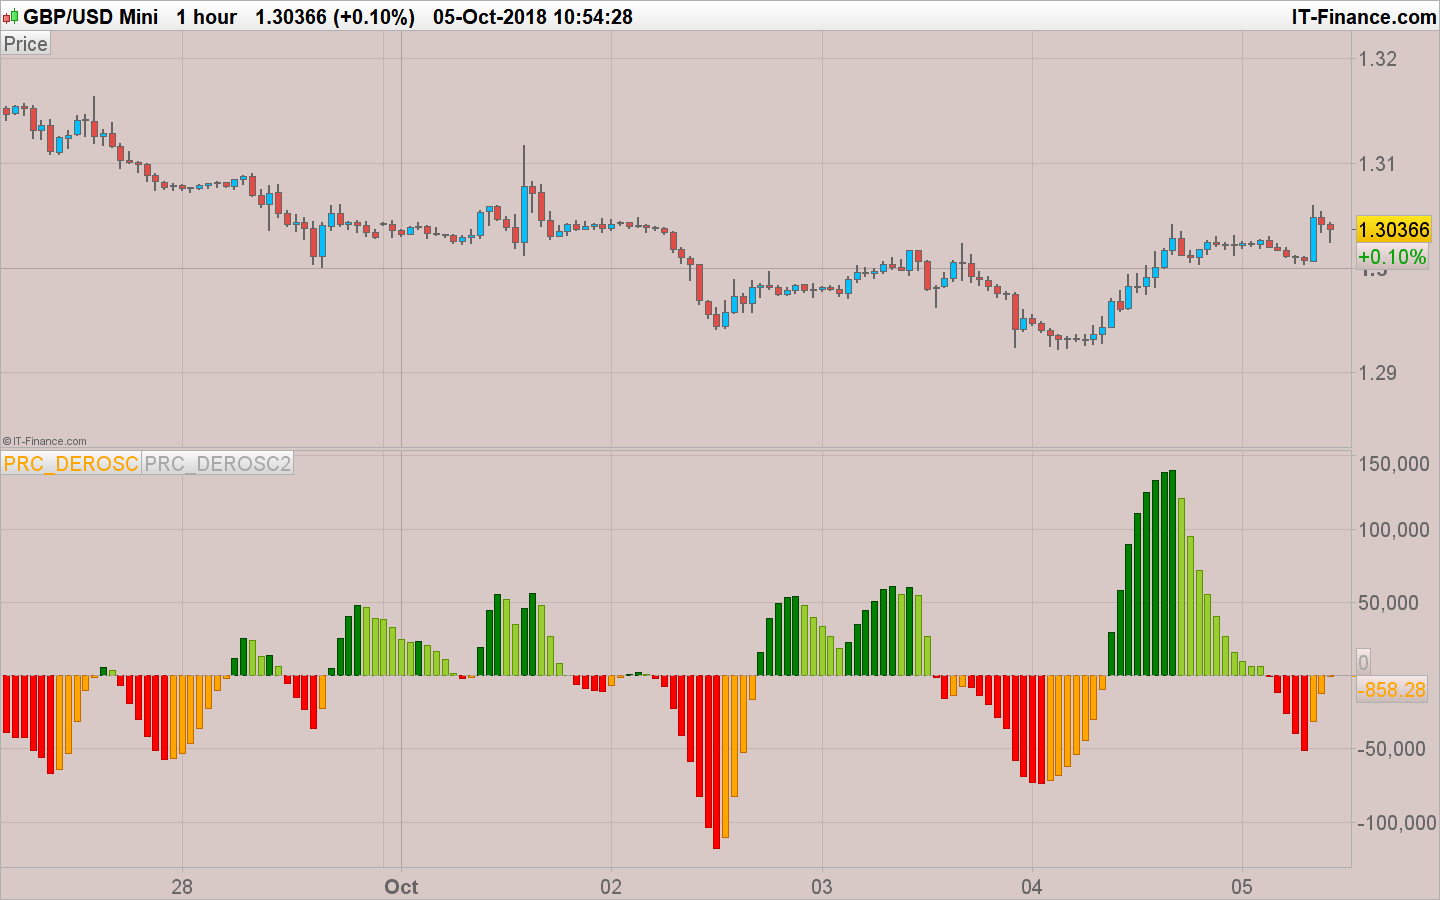
The Derivative Oscillator is an advanced version of the Relative Strength Index(RSI) and applies the MACD Histogram principle to the double smoothed RSI. The indicator was developed by Constance Brown and published in her book “Technical Analysis for the Trading Professional.”
The indicator is a twice exponentially smoothed RSI with the default parameters of 5 and 3.
Then a signal line is formed by simple smoothing of the resulting 2ERSI with the period of 9.
The derived histogram is calculated as a difference between 2ERSI and the signal line.
|
1 2 3 4 5 6 7 8 9 10 11 12 13 14 15 16 17 18 19 20 21 22 23 24 25 26 27 28 29 30 31 32 33 34 35 36 37 38 39 40 41 42 43 44 45 |
//PRC_DEROSC (derivative oscillator) | indicator //05.10.2018 //Nicolas @ www.prorealcode.com //Sharing ProRealTime knowledge //converted from MT5 version // --- settings InpPeriodRSI = 14 // RSI period InpPeriodEMA1 = 5 // First EMA period InpPeriodEMA2 = 3 // Second EMA period InpPeriodSMA = 9 // SMA period // --- end of settings InpAppliedPrice = customclose BufferRSI = RSI[InpPeriodRSI](InpAppliedPrice) BufferEMA1 = average[InpPeriodEMA1,1](BufferRSI) BufferEMA2 = average[InpPeriodEMA2,1](BufferEMA1) BufferSMA = average[InpPeriodSMA](BufferEMA2) DEROSC = (BufferEMA2-BufferSMA)/Pointsize if DEROSC>0 then if DEROSC>DEROSC[1] then r=0 g=128 b=0 else r=154 g=205 b=50 endif else if DEROSC>DEROSC[1] then r=255 g=165 b=0 else r=255 g=0 b=0 endif endif RETURN DEROSC coloured(r,g,b) style(histogram,1), 0 coloured(169,169,169) style(dottedline,1) |
Share this
No information on this site is investment advice or a solicitation to buy or sell any financial instrument. Past performance is not indicative of future results. Trading may expose you to risk of loss greater than your deposits and is only suitable for experienced investors who have sufficient financial means to bear such risk.
ProRealTime ITF files and other attachments :
Find other exclusive trading pro-tools on ![]()
PRC is also on YouTube, subscribe to our channel for exclusive content and tutorials


That is one of the greater indicators I have implemented. Thanks Nicolas!
Good job,I like so much.Thanks Nicolas
Many Many Thanks, Nicolas. My broker has a very old version of PRT. So, it give me error at the first line [“BufferRSI = RSI[InpPeriodRSI](InpAppliedPrice)”]. Please, what you suggest me?
Download the file and import it instead of copy/paste the code.
the old version I have does not allow importing. It is very old, I think the version 2 of PRT.
Hi Nicolas,
I have been extensively researching for lot of answers here. I found that you have been great contributor and helped with solving a lot of issues.
Thank you for helping.
I have a question on this indicator. I have imported the indicator. I tried applying to the chart, but I can’t see on the chart.
Can you help me on this?
Regards,
Bala
Don’t apply it on price, use the main “indicator and trading system” button found on the top bar of each price chart.
Hello,
Is there one for MT4?