Introduction
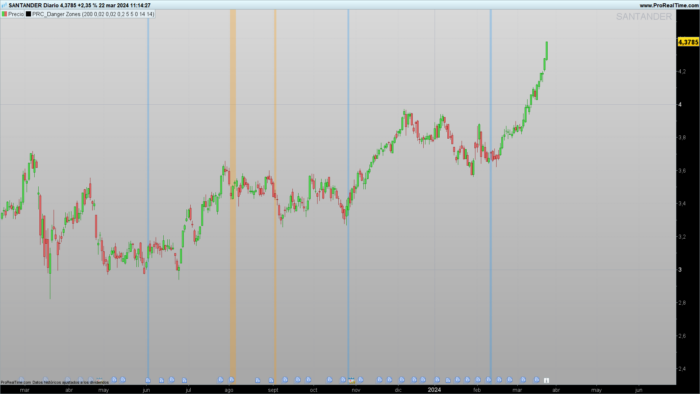
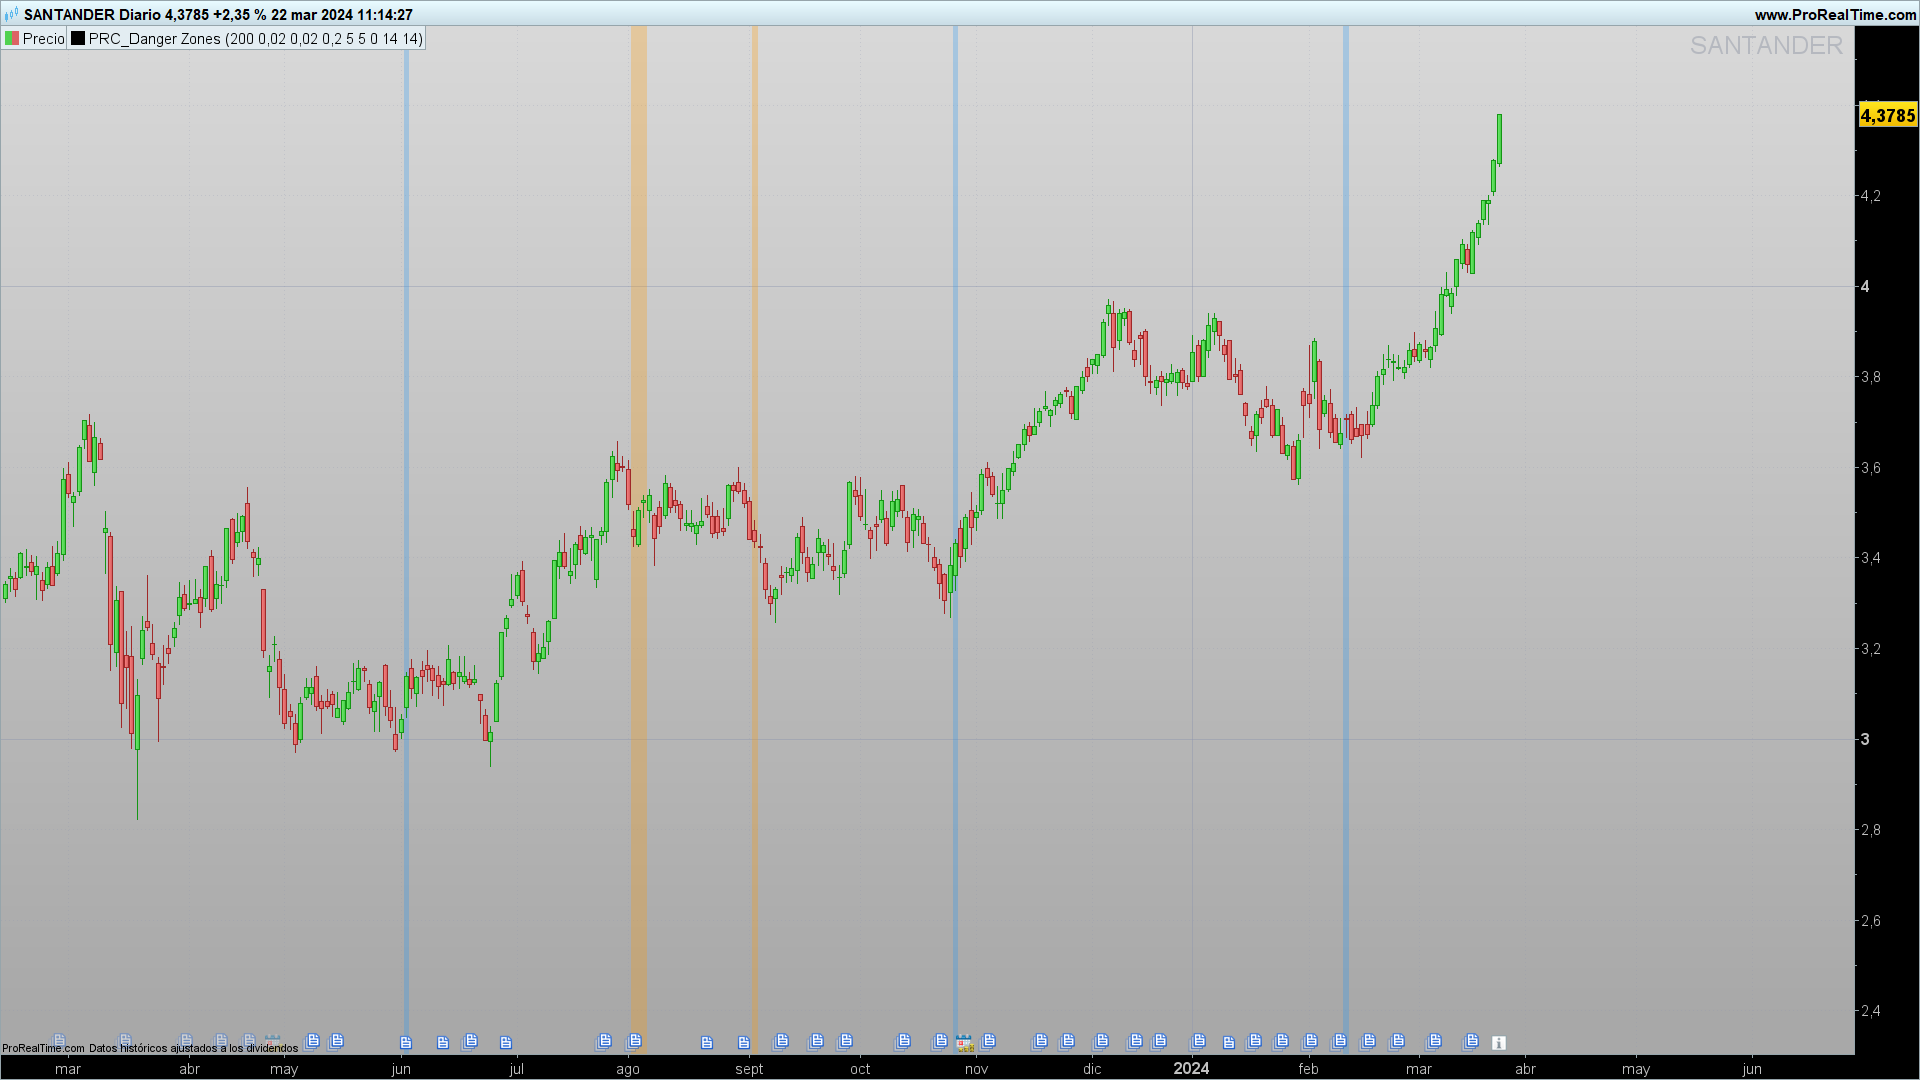
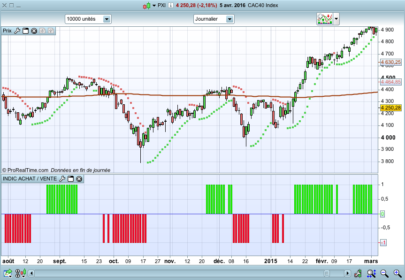
The Danger Zones indicator is crafted to alert traders about potential danger zones that precede significant shifts in market direction.
Trend Identification
The core of the Danger Zones indicator lies in its ability to determine the current market trend using two key components: the Hull Moving Average (HMA) and the Parabolic SAR.
The indicator considers a trend to be bullish when the closing price is above both the HMA and the Parabolic SAR, and bearish otherwise. When the price does not meet these conditions, the trend is considered neutral.
Identification of Danger Zones
The indicator takes a step further by analyzing buying and selling volume, as well as the position of the RSI relative to a moving average, to identify “Danger Zones.” These zones are signaled when the volume shows a significant slowdown compared to the average, indicating a potential loss of strength in the current trend.
Indicator Functionality
Danger Zones employs a series of calculations to assess the rate of change in volume and the position of the RSI. When a slowdown in buying volume is identified during an uptrend, accompanied by a negative movement in net price and the RSI below its moving average, a danger zone for the uptrend is signaled.
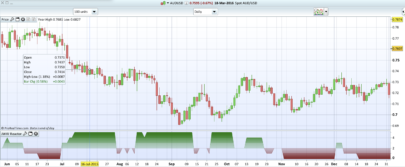
Similarly, danger zones for downtrends are identified under opposite criteria. The indicator uses visual signals, such as changes in background color, to alert about these danger zones.
Practical Applications
The Danger Zones indicator can be utilized to adjust entry and exit strategies, looking for signs of weakness in current trends that may suggest a reversal.
It is crucial to adjust the indicator’s settings, such as the length of the HMA or the parameters of the Parabolic SAR, to accommodate different time frames or assets.
Implementation in ProRealTime
To implement and customize the Danger Zones indicator in ProRealTime, users have the ability to modify a series of variables according to their preferences or specific trading strategies. Below are the key variables that can be adjusted:
Length of HMA (Hull Moving Average):
length = 200- This variable determines the period of the Hull Moving Average used to identify the market trend. A higher value makes the average smoother and less reactive to price changes.
Parameters of the Parabolic SAR:
start = 0.02increment = 0.02maximum = 0.2- These variables control the behavior of the Parabolic SAR, including the start, increment, and maximum. Adjusting these parameters can make the indicator more or less sensitive to price movements.
Period of Slowdown in Buying and Selling Volume:
buyingVolumeSlowdownPeriod = 5sellingVolumeSlowdownPeriod = 5- These variables define the period over which the slowdown in buying and selling volume is calculated, respectively. A longer period can help filter out minor changes in volume.
Type and Length of Moving Average for the RSI:
maTypeInput = 0(0 for SMA, other values for different types of moving averages)maLengthInput = 14- These variables allow the user to define the type and length of the moving average applied to the RSI. The choice of moving average type and its length can influence the indicator’s sensitivity to RSI variations.
Length of the RSI:
rsiLengthInput = 14- Determines the period of the RSI used to calculate the Relative Strength Index. A higher value produces a smoother RSI.
Source of the RSI:
rsiSourceInput = close- Specifies the data source for the RSI calculation, typically the closing price, but it can be adjusted to use other prices like the high, low, or average.
By modifying these variables, users can tailor the Danger Zones indicator to different trading styles, time frames, or personal preferences. It is crucial to experiment with these settings in a testing environment to determine the optimal combination that aligns with your trading objectives.
|
1 2 3 4 5 6 7 8 9 10 11 12 13 14 15 16 17 18 19 20 21 22 23 24 25 26 27 28 29 30 31 32 33 34 35 36 37 38 39 40 41 42 43 44 45 46 47 48 49 50 51 52 53 54 55 56 57 58 59 60 61 62 63 64 65 66 67 68 69 70 71 72 73 74 75 76 77 78 79 80 |
//PRC_Danger Zones //version = 0 //22.03.24 //Iván González @ www.prorealcode.com //Sharing ProRealTime knowledge ////////////////////////////////////////////////// //------Inputs: Trend Identification--------------------// //----HMA length = 200 src = customclose //----SAR start = 0.02 increment = 0.02 maximum = 0.2 //-------Inputs: Danger Zone Identification--------------// //----Volume buyingVolumeSlowdownPeriod = 5 //Buying Volume Slowdown Period sellingVolumeSlowdownPeriod = 5 //Selling Volume Slowdown Period //----Moving average maTypeInput = 0 // MA Type maLengthInput = 14 // MA Length //----RSI rsiLengthInput = 14 // RSI Length rsiSourceInput = close // Source //-------------------------------------------------------// //-----Trend identification------------------------------// hma = hullaverage[length](src) psar = SAR[start,increment,maximum] trendup = close > hma and close > psar trenddown = close < hma and close < psar trendneutral = not trendup or not trenddown //-------------------------------------------------------// //-------Danger Zone Identification----------------------// // Calculate average volume rate of change buyingVolumeRateOfChange = Momentum[buyingVolumeSlowdownPeriod](volume) sellingVolumeRateOfChange = momentum[sellingVolumeSlowdownPeriod](volume) averageBuyingVolumeRateOfChange = average[5,0](buyingVolumeRateOfChange) averageSellingVolumeRateOfChange = average[5,0](sellingVolumeRateOfChange) // Calculate net price movement averageNetPriceMovement = average[5,0](close-close[1]) // RSI integration src1 = max(momentum[1](rsiSourceInput),0) alpha1 = 1/rsiLengthInput if barindex = rsiLengthInput then up = average[rsiLengthInput](src1) else up = alpha1*src1 + (1-alpha1)*up[1] endif src2 = -min(momentum[1](rsiSourceInput),0) alpha2 = 1/rsiLengthInput if barindex = rsiLengthInput then down = average[rsiLengthInput](src2) else down = alpha2*src2 + (1-alpha2)*down[1] endif if down = 0 then myrsi = 100 elsif up = 0 then myrsi = 0 else myrsi = 100-(100/(1+up/down)) endif rsiMa = average[maLengthInput,maTypeInput](myrsi) rsibelowMA = myrsi < rsiMA rsiaboveMA = myrsi > rsiMA //-----------------------------------------------------// //-----Trend ending Prediction-------------------------// // Combine Conditions uptrendDangerZone = trendUp and buyingVolumeRateOfChange <= averageBuyingVolumeRateOfChange and averageNetPriceMovement < 0 and rsiBelowMA downtrendDangerZone = trendDown and sellingVolumeRateOfChange <= averageSellingVolumeRateOfChange and averageNetPriceMovement > 0 and rsiAboveMA //-----------------------------------------------------// if uptrendDangerZone then backgroundcolor(255,152,0,70) elsif downtrendDangerZone then backgroundcolor(33,150,243,70) endif return |
Share this
No information on this site is investment advice or a solicitation to buy or sell any financial instrument. Past performance is not indicative of future results. Trading may expose you to risk of loss greater than your deposits and is only suitable for experienced investors who have sufficient financial means to bear such risk.
ProRealTime ITF files and other attachments :
Find other exclusive trading pro-tools on ![]()
PRC is also on YouTube, subscribe to our channel for exclusive content and tutorials


Quite an impressive work, as usual. You share extremely useful tools and show an stunning background each day. Keep it up and congratulations. You are a dar hand!
Thank you very much!
Good morning Ivan. I try to use this indicator but I receive the automatic message on line 75 and 76
75 backgroundcolor(255,152,0,70)
76 elsif downtrendDangerZone then
The words in subtitled in red are …backgroundcolor…….and elsif.
Could you please check it?
Tks a lot
Claudio
Hi Claudio
The indicator works fine. Maybe you are with PRT11 instead PRT12?