Cardwell Range Analyze
Introduction
Most RSI indicators treat 30 and 70 as fixed walls. Andrew Cardwell spent a career arguing that those walls move with the trend — that in a healthy uptrend the RSI stops visiting oversold and instead oscillates inside a higher band, using 40-50 as support, while in a downtrend it lives in a lower band and rejects at 50-60. That observation, the RSI Range Rules, is the engine of Cardwell Range Analyze by MarkitTick.
Theory Behind the Indicator
1. The Cardwell regime
Two ingredients define the regime, and both must agree:
- Trend direction: price above or below its 50-period SMA.
- RSI range membership: RSI(14) sitting inside the bull band (40-80) or the bear band (20-60).
inBullRange = rsi >= 40 and rsi <= 80
bullRegimeRaw = close > sma50 and inBullRange
The mirror gives the bear regime. Anything else is neutral. This is a faithful reading of Cardwell: an uptrend is not just price over a moving average, it is price over the average with the oscillator behaving the way an uptrend’s oscillator should — refusing to break down into the 20s.
2. Confirmation
A raw regime has to survive confirmBars (default 2) consecutive bars before it counts:
bullConfirmCount := bullRegimeRaw ? bullConfirmCount + 1 : 0
bullRegime = bullRegimeRaw and bullConfirmCount >= confirmBars
This is a deliberate lag. It trades responsiveness for fewer one-bar flip-flops around the SMA. Worth knowing: it makes every signal a confirmation signal, never an anticipation one.
3. Signals
A signal is a regime change, not a level cross:
longSignal = regimeState == 1 and regimeState[1] != 1
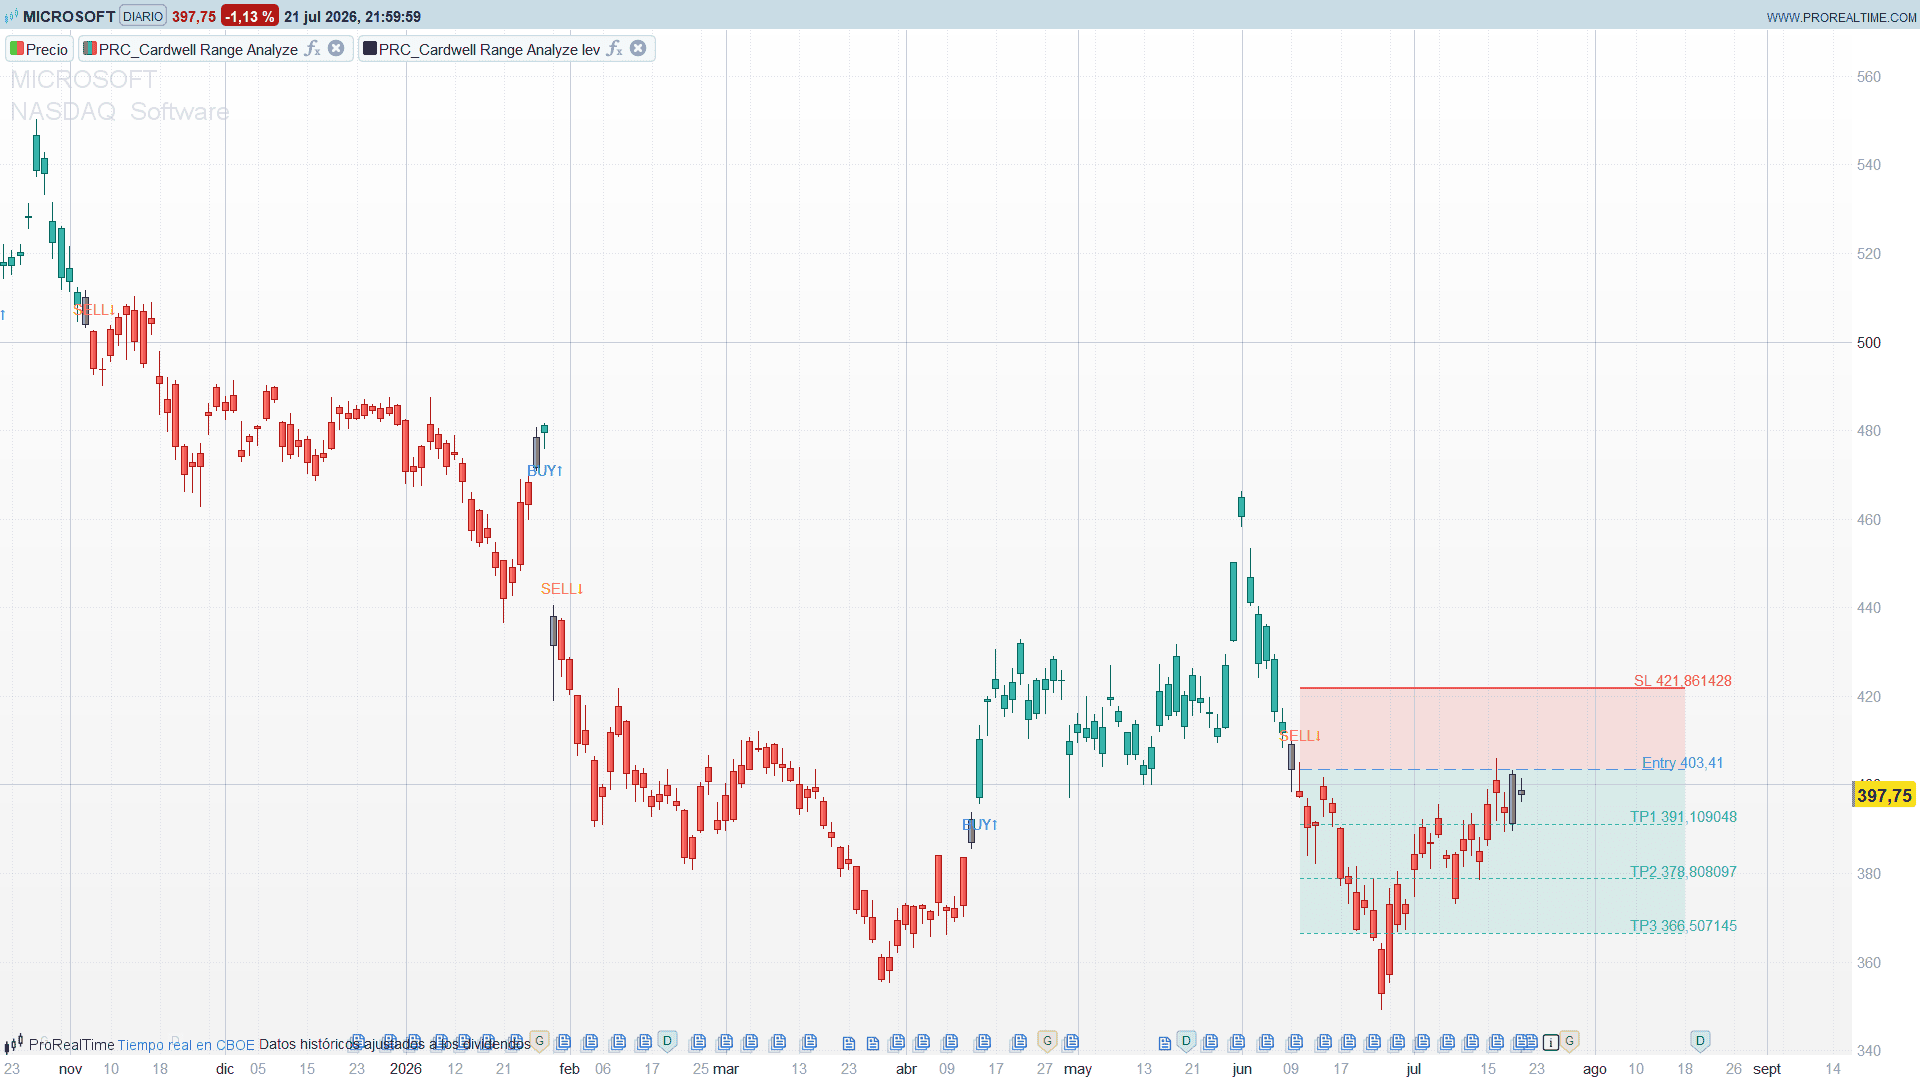
The chart turns from neutral/bear to a confirmed bull regime, and a BUY prints. That is all a signal is here — the moment the heatmap flips colour.
The ProBuilder Code
Code 1 (candles and signals)
//----------------------------------------------
//PRC_Cardwell Range Analyze
//version = 0
//22.07.26
//Ivan Gonzalez @ www.prorealcode.com
//Traducido de "Cardwell Range Analyze [MarkitTick]" (PineScript v6)
//Autor original: MarkitTick
//Sharing ProRealTime knowledge
//----------------------------------------------
// --- Parametros (declarar como Variables en el editor) ---
rsiLen = 14          // RSI Length
trendLen = 50        // Trend MA Length
bullLo = 40          // Bull Range Low
bullHi = 80          // Bull Range High
bearLo = 20          // Bear Range Low
bearHi = 60          // Bear Range High
confirmBars = 2      // barras de confirmacion del regimen
useChop = 0          // 1 = exigir ADX >= adxMin (filtro anti-lateral)
adxLen = 14          // ADX Length
adxMin = 20          // ADX Min Strength
showCandles = 1      // 1 = colorea las velas por regimen
showSignals = 1      // 1 = dibuja BUY/SELL en el cambio de regimen
//----------------------------------------------
// --- Nucleo Cardwell ---
//----------------------------------------------
myrsi = rsi[rsiLen](close)
trendMA = average[trendLen](close)
isUptrend = close > trendMA
isDowntrend = close < trendMA

inBullRange = myrsi >= bullLo and myrsi <= bullHi
inBearRange = myrsi >= bearLo and myrsi <= bearHi

bullRegimeRaw = isUptrend and inBullRange
bearRegimeRaw = isDowntrend and inBearRange

// Confirmacion: N barras consecutivas en el mismo regimen bruto
// (el else resetea el contador -> se auto-inicializa en la barra 0)
if bullRegimeRaw then
    bullCnt = bullCnt + 1
else
    bullCnt = 0
endif
if bearRegimeRaw then
    bearCnt = bearCnt + 1
else
    bearCnt = 0
endif

bullRegime = bullRegimeRaw and bullCnt >= confirmBars
bearRegime = bearRegimeRaw and bearCnt >= confirmBars

regimeState = 0
if bullRegime then
    regimeState = 1
elsif bearRegime then
    regimeState = -1
endif
//----------------------------------------------
// --- Filtro chop opcional (ADX nativo) ---
//----------------------------------------------
myadx = adx[adxLen]
chopOk = 1
if useChop and myadx < adxMin then
    chopOk = 0
endif
//----------------------------------------------
// --- Senales: cambio de regimen (HTF eliminado) ---
//----------------------------------------------
longSignal = 0
shortSignal = 0
if regimeState = 1 and regimeState[1] <> 1 and chopOk then
    longSignal = 1
endif
if regimeState = -1 and regimeState[1] <> -1 and chopOk then
    shortSignal = 1
endif
//----------------------------------------------
// --- Heatmap de velas por regimen ---
//----------------------------------------------
if bullRegime then
    cr = 38
    cg = 166
    cb = 154
elsif bearRegime then
    cr = 239
    cg = 83
    cb = 80
else
    cr = 120
    cg = 123
    cb = 134
endif

if showCandles then
    drawcandle(open, high, low, close) coloured(cr, cg, cb)
endif
//----------------------------------------------
// --- Senales BUY/SELL (X fija, dibujo inline) ---
//----------------------------------------------
atrOff = averagetruerange[14](close) * 0.5
if showSignals and longSignal then
    drawtext("BUY↑", barindex, low - atrOff) coloured(33, 150, 243, 255)
endif
if showSignals and shortSignal then
    drawtext("SELL↓", barindex, high + atrOff) coloured(255, 152, 0, 255)
endif
//----------------------------------------------
return
Code 2 (TP/SL levels and signals)
DEFPARAM DRAWONLASTBARONLY = TRUE
//----------------------------------------------
//PRC_Cardwell Range Analyze — Trade Levels
//version = 0
//22.07.26
//Ivan Gonzalez @ www.prorealcode.com
//Traducido de "Cardwell Range Analyze [MarkitTick]" (PineScript v6)
//Autor original: MarkitTick
//Sharing ProRealTime knowledge
//----------------------------------------------
//rsiLen = 14
//trendLen = 50
//bullLo = 40
//bullHi = 80
//bearLo = 20
//bearHi = 60
//confirmBars = 2
//useChop = 0
//adxLen = 14
//adxMin = 20
//atrLen = 14
//slMult = 1.5
//tp1Mult = 1.0
//tp2Mult = 2.0
//tp3Mult = 3.0
//lineExt = 20
//maxSig = 250

myrsi = rsi[rsiLen](close)
trendMA = average[trendLen](close)
isUptrend = close > trendMA
isDowntrend = close < trendMA

inBullRange = myrsi >= bullLo and myrsi <= bullHi
inBearRange = myrsi >= bearLo and myrsi <= bearHi

bullRegimeRaw = isUptrend and inBullRange
bearRegimeRaw = isDowntrend and inBearRange

if bullRegimeRaw then
   bullCnt = bullCnt + 1
else
   bullCnt = 0
endif
if bearRegimeRaw then
   bearCnt = bearCnt + 1
else
   bearCnt = 0
endif

bullRegime = bullRegimeRaw and bullCnt >= confirmBars
bearRegime = bearRegimeRaw and bearCnt >= confirmBars

regimeState = 0
if bullRegime then
   regimeState = 1
elsif bearRegime then
   regimeState = -1
endif

myadx = adx[adxLen]
chopOk = 1
if useChop and myadx < adxMin then
   chopOk = 0
endif

longSignal = 0
shortSignal = 0
if regimeState = 1 and regimeState[1] <> 1 and chopOk then
   longSignal = 1
endif
if regimeState = -1 and regimeState[1] <> -1 and chopOk then
   shortSignal = 1
endif

atrVal = averagetruerange[atrLen](close)

once nSig = 0
if longSignal then
   $sigX[nSig] = barindex
   $sigY[nSig] = low - atrVal * 0.5
   $sigDir[nSig] = 1
   nSig = nSig + 1
elsif shortSignal then
   $sigX[nSig] = barindex
   $sigY[nSig] = high + atrVal * 0.5
   $sigDir[nSig] = -1
   nSig = nSig + 1
endif

once tpslDir = 0
once entryBar = 0
once entryLvl = 0
once slLvl = 0
once tp1Lvl = 0
once tp2Lvl = 0
once tp3Lvl = 0

if longSignal then
   tpslDir = 1
   entryBar = barindex
   entryLvl = close[1]
   slLvl = entryLvl - atrVal * slMult
   tp1Lvl = entryLvl + atrVal * tp1Mult
   tp2Lvl = entryLvl + atrVal * tp2Mult
   tp3Lvl = entryLvl + atrVal * tp3Mult
elsif shortSignal then
   tpslDir = -1
   entryBar = barindex
   entryLvl = close[1]
   slLvl = entryLvl + atrVal * slMult
   tp1Lvl = entryLvl - atrVal * tp1Mult
   tp2Lvl = entryLvl - atrVal * tp2Mult
   tp3Lvl = entryLvl - atrVal * tp3Mult
endif

if islastbarupdate then
   startK = 0
   if nSig > maxSig then
      startK = nSig - maxSig
   endif
   for k = startK to nSig - 1 do
      if $sigDir[k] = 1 then
         drawtext("BUY↑", $sigX[k], $sigY[k]) coloured(33, 150, 243, 255)
      else
         drawtext("SELL↓", $sigX[k], $sigY[k]) coloured(255, 152, 0, 255)
      endif
   next

   if tpslDir <> 0 then
      x1 = entryBar
      x2 = barindex + lineExt
      drawrectangle(x1, slLvl, x2, entryLvl) coloured(239, 83, 80, 0) fillcolor(239, 83, 80, 40)
      drawrectangle(x1, entryLvl, x2, tp3Lvl) coloured(38, 166, 154, 0) fillcolor(38, 166, 154, 35)
      drawsegment(x1, slLvl, x2, slLvl) coloured(239, 83, 80, 255) style(line, 2)
      drawsegment(x1, entryLvl, x2, entryLvl) coloured(33, 150, 243, 255) style(dottedline2, 1)
      drawsegment(x1, tp1Lvl, x2, tp1Lvl) coloured(38, 166, 154, 150) style(dottedline, 1)
      drawsegment(x1, tp2Lvl, x2, tp2Lvl) coloured(38, 166, 154, 200) style(dottedline, 1)
      drawsegment(x1, tp3Lvl, x2, tp3Lvl) coloured(38, 166, 154, 255) style(dottedline, 1)
      drawtext("SL #slLvl#", x2, slLvl+0.15*atrVal) coloured(239, 83, 80, 255)
      drawtext("Entry #entryLvl#", x2, entryLvl+0.15*atrVal) coloured(33, 150, 243, 255)
      drawtext("TP1 #tp1Lvl#", x2, tp1Lvl+0.15*atrVal) coloured(38, 166, 154, 255)
      drawtext("TP2 #tp2Lvl#", x2, tp2Lvl+0.15*atrVal) coloured(38, 166, 154, 255)
      drawtext("TP3 #tp3Lvl#", x2, tp3Lvl+0.15*atrVal) coloured(38, 166, 154, 255)
   endif
endif

return