

Jurik QQE oscillator
Introduction
The Quantitative Qualitative Estimation (QQE) is a momentum oscillator built on top of a smoothed RSI. Originally published by Igor Livshin in the early 2000s, it has since become a staple of trading systems that need an RSI-style read without the jagged signal that the raw RSI produces. The QQE works by drawing two adaptive trailing bands around a smoothed RSI line — when the RSI breaks above the upper band the trend is bullish, when it breaks below the lower band the trend is bearish, and the bands themselves rarely whipsaw thanks to a freeze rule that prevents them from reversing on minor noise.
This translation is derived from Loxx’s Jurik CFB Adaptive QQE. This article ships the simplified version: a fixed-period RSI selectable between Wilders, Jurik RSX, and Rapid, fed into the same dual-band QQE that Loxx’s indicator uses, with the same colouring and freeze logic. Roughly 150 lines, instant render, and the same trading character as the original.
Theory Behind the Indicator
1. The Three RSI Flavours
The standard RSI uses Wilder’s smoothing — an EMA with alpha = 1/N, which is equivalent to a simple moving average over 2N - 1 periods. It is responsive but inherently noisy, and on intraday timeframes it produces enough false signals that almost every modern indicator wraps it in something smoother.
This indicator offers three alternatives, selectable via the rsiTypeOpt input:
- Wilders (option 0): the classical RSI, computed natively via
rsi[rsiPeriod](closer). Included as a baseline. - RSX (option 1, default): Mark Jurik’s noise-free RSI. The RSX uses a four-stage cascade of recursive filters on the momentum series and another four-stage cascade on the magnitude series, then takes the ratio. Each stage is a single-pole IIR filter with coefficient
Kg = 3 / (N + 2), and each stage’s output is combined with the next via the linear extrapolationoutput = 1.5 × A − 0.5 × B. The cumulative effect is a smoothing comparable to a Jurik Moving Average — almost lag-free, almost noise-free — applied directly inside the oscillator. The RSX is what makes this indicator distinctive. - Rapid (option 2): a fast-responding RSI that uses simple summations of up and down moves over the period rather than a recursive smoother. Useful for very short timeframes where even the standard Wilders smoothing is too slow.
2. The QQE Dual-Band Trailing Stop
Once a smoothed RSI is in hand, the QQE wraps it in two adaptive trailing bands. The bands are computed by smoothing the absolute first difference of the RSI (|ΔrsiMA|) twice with a Wilder filter, multiplying the result by a user factor, and adding/subtracting it from the current RSI value:
atrRsi = ABS(rsiMA - rsiMA[1])
outer  = wilder(wilder(atrRsi, N), N)
emaf   = outer × WPFast    // WPFast = 2.618 default
emas   = outer × WPSlow    // WPSlow = 4.236 default
The two bands track the RSI, but with a freeze rule: when the RSI crosses a band from one side, the band freezes at the previous value rather than jumping. This is what gives the QQE its characteristic smoothness — the bands do not flicker around the RSI on each noisy bar, they only update on actual regime changes.
Loxx’s version differs from the classical QQE in that it ships two trailing bands simultaneously: a slow band with factor 4.236 and a fast band with factor 2.618. The slow band acts as the major trend reference; the fast band reacts sooner and is used to confirm acceleration or deceleration within the major trend.
3. The Colouring Logic
The RSI MA itself is recoloured every bar:
- Green when the RSI is above both the slow and fast trends — strong bullish momentum confirmed by both timescales.
- Red when the RSI is below both trends — strong bearish momentum.
- Grey when the RSI is between the two trends — a transition zone where neither timescale has confirmed yet.
This is the indicator’s primary read: the colour transitions mark trend changes much more reliably than the raw RSI crossing 50.
Key Features at a Glance
FeatureBehaviourThree RSI typesWilders / RSX (Jurik) / Rapid — selectable via rsiTypeOptDual QQE trailingSlow band (4.236×) and Fast band (2.618×) on the smoothed RSIFreeze logicBands hold their previous value when the RSI crosses through, eliminating whipsawsColour-coded RSIGreen above both trends, red below both, grey in transitionOverbought / oversold80 / 20 reference lines, fixed (the smoothed RSI rarely tags 70/30 of the classical)
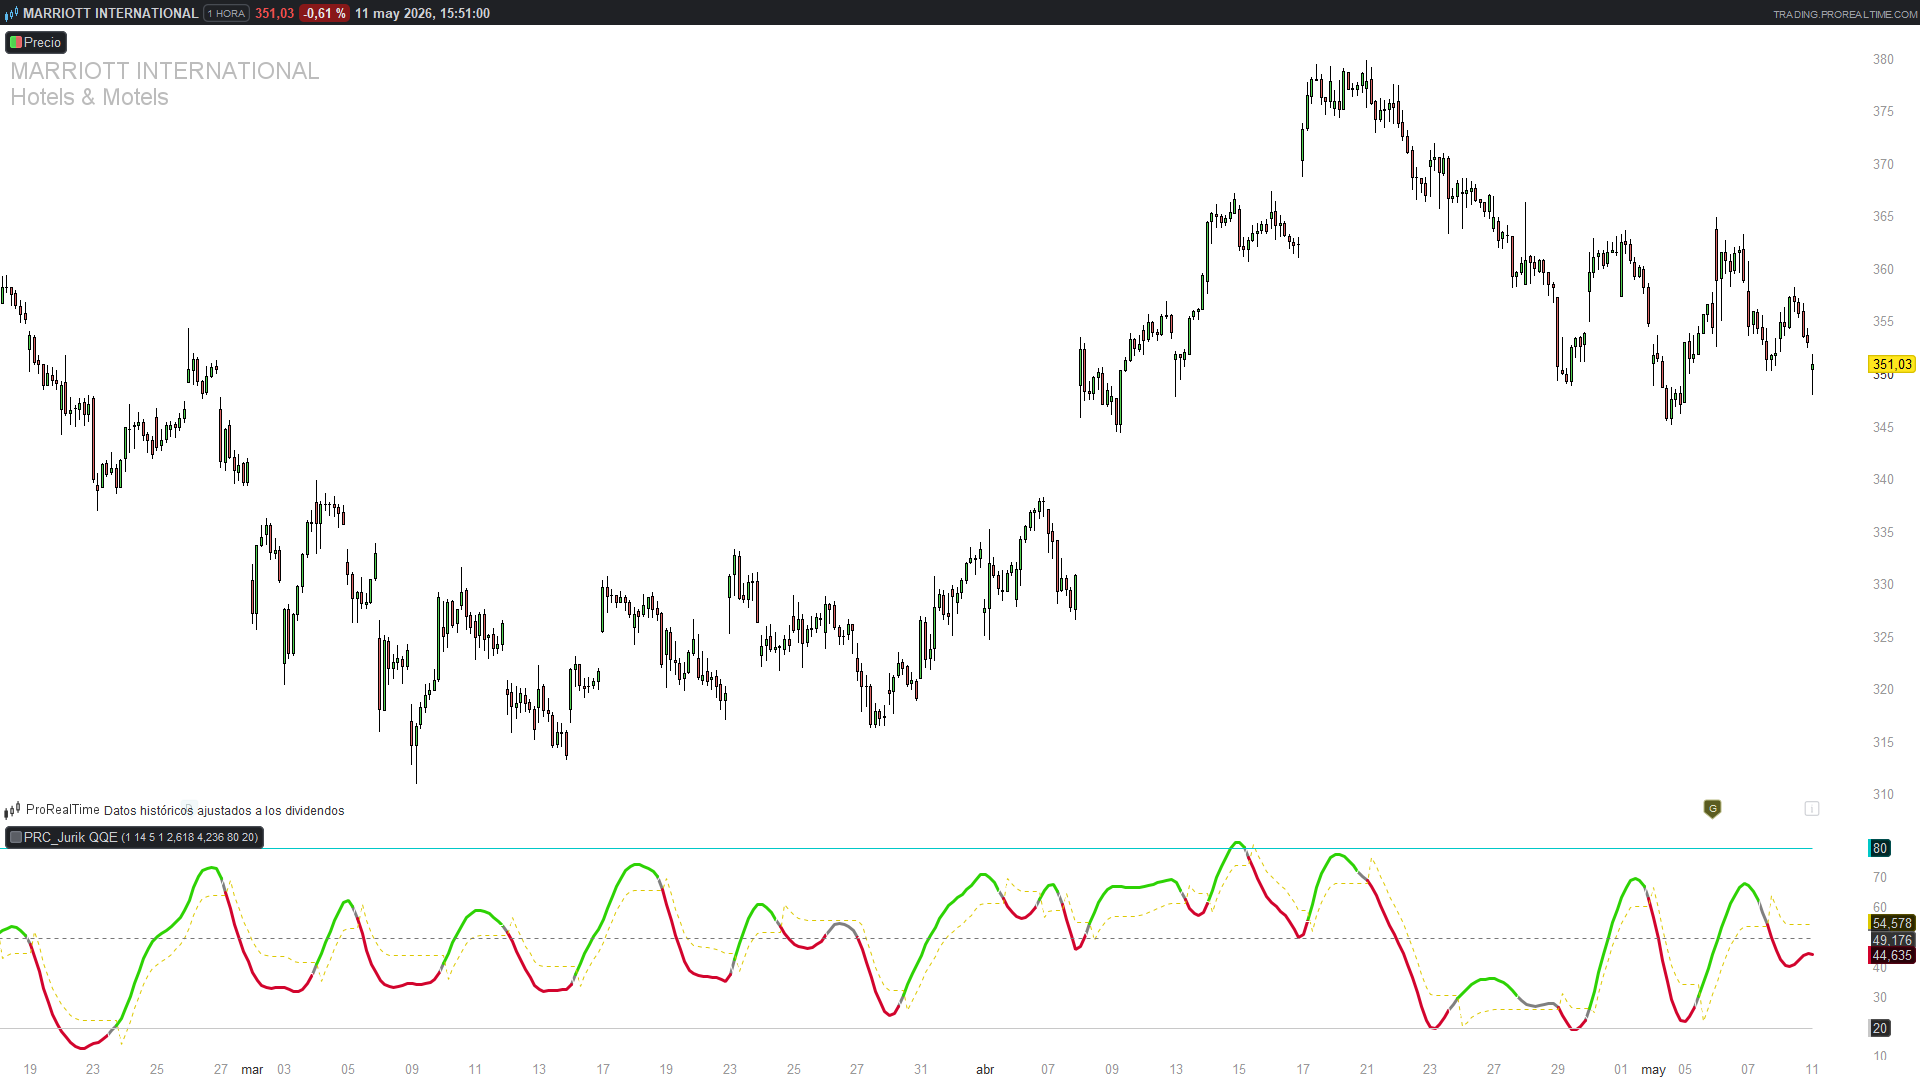
How to Read the Indicator
- The coloured line is the primary signal. Green = trend up confirmed by both timescales, red = trend down confirmed, grey = transition or low-conviction. The colour transitions are where the regime changes — far more useful than the 50 crossing of a raw RSI.
- The slow trend (yellow dotted) is the regime line. When the RSI MA stays above it consistently, the underlying trend is bullish; below it, bearish. The slow trend itself moves slowly thanks to the 4.236 factor — it is meant to be a regime filter, not an entry trigger.
- The fast trend (white) is the trigger line. Crossings of the fast trend are tighter and more frequent. In a confirmed regime (the RSI stays on the right side of the slow trend), use fast-trend crossings as pullback entries. Against the regime, treat them as noise.
- 80 and 20 are the saturation reference. Because the RSI is heavily smoothed, it rarely reaches 70 or 30 — the standard overbought/oversold levels of the raw RSI. The 80/20 lines mark genuine momentum exhaustion: when the smoothed RSI tags 80 it really means the asset is overextended.
- The 50 dotted midline separates the bullish half from the bearish half. The RSI MA bouncing off 50 in the direction of the regime is a classical continuation pattern that works well here because of the heavy smoothing.
Practical Applications
- Trend filter. Use the colour of the RSI MA as a binary regime gate. Green = trade longs; red = trade shorts; grey = stand aside. The grey state is short (a few bars per transition), so this is a high-conviction filter rather than a frequent one.
- Pullback entries. In a confirmed regime (RSI MA holding above/below the slow trend), enter on the fast-trend crossing back into the regime direction. This catches the resumption of trend after a counter-trend retracement.
- Divergence reads. Because the RSX is so heavily smoothed, divergence between price highs/lows and the RSI MA is visible and reliable. A new price high with the RSI MA failing to make a new high is a classical bearish divergence — and on this indicator the signal is clean enough to act on rather than just note.
- Overextension fade. When the RSI MA tags 80 or 20, it is genuinely overextended. In ranging markets, fades from these levels back to 50 have positive expectancy. In trending markets, do not fade — wait for the colour to flip first.
- Pairing with a volatility filter. The QQE has no concept of when the underlying volatility is collapsing — a flat market produces a tight, hesitant RSI MA hovering near 50 with frequent colour flips. Adding a volatility floor (e.g. ATR > X%) gates out the noise periods cleanly.
Indicator Configuration
rsiTypeOpt0 = Wilders RSI, 1 = RSX (Jurik), 2 = Rapid RSI. RSX is the default and the indicator’s signature.
rsiPeriod14RSI period. The smoothing absorbs most of the period’s effect — values 10–20 all behave similarly.
RsiSmoothingFactor5EMA smoothing applied to the RSI output. Larger = smoother RSI MA.
RsiPriceSmoothing1SMA applied to the source before the RSI. 1 = no pre-smoothing (default).
WPFast2.618Fast trend band multiplier (Fibonacci φ²).
WPSlow4.236Slow trend band multiplier (Fibonacci φ³).
overbought80Upper reference level.
oversold20Lower reference level.
The Fibonacci-based defaults (2.618, 4.236) are Loxx’s choice and reflect the indicator’s lineage to the wider “Wave Principle” family. They are not optimised in any rigorous sense, but they produce well-spaced bands that work across instruments.
Code
//PRC_Jurik QQE (simple, sin CFB Adaptive)
//version = 0
//11.05.26
//Ivan Gonzalez @ www.prorealcode.com
//Sharing ProRealTime knowledge
//-----------------------------------------------------
//===INPUTS===
rsiTypeOpt = 1                   //0=Wilders, 1=RSX, 2=Rapid
rsiPeriod = 14                   //RSI period
RsiSmoothingFactor = 5           //EMA smoothing del RSI
RsiPriceSmoothing = 1            //SMA del source antes del RSI
WPFast = 2.618                   //Factor Fast Trend
WPSlow = 4.236                   //Factor Slow Trend
overbought = 80
oversold = 20
//-----------------------------------------------------

//===Source smoothed (nativo, no necesita seed)===
closer = average[RsiPriceSmoothing](close)

//===Wilders RSI (nativo)===
wildersRsi = rsi[rsiPeriod](closer)

//===RSX (Jurik RSI) — cascada recursiva con seed===
IF BarIndex = 0 THEN
   f28 = 0
   f30 = 0
   f38 = 0
   f40 = 0
   f48 = 0
   f50 = 0
   f58 = 0
   f60 = 0
   f68 = 0
   f70 = 0
   f78 = 0
   f80 = 0
   rsxVal = 50
ELSE
   srcRsx = 100 * closer
   mom0 = srcRsx - srcRsx[1]
   moa0 = ABS(mom0)
   Kg = 3 / (rsiPeriod + 2)
   Hg = 1 - Kg
   //--cascada mom (4 etapas)
   f28 = Kg * mom0 + Hg * f28[1]
   f30 = Hg * f30[1] + Kg * f28
   mom1 = f28 * 1.5 - f30 * 0.5
   f38 = Hg * f38[1] + Kg * mom1
   f40 = Kg * f38 + Hg * f40[1]
   mom2 = f38 * 1.5 - f40 * 0.5
   f48 = Hg * f48[1] + Kg * mom2
   f50 = Kg * f48 + Hg * f50[1]
   momOut = f48 * 1.5 - f50 * 0.5
   //--cascada moa (4 etapas)
   f58 = Hg * f58[1] + Kg * moa0
   f60 = Kg * f58 + Hg * f60[1]
   moa1 = f58 * 1.5 - f60 * 0.5
   f68 = Hg * f68[1] + Kg * moa1
   f70 = Kg * f68 + Hg * f70[1]
   moa2 = f68 * 1.5 - f70 * 0.5
   f78 = Hg * f78[1] + Kg * moa2
   f80 = Kg * f78 + Hg * f80[1]
   moaOut = f78 * 1.5 - f80 * 0.5
   //--resultado
   IF moaOut <> 0 THEN
      rsxRaw = (momOut / moaOut + 1) * 50
   ELSE
      rsxRaw = 50
   ENDIF
   rsxVal = MAX(MIN(rsxRaw, 100), 0)
ENDIF

//===Rapid RSI (nativo con summation)===
upMov = MAX(closer - closer[1], 0)
dnMov = MAX(closer[1] - closer, 0)
upSumR = summation[rsiPeriod](upMov)
dnSumR = summation[rsiPeriod](dnMov)
IF dnSumR = 0 THEN
   rapidRsi = 100
ELSIF upSumR = 0 THEN
   rapidRsi = 0
ELSE
   rapidRsi = 100 - 100 / (1 + upSumR / dnSumR)
ENDIF

//===Selector RSI===
IF rsiTypeOpt = 0 THEN
   rawRsi = wildersRsi
ELSIF rsiTypeOpt = 1 THEN
   rawRsi = rsxVal
ELSE
   rawRsi = rapidRsi
ENDIF

//===QQE — requiere histórico mínimo (rsiPeriod + smoothing)===
warmupBars = rsiPeriod + RsiSmoothingFactor + 2

IF BarIndex < warmupBars THEN
   //--Seeds iniciales: oscilador en línea media, trends iguales (sin disparar)
   rsiMA = 50
   MaAtrRsi = 0
   outerJ = 0
   emaf = 0
   emas = 0
   TrendSlow = 50
   TrendFast = 50
ELSE
   //--rsiMA: EMA del RSI elegido
   rsiMA = average[RsiSmoothingFactor, 1](rawRsi)
   //--MaAtrRsi: Wilder del |delta rsiMA|
   atrRsiIn = ABS(rsiMA[1] - rsiMA)
   MaAtrRsi = average[rsiPeriod, 3](atrRsiIn)
   outerJ = average[rsiPeriod, 3](MaAtrRsi)
   emaf = outerJ * WPFast
   emas = outerJ * WPSlow

   //--QQE Slow Trend
   trS = TrendSlow[1]
   dvS = trS
   IF rsiMA < trS THEN
      trS = rsiMA + emas
      IF rsiMA[1] < dvS AND trS > dvS THEN
         trS = dvS
      ENDIF
   ENDIF
   IF rsiMA > trS THEN
      trS = rsiMA - emas
      IF rsiMA[1] > dvS AND trS < dvS THEN
         trS = dvS
      ENDIF
   ENDIF
   TrendSlow = trS

   //--QQE Fast Trend
   trF = TrendFast[1]
   dvF = trF
   IF rsiMA < trF THEN
      trF = rsiMA + emaf
      IF rsiMA[1] < dvF AND trF > dvF THEN
         trF = dvF
      ENDIF
   ENDIF
   IF rsiMA > trF THEN
      trF = rsiMA - emaf
      IF rsiMA[1] > dvF AND trF < dvF THEN
         trF = dvF
      ENDIF
   ENDIF
   TrendFast = trF
ENDIF

//===Coloreo===
IF rsiMA > TrendSlow AND rsiMA > TrendFast THEN
   rC = 45
   gC = 210
   bC = 4
ELSIF rsiMA < TrendSlow AND rsiMA < TrendFast THEN
   rC = 210
   gC = 4
   bC = 45
ELSE
   rC = 128
   gC = 128
   bC = 128
ENDIF

return rsiMA AS "RSI MA" COLOURED(rC, gC, bC) STYLE(line, 3), TrendSlow AS "Slow Trend" COLOURED(220, 200, 0) STYLE(dottedline, 1), TrendFast AS "Fast Trend" COLOURED(255, 255, 255) STYLE(line, 1), 50 AS "Midline" COLOURED(120, 120, 120) STYLE(dottedline), overbought AS "Overbought" COLOURED(0, 200, 200), oversold AS "Oversold" COLOURED(200, 200, 200)
