

MCDX Indicator — Banker, Hot Money and Retail Activity
The MCDX (Market Composite Detector) is a lower-window oscillator that tries to break a single price series into the footprints of three different types of market participants: the Banker (institutional / “smart” money), the Hot Money (aggressive short-term speculation) and the Retailer (the crowd). Rather than plotting one line, it stacks three histograms so you can compare, bar by bar, which kind of money is currently driving the move.
The whole construction is built on a single, well-understood building block — the RSI — applied with different periods and rescaled to a common 0–20 range. The result is a compact “who-is-in-control” panel that pairs naturally with any price-based method.
How Does It Work?
Each of the two computed hands is a Relative Strength Index measured over its own period and then linearly rescaled:
value = sensitivity * ( RSI[period](close) - base )
- The base shifts the neutral point of the RSI. Subtracting it means only the part of the RSI above that base contributes to the reading.
- The sensitivity amplifies (or dampens) the remaining signal.
- The result is then clamped to the [0, 20] range: anything above 20 is capped at 20, anything below 0 is floored at 0.
The Banker uses a long RSI period (50) with a high base (50) and a strong sensitivity (1.5), so it only lights up when sustained, deep strength is present — the kind of persistent pressure associated with institutional accumulation. The Hot Money uses a shorter period (40) with a lower base (30) and a gentler sensitivity (0.7), so it reacts earlier and more often to fast, speculative pushes.
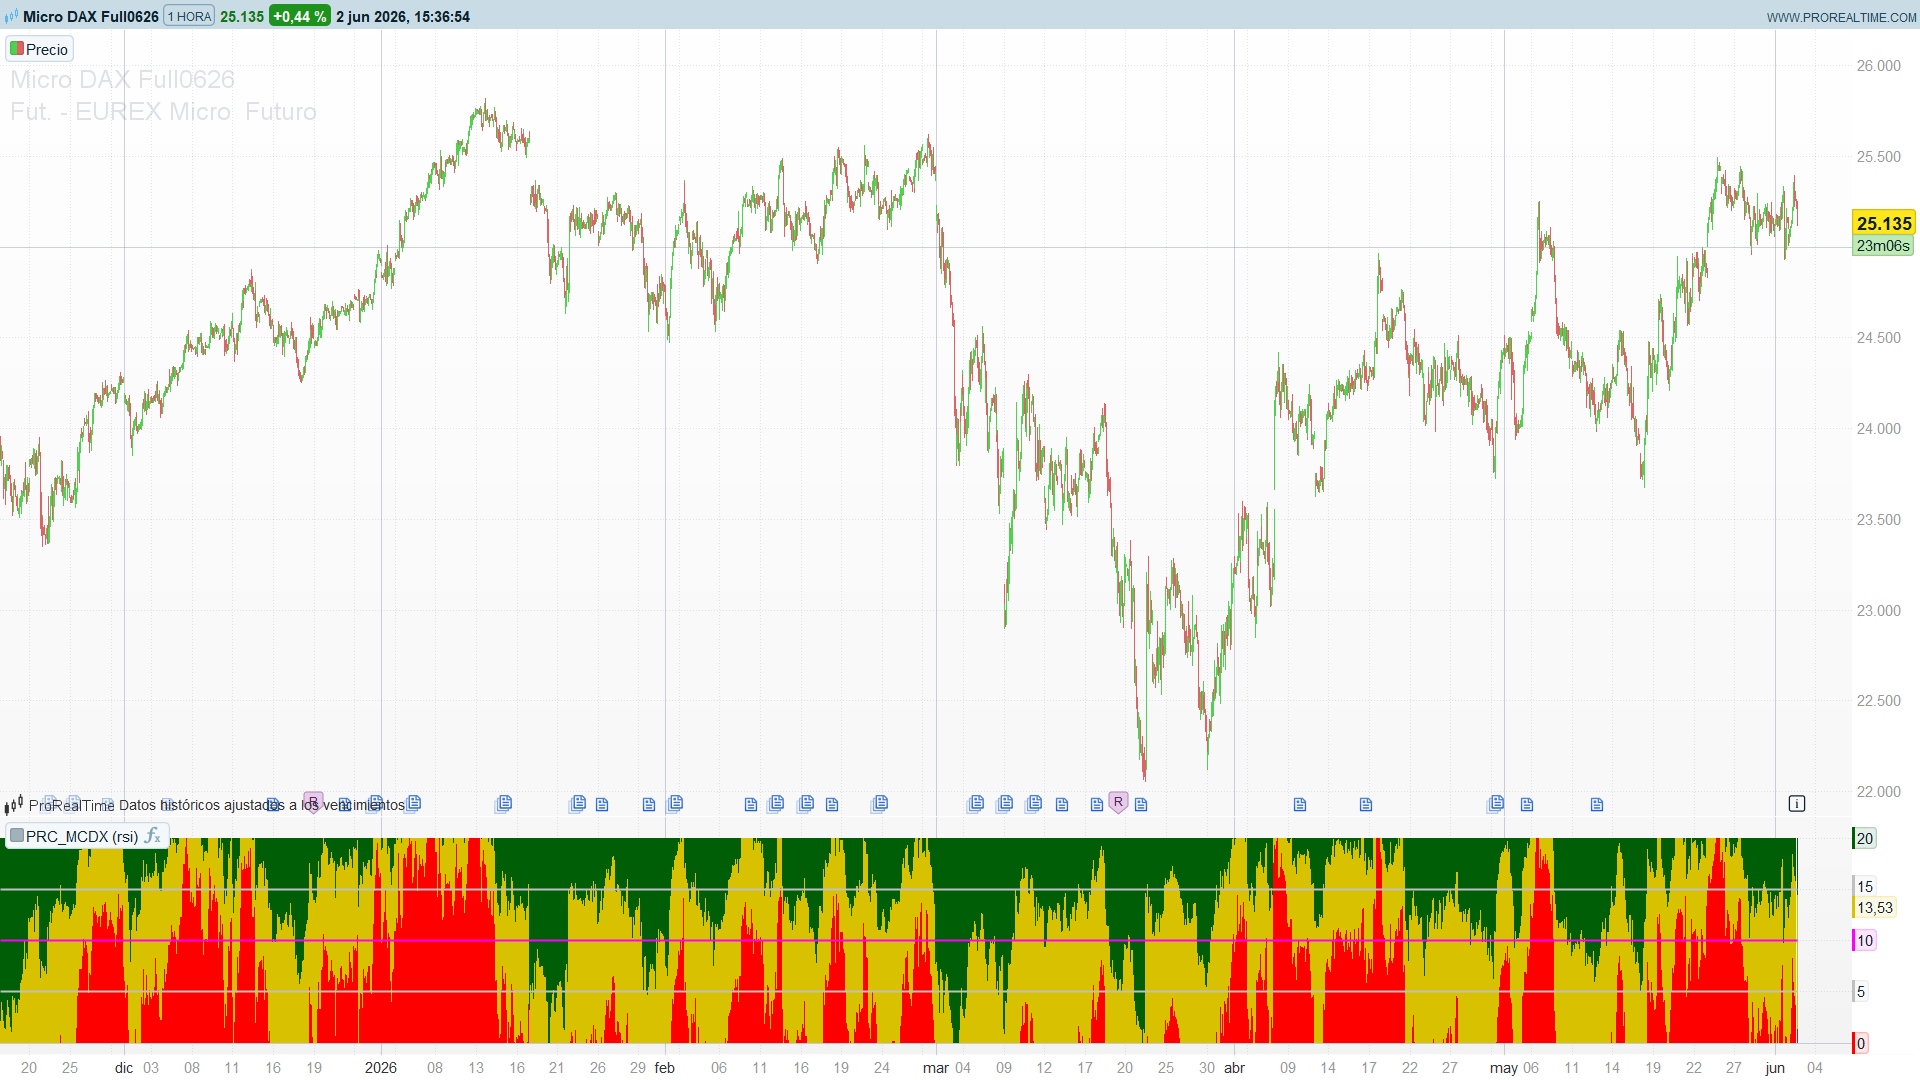
The Retailer is not a calculation at all: it is a fixed line plotted at the constant value 20. It acts as the visual ceiling of the panel — the reference height against which the Banker and Hot Money histograms are read. Three horizontal reference lines at 5, 10 and 15 complete the scale so you can judge the magnitude of each histogram at a glance.
How to Read the Indicator
- Tall red bars (Banker) — sustained underlying strength. The more red bars stacking up near the top of the panel, the stronger the case that institutional money is present in the move.
- Tall yellow bars (Hot Money) — fast speculative interest. Useful as an early, noisier signal that often precedes or accompanies the Banker reading.
- Relative height — the indicator is read comparatively. Hot Money rising while Banker stays low suggests a move driven by short-term speculation that lacks institutional backing; both rising together suggests broader participation behind the trend.
- The fixed Retailer line at 20 and the 5 / 10 / 15 lines give you the gridlines to gauge how extended each histogram really is.
Parameters
RSIPeriodBanker: 50 – RSI period for the Banker hand. Longer = slower, only reacts to sustained strength.
RSIBaseBanker: 50 – Neutral level subtracted from the Banker RSI before rescaling.
SensivityBanker: 1.5 – Amplification factor for the Banker reading.
RSIPeriodHotMoney: 40 – RSI period for the Hot Money hand. Shorter = faster, more reactive.
RSIBaseHotMoney: 30 – Neutral level subtracted from the Hot Money RSI before rescaling.
SensivityHotMoney: 0.7 – Amplification factor for the Hot Money reading.
Code
//-----------------------------------------------------------------//
//PRC_MCDX (rsi)
//version = 0
//09.07.2024
//Iván González @ www.prorealcode.com
//Sharing ProRealTime knowledge
//-----------------------------------------------------------------//
//-----Inputs------------------------------------------------------//
RSIBaseBanker=50 //Banker Base
RSIPeriodBanker=50 //Banker RSI Period
RSIBaseHotMoney=30 //Hot Money RSI base
RSIPeriodHotMoney=40 //Hot Money RSI Period
SensivityBanker=1.5 //Sensivity banker
SensivityHotMoney=0.7 //Sensivity Hot Money
//-----------------------------------------------------------------//
//-----RSI Banker--------------------------------------------------//
rsiBanker=SensivityBanker*(rsi[RSIPeriodBanker](close)-RSIBaseBanker)
if rsiBanker>20 then
   rsiBanker=20
elsif rsiBanker<0 then
   rsiBanker=0
endif
//-----------------------------------------------------------------//
//-----RSI HotMoney------------------------------------------------//
rsiHotMoney=SensivityHotMoney*(rsi[RSIPeriodHotMoney](close)-RSIBaseHotMoney)
if rsiHotMoney>20 then
   rsiHotMoney=20
elsif rsiHotMoney<0 then
   rsiHotMoney=0
endif
//-----------------------------------------------------------------//
//-----------------------------------------------------------------//
return 20 as "Retailer" coloured(0,94,7)style(histogram), rsiHotmoney as "Hot Money" coloured(216,194,0)style(histogram), rsiBanker as "Banker" coloured(255,0,0)style(histogram), 5 as "5" coloured("silver")style(line,2), 10 as "10" coloured("fuchsia")style(line,2),15 as "15"coloured("silver")style(line,2)
