Bollinger Bands Stochastic RSI Extreme Signal
Mean-reversion at the bands is one of the oldest ideas in technical analysis: when price pierces a Bollinger Band, it is statistically far from its short-term mean, and a snap-back becomes more likely. The weakness of using Bollinger Bands alone is that strong trends spend long stretches walking the upper or lower band, producing a stream of false reversal signals.
The Bollinger Bands Stochastic RSI Extreme Signal addresses this by demanding that two unrelated extremes happen at the same time: price must be returning back inside the band and the Stochastic RSI must be in overbought or oversold territory. The setup only fires when price stretch and momentum extreme align, which filters out the long band-walks of trending markets and isolates the moments when a counter-move is most plausible.
Theory Behind the Indicator
Bollinger Bands as a stretch gauge
The bands are computed on the standard recipe: a 20-period simple moving average of the close as the basis, plus and minus two standard deviations of the same series. A close outside the upper or lower band marks a statistically extended condition relative to recent price action.
Stochastic RSI as a momentum extreme
The Stochastic RSI is a second-order oscillator. First, a standard RSI is computed on the source. Then a Stochastic transformation is applied to that RSI: the indicator looks at where the current RSI value sits within its own high–low range over the last lengthStoch bars and rescales it to a 0–100 reading. The K line is a short smoothing of that ratio; the D line is a smoothing of K.
The result is an oscillator that registers extremes in the RSI itself, not in price. When K and D both move above 90 the underlying RSI is at the top of its recent range; below 10 the RSI is at the bottom. These are deeper extremes than a raw RSI reading and tend to mark genuine momentum exhaustion.
The signal logic
The indicator fires a bearish triangle when all of the following are true on the current bar:
- The previous bar closed above the upper Bollinger Band.
- The current bar closes back inside the upper Bollinger Band.
- The previous bar’s K and D of the Stochastic RSI were both above the overbought threshold (default 90).
A bullish triangle is the symmetric case at the lower band with K and D below the oversold threshold (default 10).
The first two conditions together mean the price has just made a failed excursion outside the band — it pierced and came back. The third condition adds momentum confirmation: that excursion happened while the Stochastic RSI was already at an extreme. The combination is rare on purpose; it is designed to flag pivots, not provide a continuous stream of signals.
Key Features at a Glance
- Overlay indicator: plots directly on the price chart with the Bollinger Bands.
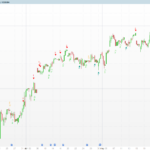
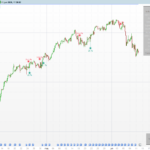
- Visual triangles on bars where price snaps back inside a band while the Stochastic RSI is at an extreme.
- Triangle offset is anchored to the current ATR, so signals stay visible across instruments of very different volatility (forex, indices, futures).
- Optional colour fill between the upper and lower bands for quick visual orientation.
- Boolean flags to toggle the colour fill and the signal markers independently.
How to Read the Indicator
The two triangles carry a clear directional bias:
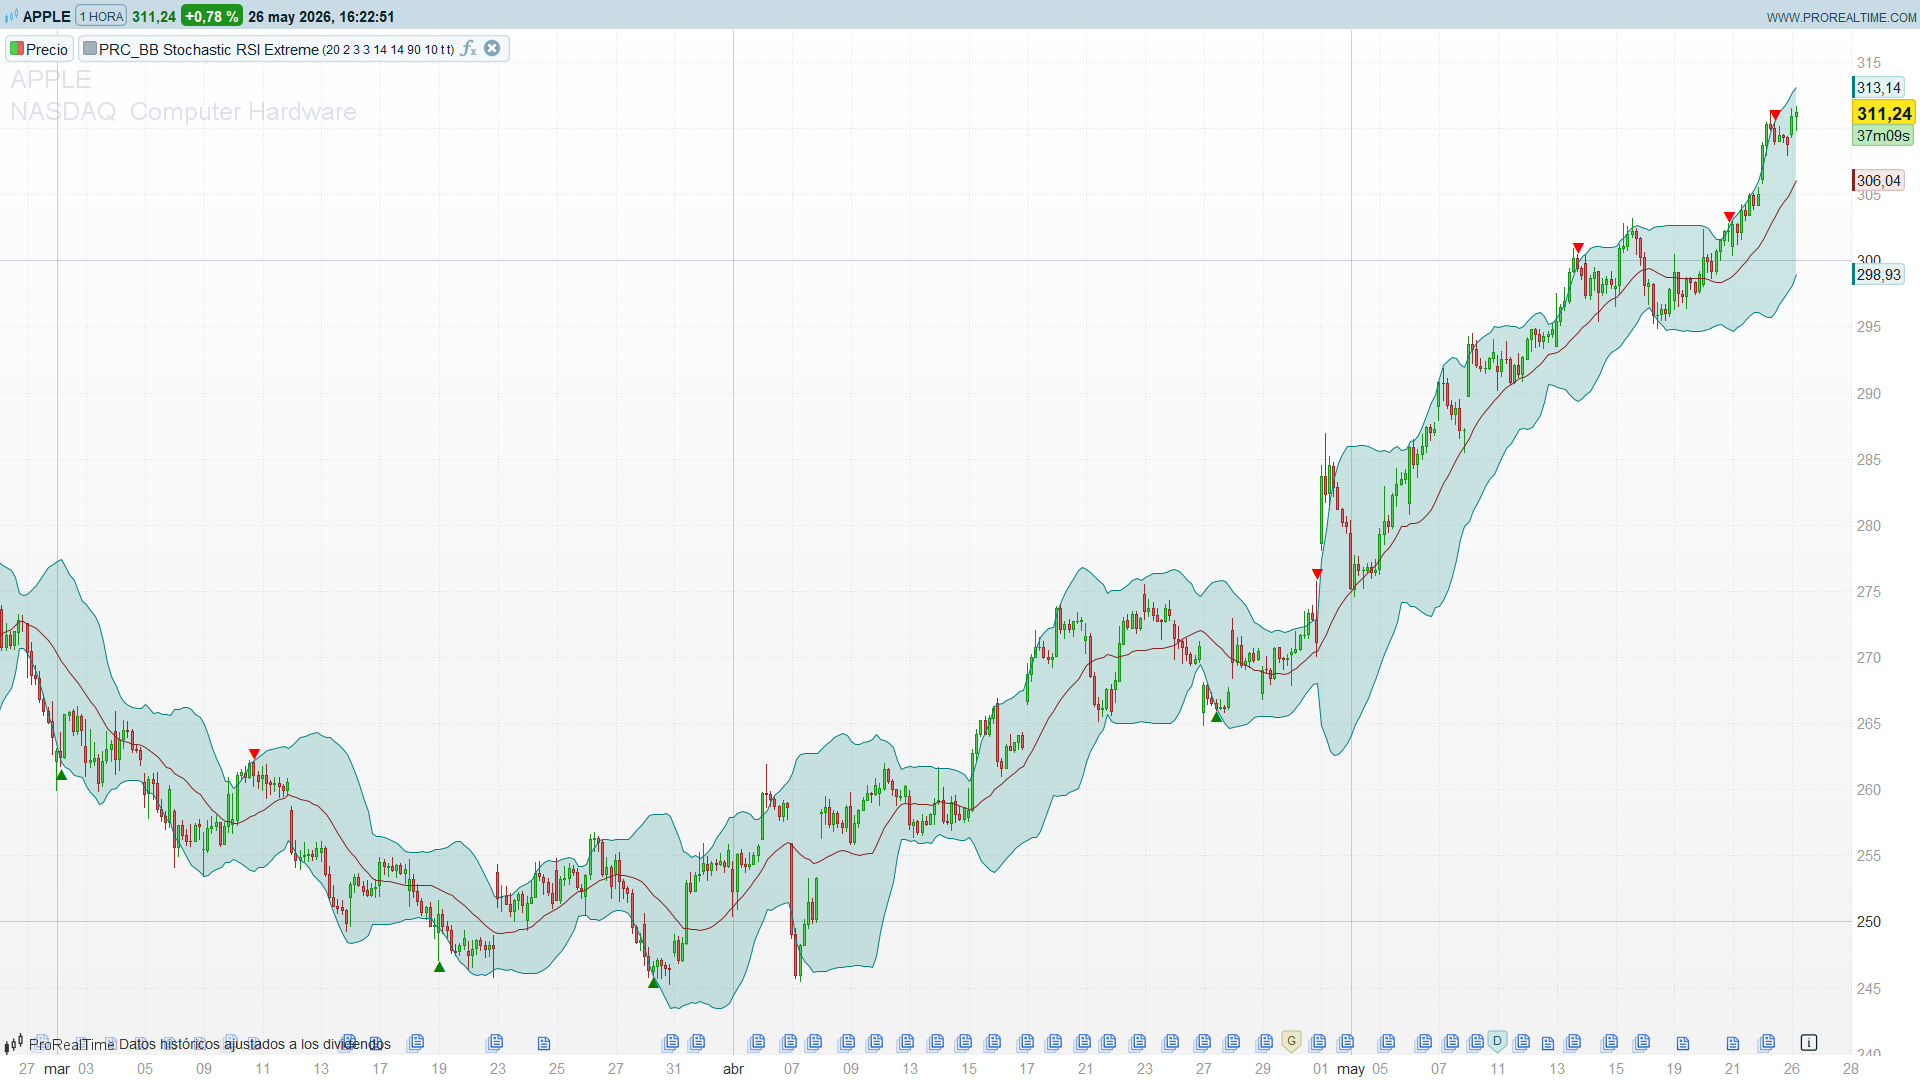
- Red triangle above the bar — price has just rejected the upper band while the Stochastic RSI was overbought. The market is showing both stretch and momentum exhaustion to the upside. Read this as a short-term reversion warning, not a trend reversal.
- Green triangle below the bar — price has just rejected the lower band while the Stochastic RSI was oversold. Symmetric reasoning applies to the downside.
The signals are bar-confirmed: they appear when the current bar closes, not intrabar, so there is no repainting. In strongly trending markets the signal becomes naturally rare because the Stochastic RSI tends to stay pinned at the extreme rather than briefly visiting it — that is by design, not a defect.
Practical Applications
- Mean-reversion entries in ranging markets. The cleanest use of the signal is in sideways or rotational conditions. A bullish triangle that appears while price oscillates around a flat 200-period moving average is a textbook fade entry.
- Pullback timing inside a trend. In a long-term uptrend, ignore the bearish triangles and use the bullish ones as timing for buying the dip. Symmetric logic for downtrends.
- Confluence with structure. Triangles that print at a prior support or resistance level, or at a swing-pivot retest, carry much more weight than triangles in mid-range.
- Alert source. The Boolean expressions bear and bull inside the code can be wired into the platform’s alert module to receive notifications without watching the chart.
- Filter for other systems. Use the triangles as a permission filter for an existing strategy: only take long signals when a recent bullish triangle is still in memory, and vice versa.
Indicator Configuration
- length (default: 20) — period of the Bollinger Bands SMA and standard deviation.
- mult (default: 2) — number of standard deviations for the band offset.
- lengthRSI (default: 14) — period of the underlying RSI.
- lengthStoch (default: 14) — lookback used to rescale the RSI inside its own high–low range.
- smoothK (default: 3) — smoothing of the raw stochastic-of-RSI series into the K line.
- smoothD (default: 3) — smoothing of K into the D line.
- upperlimit (default: 90) — overbought threshold for both K and D.
- lowerlimit (default: 10) — oversold threshold for both K and D.
- colorbands (default: 1) — 1 paints the area between the upper and lower bands; 0 hides it.
- showsignals (default: 1) — 1 prints the triangles on qualifying bars; 0 hides them.
Code
//--------------------------------------------------------------------//
//PRC_BB Stochastic RSI Extreme Signal
//version = 0
//28.06.24
//Iván González @ www.prorealcode.com
//Sharing ProRealTime knowledge
//--------------------------------------------------------------------//
//-----Inputs---------------------------------------------------------//
src=close
length=20
mult=2
smoothK=3
smoothD=3
lengthRSI=14
lengthStoch=14
upperlimit=90
lowerlimit=10
colorbands=1
showsignals=1
//-----Bollinger Bands------------------------------------------------//
basis=average[length](src)
dev=mult*std[length](src)
upper=basis+dev
lower=basis-dev
//-----Stochastic RSI (manual reconstruction)-------------------------//
rsi1=rsi[lengthRSI](src)
maxrsi=highest[lengthStoch](rsi1)
minrsi=lowest[lengthStoch](rsi1)
osc=(rsi1-minrsi)/(maxrsi-minrsi)*100
k=average[smoothK](osc)
d=average[smoothD](k)
//-----Signal logic---------------------------------------------------//
bear=close[1]>upper[1] and close<upper and k[1]>upperlimit and d[1]>upperlimit
bull=close[1]<lower[1] and close>lower and k[1]<lowerlimit and d[1]<lowerlimit
//-----Visuals--------------------------------------------------------//
if bear and showsignals then
   drawtext("▼",barindex,high+0.25*averagetruerange[14](close))coloured("red")
elsif bull and showsignals then
   drawtext("▲",barindex,low-0.25*averagetruerange[14](close))coloured("green")
endif

if colorbands then
   colorbetween(upper,lower,"teal",50)
endif
//--------------------------------------------------------------------//
return basis as "SMA" coloured(135,35,35), upper as "BB top" coloured("teal"), lower as "BB bot" coloured("teal")