







3 Linear regression tapes indicator
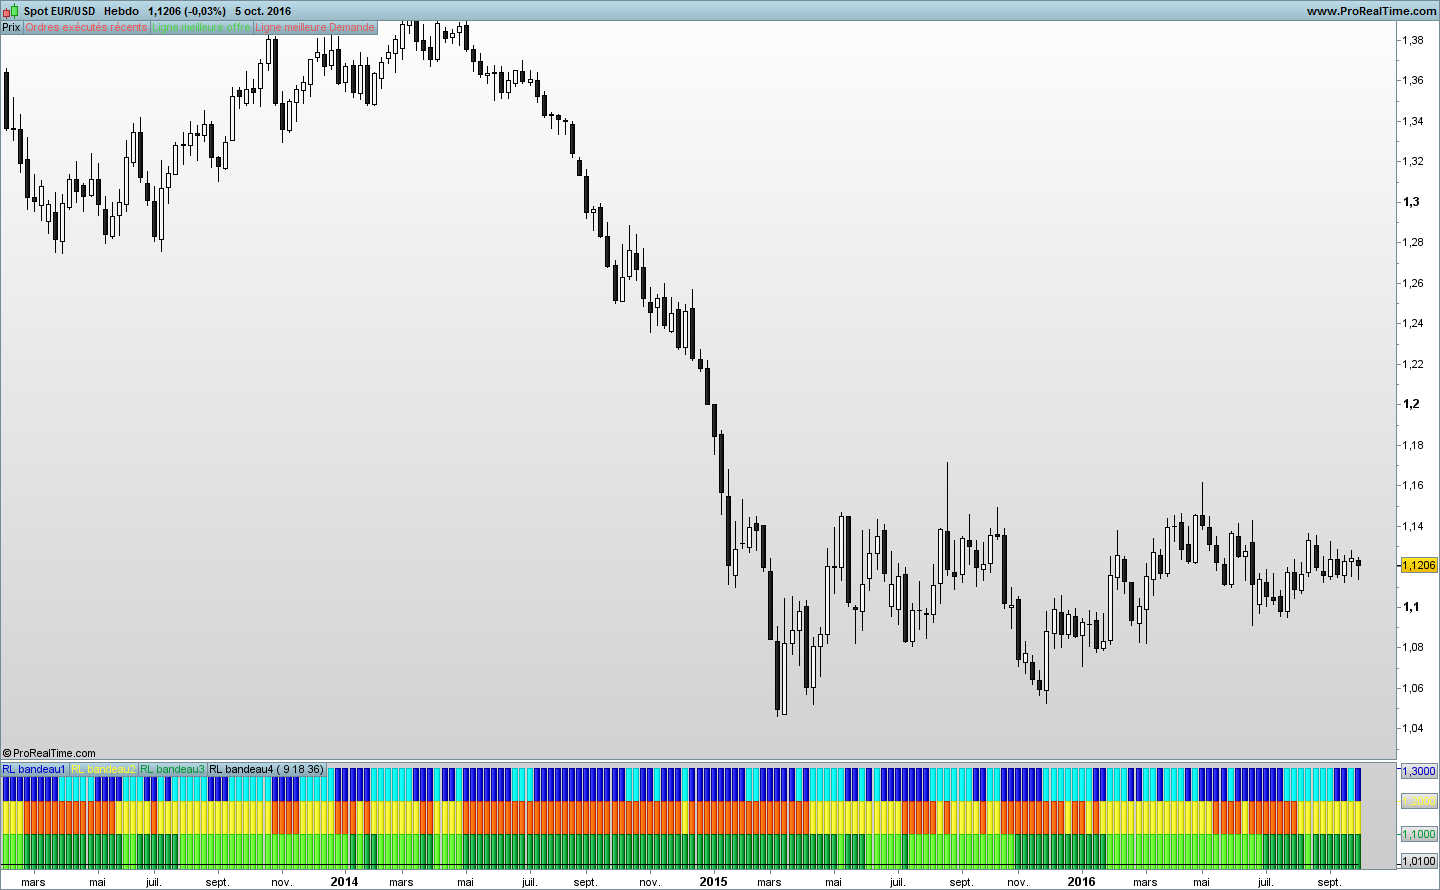
Tape indicator made of 3 linear regression trend of 3 different periods.
This indicator was made in French forums with the help of supertiti and Nicolas
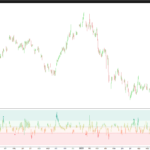
The trends information s take place under the chart with different colours to have a better clear view of what happen on chart without the linear regression lines on it.
// Courbe  de régresssion linéaire bandeau
// Réalisation collégiale
// Mettre  "periode1, periode2 et periode3" en variable

periode1 = 10
periode2 = 14
periode3 = 30
//___________________________________________

RLx1 = LinearRegression[periode1](close)

// Création du bandeau
If RLx1[0] > RLx1[1] then
 color1 = 1.3
Elsif RLx1[0] < RLx1[1] then
 color1 = -1.3
Endif

//____________________________________________
RLx2 = LinearRegression[periode2](close)

// Création du bandeau 2
If RLx2[0] > RLx2[1] then
 color2 = 1.2
Elsif RLx2[0] < RLx2[1] then
 color2 = -1.2
Endif

//____________________________________________
RLx3 = LinearRegression[periode3](close)

// Création du bandeau 3
If RLx3[0] > RLx3[1] then
 color3 = 1.1
Elsif RLx3[0] < RLx3[1] then
 color3 = -1.1
Endif

//____________________________________________
//Création du bandeau 4 qui ne sert qu'à obtenir une égale hauteur d'histogrammes pour les 3 courbes précédentes

RLx4 = LinearRegression[2](close)
If RLx4[0] > RLx4[1] then
 color4 = 1.01
Elsif RLx4[0] < RLx4[1] then
 color4 = -1.01
Endif

//____________________________________________

Return  1.3 coloured by color1 as "RL bandeau1", 1.2 coloured by color2 as "RL bandeau2", 1.1 coloured by color3 as "RL bandeau3", 1.01 coloured by color4
Comments
You must be logged in to post a comment.




thanks you very much!
It wont work on my PRT. Only 4 black lines in the indicator but no colours....
Hello,
Attention : the English part is a translation “Reverso” of the text written in French.
To obtain the aspect of the indicator which you visualize on PRC, it is necessary to you to activate the window "Properties" by clicking the icon "adjustable spanner" situated in the window of the indicator in quoted by the name of the indicator.
Click RL headband 1.
The window Properties opens.
To click the icon Chains to separate Positive and negative.
Click Positive and to choose the color.
Do the same for negative.
You can modify the line and his thickness.
Click Style and choose Histogram in the drop-down menu which has just opened.
Redo this series of manipulation for RL headband 2 and RL headband 3.
Do not modify RL headband 4.
Normally, you should find these basic manipulations in the documentation of PRT.
Good luck.
C'est en forgeant que l'on devient forgeron et c'est en sciant que Léonard De VINCI !!!
Ruddy
Attention : the English part is a translation "Reverso" of the text written in French.
The clear colors correspond to the ascending linear curves of regression and the dark in the downward linear curves of regression.
Entered the purchase : when 3 headbands become clear.
Exit : when 2 headbands become dark.
Entered the sale and taken out of sale: inverse conditions of the previous ones.
__________________________________________________________________
Les couleurs claires des bandeaux correspondent aux courbes de régression linéaire ascendantes et les couleurs foncées aux courbes de régression linéaire descendantes.
Entrée à l'achat : quand les 3 bandeaux deviennent de couleur claire.
Sortie d'achat : quand 2 des bandeaux deviennent de couleur foncée.
Entrée à la vente et sortie de vente : conditions inverses des précédentes.

Fantastic work here. This is fantastic for entry spotting.