







Line Regression Intercept (LRI) with State-Coloured Candles
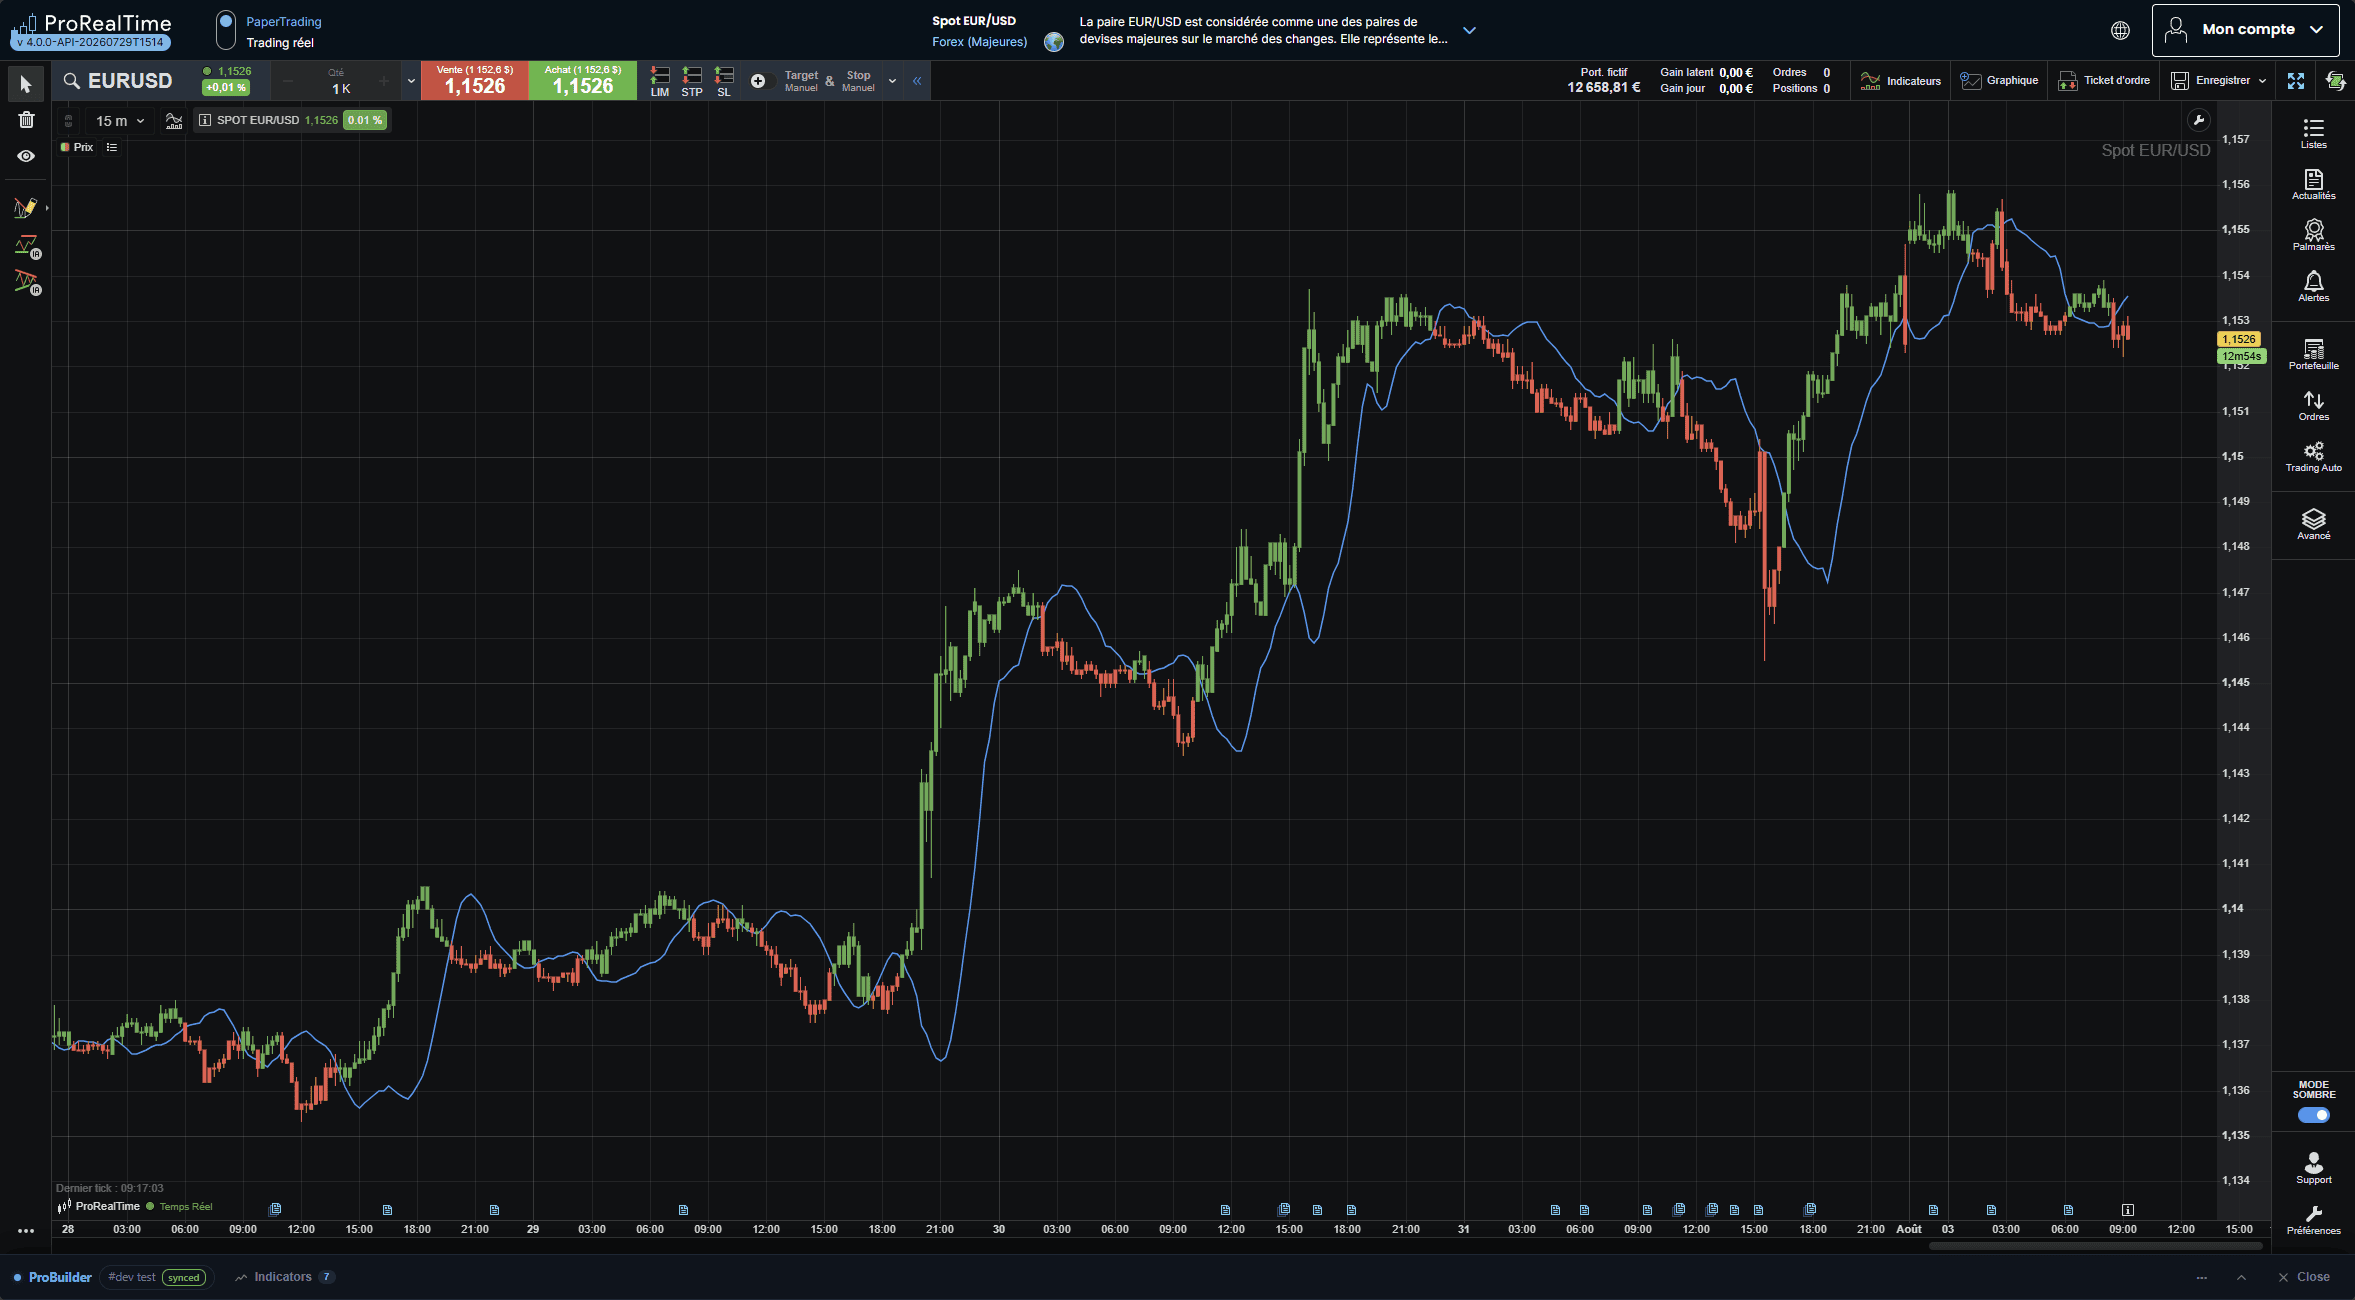
The Line Regression Intercept fits a least-squares straight line through the last 14 closes and plots the intercept of that fit — that is, the fitted value at the oldest bar of the window rather than at the current bar. Because the intercept lags the fit by the full window length, the resulting curve sits well behind price and behaves like a slow, statistically-derived baseline: price spends long stretches on one side of it, and crossings are comparatively rare and meaningful.
On top of the line, the indicator maintains a simple state variable: +1 while the close is above the LRI, -1 while it is below, and it holds its previous value when neither is true. That state is used to redraw each candle in a matching colour (green above, red below, blue while the state is still neutral), so the bias is readable at a glance without a second pane.
Based on an idea by HPotter.
Description
The indicator computes an ordinary least-squares regression of the close against the bar offset i, where i = 0 is the current bar and i = Length-1 is the oldest bar of the window. Working in “bars ago” units lets both regression sums be built directly from indexed price reads.
Because the x-values are always the fixed integer sequence 0, 1, 2, … Length-1, the two x-only sums are constants and can be evaluated in closed form instead of being accumulated in a loop:
- the sum of
iover the window isL*(L-1)/2 - the sum of
i^2over the window is(L-1)*L*(2L-1)/6
Only the cross-product term SUM(i * close[i]) genuinely depends on price and therefore needs the FOR loop. The price sum itself is delegated to the built-in Summation[N](price), which totals a chosen price over N periods — cheaper and clearer than a second loop.
Variable by variable:
- Length: the regression window, fixed at 14 bars. Change this single constant to lengthen or shorten the fit.
- xX: the closed-form sum of the bar offsets,
L*(L-1)/2. For L = 14 this is 91. - xDivisor: the denominator of the slope,
xX^2 - L * SUM(i^2). It is a pure constant and it is negative (-3185 for L = 14), which is what converts the “bars ago” slope into a forward-in-time slope without an explicit sign flip. - xXY: the cross-product term, accumulated in the loop as
xXY + i * close[i]. - xSum:
Summation[Length](close), the total of the closes across the window. - xSlope: the fitted slope,
(Length * xXY - xX * xSum) / xDivisor. - xLRI: the plotted intercept,
(xSum - xSlope * xX) / Length— algebraically the mean close minus the slope times the mean offset, i.e. the fitted value at the oldest bar of the window. - pos: the state carry, +1 / -1 / previous value.
- cR, cG, cB: the RGB triplet handed to
DRAWCANDLEfor the current bar.
Two details are worth pointing out because they are easy to get wrong.
First, the warm-up. The whole regression block is guarded by IF barindex >= Length - 1, and xLRI is initialised to undefined before it. In ProBuilder an unassigned variable silently reads as 0, which would drag the plot down to the zero line and make every early bar register as “close above the LRI”. Assigning undefined instead keeps those bars off the chart entirely and keeps them out of the indicator’s scaling. Note the standard restriction: undefined is assigned once, at the top, before the variable ever receives a real value.
That same choice drives the state machine for free. While xLRI is undefined, both close > xLRI and close < xLRI evaluate false, so pos falls through to pos[1], which reads 0 on the very first bar — a clean neutral start with no special-casing.
Second, the price source. To fit something other than the close, replace the close[i] inside the loop and the close passed to Summation directly. Do not alias the price into a user variable and then index that variable: an out-of-history read on a user variable returns 0 silently, whereas close[i] correctly returns undefined and the guard behaves as intended.
Finally, the candle colouring. A ProBuilder indicator cannot repaint the chart’s own candles, so the code draws an identically-shaped candle on top of each bar with DRAWCANDLE(open, high, low, close), using COLOURED for the body and BORDERCOLOR for the outline so the overlay covers the original completely.
Code
REM Original concept and logic by HPotter (v1.1, 30/05/2020).

REM ------------------------------------------------------------------
REM Line Regression Intercept (LRI)
REM Least-squares fit over a fixed 14-bar window. The indicator plots
REM the fitted value at the OLDEST bar of the window (the intercept).
REM
REM Display note: add this indicator with "price scale / on the chart"
REM ticked, otherwise the LRI line lands in a separate sub-window.
REM
REM The window length is frozen as a constant below -- edit it here.
REM To fit another price than close, replace every "close[i]" / "close"
REM occurrence in the xXY loop and in Summation below. Do NOT alias the
REM price to a user variable and index that variable: an out-of-history
REM read on a user variable silently returns 0, whereas close[i]
REM correctly returns undefined.
REM ------------------------------------------------------------------

Length = 14

REM ------------------------------------------------------------------
REM Least-squares constants over the window i = 0 .. Length-1, where i
REM is "bars ago" (i = 0 is the current bar).
REM xX = SUM(i) = L*(L-1)/2
REM xDivisor = xX^2 - L*SUM(i^2), where SUM(i^2) = (L-1)*L*(2L-1)/6
REM Verified on this engine for L = 14: xX = 91, xDivisor = -3185.
REM ------------------------------------------------------------------
xX = Length * (Length - 1) * 0.5
xDivisor = xX * xX - Length * Length * (Length - 1) * (2 * Length - 1) / 6

REM No value until the window is full. UNDEFINED is the correct marker
REM here; an unassigned variable would silently read 0 instead.
xLRI = undefined

IF barindex >= Length - 1 THEN

REM Cross-product term: sum of i * price[i] over the window.
xXY = 0
FOR i = 0 TO Length - 1 DO
xXY = xXY + i * close[i]
NEXT

xSum = Summation[Length](close)

REM Slope of the fit in FORWARD time: xDivisor is negative, which
REM flips the sign of the bars-ago slope.
xSlope = (Length * xXY - xX * xSum) / xDivisor

REM Intercept = fitted value at the OLDEST bar of the window
REM = mean(price) - xSlope * mean(i)
xLRI = (xSum - xSlope * xX) / Length

ENDIF

REM ------------------------------------------------------------------
REM pos state carry: +1 above the line, -1 below, otherwise hold the
REM previous state. During warm-up xLRI is undefined, so BOTH
REM comparisons are false and pos falls through to pos[1], which reads
REM 0 on the very first bar.
REM ------------------------------------------------------------------
IF close > xLRI THEN
pos = 1
ELSIF close < xLRI THEN
pos = -1
ELSE
pos = pos[1]
ENDIF

REM ------------------------------------------------------------------
REM Candle recolouring. A ProBuilder indicator cannot repaint the
REM chart's own candles, so an identically-shaped candle is redrawn on
REM top of each bar with the state colour: red below the line, green
REM above, blue while the state is still neutral.
REM ------------------------------------------------------------------
IF pos = -1 THEN
cR = 255
cG = 82
cB = 82
ELSIF pos = 1 THEN
cR = 76
cG = 175
cB = 80
ELSE
cR = 33
cG = 150
cB = 243
ENDIF

DRAWCANDLE(open, high, low, close) COLOURED(cR, cG, cB) BORDERCOLOR(cR, cG, cB)

RETURN xLRI COLOURED(33, 150, 243) AS "LRI"
How to use
Create a new indicator, paste the code, and add it to the chart with “price scale / on the chart” ticked. This matters: the code uses no DEFPARAM, so without that option the LRI line is sent to a sub-window while the redrawn candles stay on the main chart, and the two never line up.
What you see:
- the blue line is the regression intercept — a slow baseline trailing the price;
- green candles mean the close is above the line (bullish state);
- red candles mean the close is below it (bearish state);
- blue candles only appear during the warm-up, before the 14-bar window has filled.
Practical use: treat a colour flip as a change of bias rather than a trade signal on its own. Because the intercept is the fit evaluated at the oldest bar of the window, the line reacts slowly and flips are infrequent — useful as a trend filter layered under a faster entry trigger (a momentum oscillator, a breakout of the previous range, a shorter moving average cross), or as a directional gate that only allows longs while the state is +1.
Tuning: raise Length for a smoother, later-flipping baseline on higher timeframes; lower it for a more reactive line on intraday charts. Values below about 5 make the fit noisy enough that the colour alternates constantly. The colour constants are plain RGB triplets — edit cR, cG, cB if the palette clashes with your chart theme.
Before relying on it: step through the first 20 bars of a fresh chart and confirm the line only starts once the window is full, then check the flips on a couple of instruments and timeframes you actually trade. If you build a strategy around the state, backtest the pos condition on its own first so you can see how much of the result comes from the filter rather than from your entry logic.
Bonjour Nicolas. Intéressant . Merci.