Adaptive Regression Breakout Map
Introduction
A regression channel tells you where price sits relative to its own trend. A squeeze indicator tells you when volatility has compressed. Put the two together and you get the setup half the breakout literature is built on: wait for the channel to narrow, then take the side that breaks first.
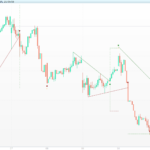
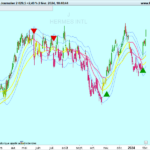
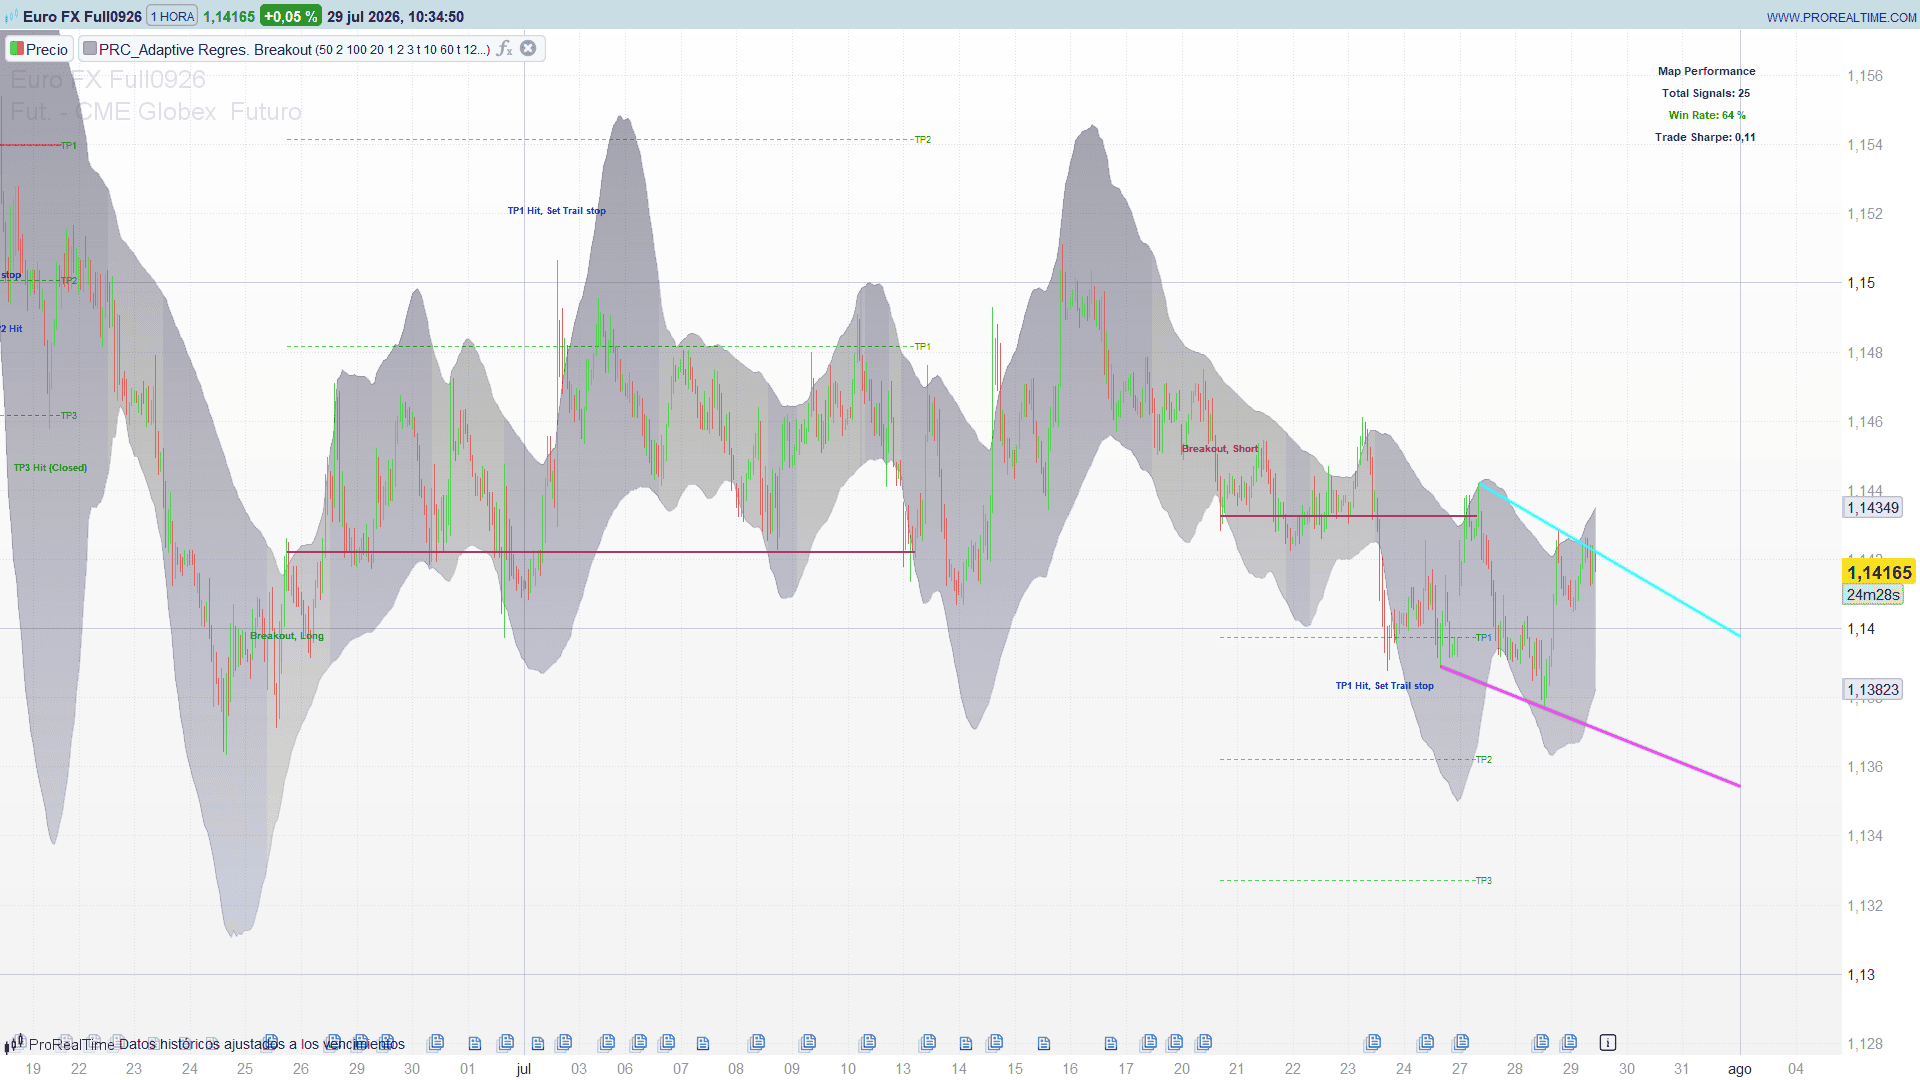
This indicator (by GainzAlgo) does that, and then does something most breakout tools leave to your imagination — it draws the whole trade. When a breakout fires, you get the entry, a stop on the far band, three targets spaced at multiples of the channel width, and labels marking every event as it happens: target one reached and stop moved to breakeven, target two reached and stop moved up again, target three reached and the trade closed, or stopped out. Past trades stay on the chart. A top-right panel keeps a running count.
It is a price overlay and it works on any instrument and timeframe with enough history.
The Channel
Nothing exotic:
basis  = linear regression of the close over 50 bars
band   = basis ± 2 × standard deviation of the close over the same 50 bars
width  = upper band − lower band
The regression line is the endpoint of a least-squares fit through the last fifty closes, which makes the centre of the channel follow the slope of the trend instead of lagging behind it the way a moving average does. In ProBuilder both pieces are native — LinearRegression[50](close) and std[50](close) — so this part translates one for one.
The Adaptive Part: A Squeeze Measured Against Itself
Here is where the indicator earns the word “adaptive”, and it is worth understanding because it is the piece that decides whether you get five signals a year or fifty.
The width of the channel is not compared against a fixed threshold. It is compared against its own range over the last hundred bars:
widthPct = (width − lowest width in 100 bars) / (highest width − lowest width) × 100
squeeze  = widthPct ≤ 20
So the indicator is not asking “is the channel narrow in absolute terms?” — a question that has no portable answer, since a channel two dollars wide is tight on an index future and enormous on a currency pair. It is asking “is the channel narrow compared to how narrow and how wide it has recently been on this instrument?” That is a percentile, and percentiles travel: the same twenty percent threshold behaves sensibly on a stock, a future and a crypto pair without retuning.
The trade-off is the one every normalised measure carries. In a market whose volatility has been slowly collapsing for a hundred bars, the most recent readings sit at the bottom of their own range and the indicator reports squeeze almost continuously. In a market that has been violently unstable, a genuinely tight channel may never reach the bottom twentieth of that range. The metric is relative, and it is only as informative as the hundred bars it is measured against.
The Trigger
long   =  close above the upper band, previous close at or below it, and squeeze on the previous bar
short  =  close below the lower band, previous close at or above it, and squeeze on the previous bar
The squeeze condition is checked on the previous bar, not the current one — necessarily, because the breakout bar itself usually widens the channel enough to end the squeeze. The setup is “it was compressed, and then it broke”, not “it is compressed and breaking at the same time”.
Only one trade runs at a time. While a trade is open no new signal is taken, in either direction.
The Trade Map
When a long fires:
- Entry: the close of the breakout bar
- Stop: the lower band as of the previous bar
- Target 1: entry + 1 × channel width
- Target 2: entry + 2 × channel width
- Target 3: entry + 3 × channel width
Shorts mirror it. Note that both the stop distance and the target spacing come from the same measurement — the width of the channel at the moment of the breakout — so the risk-reward geometry is self-scaling. A breakout from a very tight channel gets a tight stop and correspondingly close targets; a breakout from a wider one gets both stretched. You are not imposing a fixed number of points or a fixed ATR multiple on a market that has just told you how much room it is using.
The stop then moves twice:
- Target 1 touched → stop to breakeven, labelled TP1 Hit, Set Trail stop.
- Target 2 touched → stop to target 1, labelled TP2 Hit.
- Target 3 touched → trade closed, labelled TP3 Hit (Closed).
- Stop touched → trade closed. If target 1 had already been reached the exit is silent, since it is a breakeven or better exit rather than a loss.
Every one of those lines and labels stays on the chart. By default the last twelve completed trades are drawn, which is enough to see the pattern of how the setup has resolved recently without burying the price action.
Read the Statistics Panel With Care
The panel in the top-right corner reports three numbers: total signals, win rate and a “Trade Sharpe” — the mean of the per-trade percentage returns divided by their standard deviation.
They are useful for a quick sense of whether the setup is doing anything on your instrument. They are not a backtest, and there are three specific reasons to keep that in mind before drawing conclusions from them.
A bar that touches target 1 and the stop counts as a win. All the touches are evaluated first, against the original stop. Then target 1 moves the stop to breakeven. Then the trade closes on the stop touch that was detected before the move. The recorded return is zero, and the trade increments the win counter. On volatile intraday bars this is not a rare case.
The win rate does not measure profitable trades. It counts trades that reached target 1 at some point, plus trades that reached target 3. A breakeven exit is an entry in the win column.
There are no costs, no slippage, and intrabar sequencing is decided by the order of the code, not by the order the ticks actually arrived. Entries are taken at the exact close of the breakout bar.
The Sharpe figure is also per trade and not annualised, so it is not comparable with the Sharpe of an equity curve — it is a measure of how consistent the individual trade outcomes are, nothing more.
None of this is a criticism of the tool. A map of where the setup fired and how each one resolved is genuinely useful. It is a reason not to read the win rate as an edge.
The Trendlines
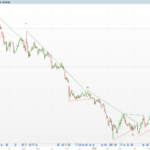
Two extras that have nothing to do with the breakout logic: the last two pivot highs are joined by a cyan line and the last two pivot lows by a magenta one, both projected forward. Pivots use a symmetric ten-bar window, so each one is confirmed ten bars after the fact.
The original draws each line three times with decreasing thickness and increasing transparency, for a glow effect. ProBuilder caps line thickness at 5, so the outermost pass uses 5 instead of 6 — visually indistinguishable. Set showTrend = 0 if you do not want them.
The ProBuilder Code
Select “on price” in the editor.
//----------------------------------------------------------------------//
//PRC_Adaptive Regression Breakout Map [GainzAlgo]
//version = 0
//29.07.26
//Ivan Gonzalez @ www.prorealcode.com
//Sharing ProRealTime knowledge
//----------------------------------------------------------------------//
//-----Regression Model-------------------------------------------------//
lengthReg = 50     //Regression Length
devMult   = 2.0    //Deviation Multiplier
//-----Contraction Metrics----------------------------------------------//
sqzLen = 100       //Lookback Period
sqzPct = 20.0      //Contraction Threshold %
//-----Target Architecture----------------------------------------------//
tp1Mult = 1.0      //TP1 Multiplier (x Bandwidth)
tp2Mult = 2.0      //TP2 Multiplier (x Bandwidth)
tp3Mult = 3.0      //TP3 Multiplier (x Bandwidth)
//-----Holographic Trendlines-------------------------------------------//
showTrend = 1      //1 = trendlines de pivotes
pivLen    = 10     //Pivot Length
extBars   = 60     //barras de proyeccion a la derecha
//-----Mapa de operaciones y estadisticas-------------------------------//
showMap    = 1     //1 = lineas de entrada / SL / TP
maxTrades  = 12    //ultimas operaciones con lineas dibujadas
showStats  = 1     //1 = panel de estadisticas
//----------------------------------------------------------------------//
atrV = averagetruerange[14](close)


//-----Canal de regresion-----------------------------------------------//
regBasis  = LinearRegression[lengthReg](close)
stdDev    = std[lengthReg](close)
upperBand = regBasis + stdDev * devMult
lowerBand = regBasis - stdDev * devMult
bandWidth = upperBand - lowerBand


//-----Metrica de contraccion (squeeze)---------------------------------//
minWidth = lowest[sqzLen](bandWidth)
maxWidth = highest[sqzLen](bandWidth)
denW     = max(maxWidth - minWidth, 0.000001)
widthPct = (bandWidth - minWidth) / denW * 100
isSqueeze = 0
IF widthPct <= sqzPct THEN
   isSqueeze = 1
ENDIF


ready = 0
IF barindex > lengthReg + sqzLen + 2 THEN
   ready = 1
ENDIF


//----------------------------------------------------------------------//
//TRENDLINES: los dos ultimos pivotes de cada lado
//----------------------------------------------------------------------//
once nPh = 0
once nPl = 0
pivWin = 2 * pivLen + 1


IF barindex > pivWin THEN
   IF high[pivLen] = highest[pivWin](high) THEN
      ph2y = ph1y
      ph2x = ph1x
      ph1y = high[pivLen]
      ph1x = barindex - pivLen
      nPh  = nPh + 1
   ENDIF
   IF low[pivLen] = lowest[pivWin](low) THEN
      pl2y = pl1y
      pl2x = pl1x
      pl1y = low[pivLen]
      pl1x = barindex - pivLen
      nPl  = nPl + 1
   ENDIF
ENDIF


//----------------------------------------------------------------------//
//MAQUINA DE ESTADO DE LA OPERACION
//----------------------------------------------------------------------//
once tradeDir    = 0
once entryPx     = 0
once slPx        = 0
once tp1Px       = 0
once tp2Px       = 0
once tp3Px       = 0
once tp1Hit      = 0
once tp2Hit      = 0
once tradeX1     = 0
once totalTrades = 0
once winTrades   = 0
once sumRet      = 0
once sumRet2     = 0


//-----Disparo de ruptura sobre banda con squeeze previo----------------//
bullTrig = 0
bearTrig = 0
IF ready = 1 AND isSqueeze[1] = 1 THEN
   IF close > upperBand AND close[1] <= upperBand[1] THEN
      bullTrig = 1
   ENDIF
   IF close < lowerBand AND close[1] >= lowerBand[1] THEN
      bearTrig = 1
   ENDIF
ENDIF


//-----Apertura---------------------------------------------------------//
IF tradeDir = 0 THEN
   IF bullTrig = 1 THEN
      tradeDir = 1
      entryPx  = close
      slPx     = lowerBand[1]
      tp1Px    = entryPx + bandWidth[1] * tp1Mult
      tp2Px    = entryPx + bandWidth[1] * tp2Mult
      tp3Px    = entryPx + bandWidth[1] * tp3Mult
      tp1Hit   = 0
      tp2Hit   = 0
      tradeX1  = barindex
      DRAWTEXT("Breakout, Long", barindex, low - 0.9 * atrV, sansserif, bold, 10) COLOURED(0, 140, 0, 255)
   ELSIF bearTrig = 1 THEN
      tradeDir = 0 - 1
      entryPx  = close
      slPx     = upperBand[1]
      tp1Px    = entryPx - bandWidth[1] * tp1Mult
      tp2Px    = entryPx - bandWidth[1] * tp2Mult
      tp3Px    = entryPx - bandWidth[1] * tp3Mult
      tp1Hit   = 0
      tp2Hit   = 0
      tradeX1  = barindex
      DRAWTEXT("Breakout, Short", barindex, high + 0.9 * atrV, sansserif, bold, 10) COLOURED(200, 0, 0, 255)
   ENDIF
ENDIF


//-----Gestion (misma barra que la apertura, como el original)----------//
IF tradeDir <> 0 THEN


   //todos los toques se evaluan ANTES de mover el stop
   hitSl  = 0
   hitTp1 = 0
   hitTp2 = 0
   hitTp3 = 0
   IF tradeDir = 1 THEN
      IF low <= slPx THEN
         hitSl = 1
      ENDIF
      IF high >= tp1Px THEN
         hitTp1 = 1
      ENDIF
      IF high >= tp2Px THEN
         hitTp2 = 1
      ENDIF
      IF high >= tp3Px THEN
         hitTp3 = 1
      ENDIF
   ELSE
      IF high >= slPx THEN
         hitSl = 1
      ENDIF
      IF low <= tp1Px THEN
         hitTp1 = 1
      ENDIF
      IF low <= tp2Px THEN
         hitTp2 = 1
      ENDIF
      IF low <= tp3Px THEN
         hitTp3 = 1
      ENDIF
   ENDIF


   //TP1: stop a breakeven
   IF hitTp1 = 1 AND tp1Hit = 0 THEN
      tp1Hit = 1
      slPx   = entryPx
      IF tradeDir = 1 THEN
         DRAWTEXT("TP1 Hit, Set Trail stop", barindex, high + 0.9 * atrV, sansserif, bold, 9) COLOURED(0, 0, 200, 255)
      ELSE
         DRAWTEXT("TP1 Hit, Set Trail stop", barindex, low - 0.9 * atrV, sansserif, bold, 9) COLOURED(0, 0, 200, 255)
      ENDIF
   ENDIF


   //TP2: stop a TP1
   IF hitTp2 = 1 AND tp2Hit = 0 THEN
      tp2Hit = 1
      slPx   = tp1Px
      IF tradeDir = 1 THEN
         DRAWTEXT("TP2 Hit", barindex, high + 0.9 * atrV, sansserif, bold, 9) COLOURED(0, 0, 200, 255)
      ELSE
         DRAWTEXT("TP2 Hit", barindex, low - 0.9 * atrV, sansserif, bold, 9) COLOURED(0, 0, 200, 255)
      ENDIF
   ENDIF


   //cierre por TP3 o por stop
   closeTrade = 0
   IF hitTp3 = 1 THEN
      retTr      = (tp3Px - entryPx) / entryPx * tradeDir * 100
      winTrades  = winTrades + 1
      closeTrade = 1
      IF tradeDir = 1 THEN
         DRAWTEXT("TP3 Hit (Closed)", barindex, high + 0.9 * atrV, sansserif, bold, 9) COLOURED(0, 140, 0, 255)
      ELSE
         DRAWTEXT("TP3 Hit (Closed)", barindex, low - 0.9 * atrV, sansserif, bold, 9) COLOURED(0, 140, 0, 255)
      ENDIF
   ELSIF hitSl = 1 THEN
      retTr      = (slPx - entryPx) / entryPx * tradeDir * 100
      closeTrade = 1
      IF tp1Hit = 1 THEN
         winTrades = winTrades + 1
      ELSE
         IF tradeDir = 1 THEN
            DRAWTEXT("Stop Loss Hit", barindex, low - 0.9 * atrV, sansserif, bold, 9) COLOURED(200, 0, 0, 255)
         ELSE
            DRAWTEXT("Stop Loss Hit", barindex, high + 0.9 * atrV, sansserif, bold, 9) COLOURED(200, 0, 0, 255)
         ENDIF
      ENDIF
   ENDIF


   IF closeTrade = 1 THEN
      totalTrades = totalTrades + 1
      sumRet      = sumRet + retTr
      sumRet2     = sumRet2 + retTr * retTr
      //buffer circular: asignacion pura, idempotente por tick (trampa 26)
      slot = totalTrades - floor((totalTrades - 1) / maxTrades) * maxTrades
      $trX1[slot]  = tradeX1
      $trX2[slot]  = barindex + 5
      $trEp[slot]  = entryPx
      $trSl[slot]  = slPx
      $trT1[slot]  = tp1Px
      $trT2[slot]  = tp2Px
      $trT3[slot]  = tp3Px
      tradeDir = 0
   ENDIF
ENDIF


//----------------------------------------------------------------------//
//DIBUJO (solo en la ultima barra)
//----------------------------------------------------------------------//
IF islastbarupdate THEN


   //-----trendlines de pivotes con efecto glow-------------------------//
   IF showTrend = 1 THEN
      xEnd = barindex + extBars
      IF nPh >= 2 AND ph1x <> ph2x THEN
         slopeH = (ph1y - ph2y) / (ph1x - ph2x)
         yEndH  = ph1y + slopeH * (xEnd - ph1x)
         DRAWSEGMENT(ph2x, ph2y, xEnd, yEndH) COLOURED(0, 255, 255, 38) STYLE(line, 5)
         DRAWSEGMENT(ph2x, ph2y, xEnd, yEndH) COLOURED(0, 255, 255, 102) STYLE(line, 3)
         DRAWSEGMENT(ph2x, ph2y, xEnd, yEndH) COLOURED(0, 255, 255, 255) STYLE(line, 1)
      ENDIF
      IF nPl >= 2 AND pl1x <> pl2x THEN
         slopeL = (pl1y - pl2y) / (pl1x - pl2x)
         yEndL  = pl1y + slopeL * (xEnd - pl1x)
         DRAWSEGMENT(pl2x, pl2y, xEnd, yEndL) COLOURED(255, 0, 255, 38) STYLE(line, 5)
         DRAWSEGMENT(pl2x, pl2y, xEnd, yEndL) COLOURED(255, 0, 255, 102) STYLE(line, 3)
         DRAWSEGMENT(pl2x, pl2y, xEnd, yEndL) COLOURED(255, 0, 255, 255) STYLE(line, 1)
      ENDIF
   ENDIF


   //-----mapa: operaciones cerradas------------------------------------//
   IF showMap = 1 THEN
      nShow = min(totalTrades, maxTrades)
      FOR s = 1 TO nShow DO
         DRAWSEGMENT($trX1[s], $trEp[s], $trX2[s], $trEp[s]) COLOURED(0, 0, 255, 128) STYLE(line, 2)
         DRAWSEGMENT($trX1[s], $trSl[s], $trX2[s], $trSl[s]) COLOURED(255, 0, 0, 128) STYLE(line, 2)
         DRAWSEGMENT($trX1[s], $trT1[s], $trX2[s], $trT1[s]) COLOURED(0, 150, 0, 128) STYLE(dottedline, 1)
         DRAWSEGMENT($trX1[s], $trT2[s], $trX2[s], $trT2[s]) COLOURED(0, 150, 0, 128) STYLE(dottedline, 1)
         DRAWSEGMENT($trX1[s], $trT3[s], $trX2[s], $trT3[s]) COLOURED(0, 150, 0, 128) STYLE(dottedline, 1)
         DRAWTEXT("TP1", $trX2[s] + 3, $trT1[s], sansserif, standard, 9) COLOURED(0, 150, 0, 255)
         DRAWTEXT("TP2", $trX2[s] + 3, $trT2[s], sansserif, standard, 9) COLOURED(0, 150, 0, 255)
         DRAWTEXT("TP3", $trX2[s] + 3, $trT3[s], sansserif, standard, 9) COLOURED(0, 150, 0, 255)
      NEXT


      //-----operacion abierta (se extiende hasta la barra actual)------//
      IF tradeDir <> 0 THEN
         xOpen = barindex + 5
         DRAWSEGMENT(tradeX1, entryPx, xOpen, entryPx) COLOURED(0, 0, 255, 200) STYLE(line, 2)
         DRAWSEGMENT(tradeX1, slPx, xOpen, slPx) COLOURED(255, 0, 0, 200) STYLE(line, 2)
         DRAWSEGMENT(tradeX1, tp1Px, xOpen, tp1Px) COLOURED(0, 150, 0, 200) STYLE(dottedline, 1)
         DRAWSEGMENT(tradeX1, tp2Px, xOpen, tp2Px) COLOURED(0, 150, 0, 200) STYLE(dottedline, 1)
         DRAWSEGMENT(tradeX1, tp3Px, xOpen, tp3Px) COLOURED(0, 150, 0, 200) STYLE(dottedline, 1)
         DRAWTEXT("TP1", xOpen + 3, tp1Px, sansserif, standard, 9) COLOURED(0, 150, 0, 255)
         DRAWTEXT("TP2", xOpen + 3, tp2Px, sansserif, standard, 9) COLOURED(0, 150, 0, 255)
         DRAWTEXT("TP3", xOpen + 3, tp3Px, sansserif, standard, 9) COLOURED(0, 150, 0, 255)
      ENDIF
   ENDIF


   //-----panel de estadisticas-----------------------------------------//
   IF showStats = 1 THEN
      avgRet = 0
      IF totalTrades > 0 THEN
         avgRet = sumRet / totalTrades
      ENDIF
      stdRet = 0
      IF totalTrades > 1 THEN
         varRet = sumRet2 / totalTrades - avgRet * avgRet
         stdRet = sqrt(max(varRet, 0))
      ENDIF
      sharpe = 0
      IF stdRet > 0 THEN
         sharpe = avgRet / stdRet
      ENDIF
      winRate = 0
      IF totalTrades > 0 THEN
         winRate = winTrades / totalTrades * 100
      ENDIF


      wrTxt = round(winRate * 100) / 100
      shTxt = round(sharpe * 100) / 100
      ttTxt = totalTrades


      IF winRate >= 50 THEN
         wrR = 0
         wrG = 150
         wrB = 0
      ELSE
         wrR = 200
         wrG = 0
         wrB = 0
      ENDIF
      IF sharpe >= 1 THEN
         shR = 0
         shG = 150
         shB = 0
      ELSE
         shR = 60
         shG = 60
         shB = 60
      ENDIF


      sX = 0 - 210
      sY = 0 - 40
      DRAWTEXT("Map Performance", sX, sY, sansserif, bold, 11) COLOURED(60, 60, 60, 255) ANCHOR(TOPRIGHT, XSHIFT, YSHIFT)
      DRAWTEXT("Total Signals: #ttTxt#", sX, sY - 22, sansserif, bold, 11) COLOURED(60, 60, 60, 255) ANCHOR(TOPRIGHT, XSHIFT, YSHIFT)
      DRAWTEXT("Win Rate: #wrTxt#%", sX, sY - 44, sansserif, bold, 11) COLOURED(wrR, wrG, wrB, 255) ANCHOR(TOPRIGHT, XSHIFT, YSHIFT)
      DRAWTEXT("Trade Sharpe: #shTxt#", sX, sY - 66, sansserif, bold, 11) COLOURED(shR, shG, shB, 255) ANCHOR(TOPRIGHT, XSHIFT, YSHIFT)
   ENDIF
ENDIF


//----------------------------------------------------------------------//
//BANDAS
//----------------------------------------------------------------------//
IF isSqueeze = 1 THEN
   bcR = 128
   bcG = 128
   bcB = 128
   bcA = 102
ELSE
   bcR = 0
   bcG = 0
   bcB = 128
   bcA = 51
ENDIF
colorbetween(upperBand, lowerBand, bcR, bcG, bcB, 26)


RETURN upperBand AS "Upper Deviation" COLOURED(bcR, bcG, bcB, bcA) STYLE(line, 1), lowerBand AS "Lower Deviation" COLOURED(bcR, bcG, bcB, bcA) STYLE(line, 1)