

LSMA SD - Linear Regression Oscillator with Standard Deviation Bands
1. What problem does it solve?
The classic stochastic oscillator normalises price between the highest high and lowest low over a given period. It works, but has a structural flaw: the bands are noisy. A single price spike distorts the bands for the entire lookback window, generating misleading readings.
LSMA SD addresses this by replacing high/low bands with standard deviation bands (Bollinger-style) centred on a smoothed linear regression. The result is a more stable and statistically robust oscillator that filters noise without sacrificing responsiveness to trend changes.
The core idea is simple: instead of asking “where is price relative to its high/low range?”, we ask “where is price relative to its recent statistical distribution?”.
2. How it works
Step 1: Central axis — Smoothed LSMA
A Linear Regression (LSMA) is computed over the source price with a lookback of lsLen bars (default 21). This gives the endpoint of the least-squares fit: the best linear estimate of where price “should be”.
A short EMA (smoothLen = 4 by default) is then applied to dampen window-edge snap artefacts. Set smoothLen=1 to disable smoothing.
rawLSMA = LinearRegression[lsLen](src)
basis = ExponentialAverage[smoothLen](rawLSMA)
Step 2: Standard deviation bands
Bollinger-style bands are built around the axis using the standard deviation (STD) of the source price over sdLen periods (default 32), multiplied by sdMult (default 2.9). Band width responds only to actual price volatility — no secondary scaling layer.
dev = sdMult * STD[sdLen](src)
upperBand = basis + dev
lowerBand = basis – dev
Step 3: Normalisation (0–100)
Price position within the bands is normalised to a 0–100 scale, just like a stochastic but over statistical bands rather than high/low extremes:
osc = 100 * (src – lowerBand) / (upperBand – lowerBand)
A reading of 50 means price sits exactly on the regression line. Above 76 (default long threshold) suggests bullish strength. Below 30 (default short threshold) suggests weakness.
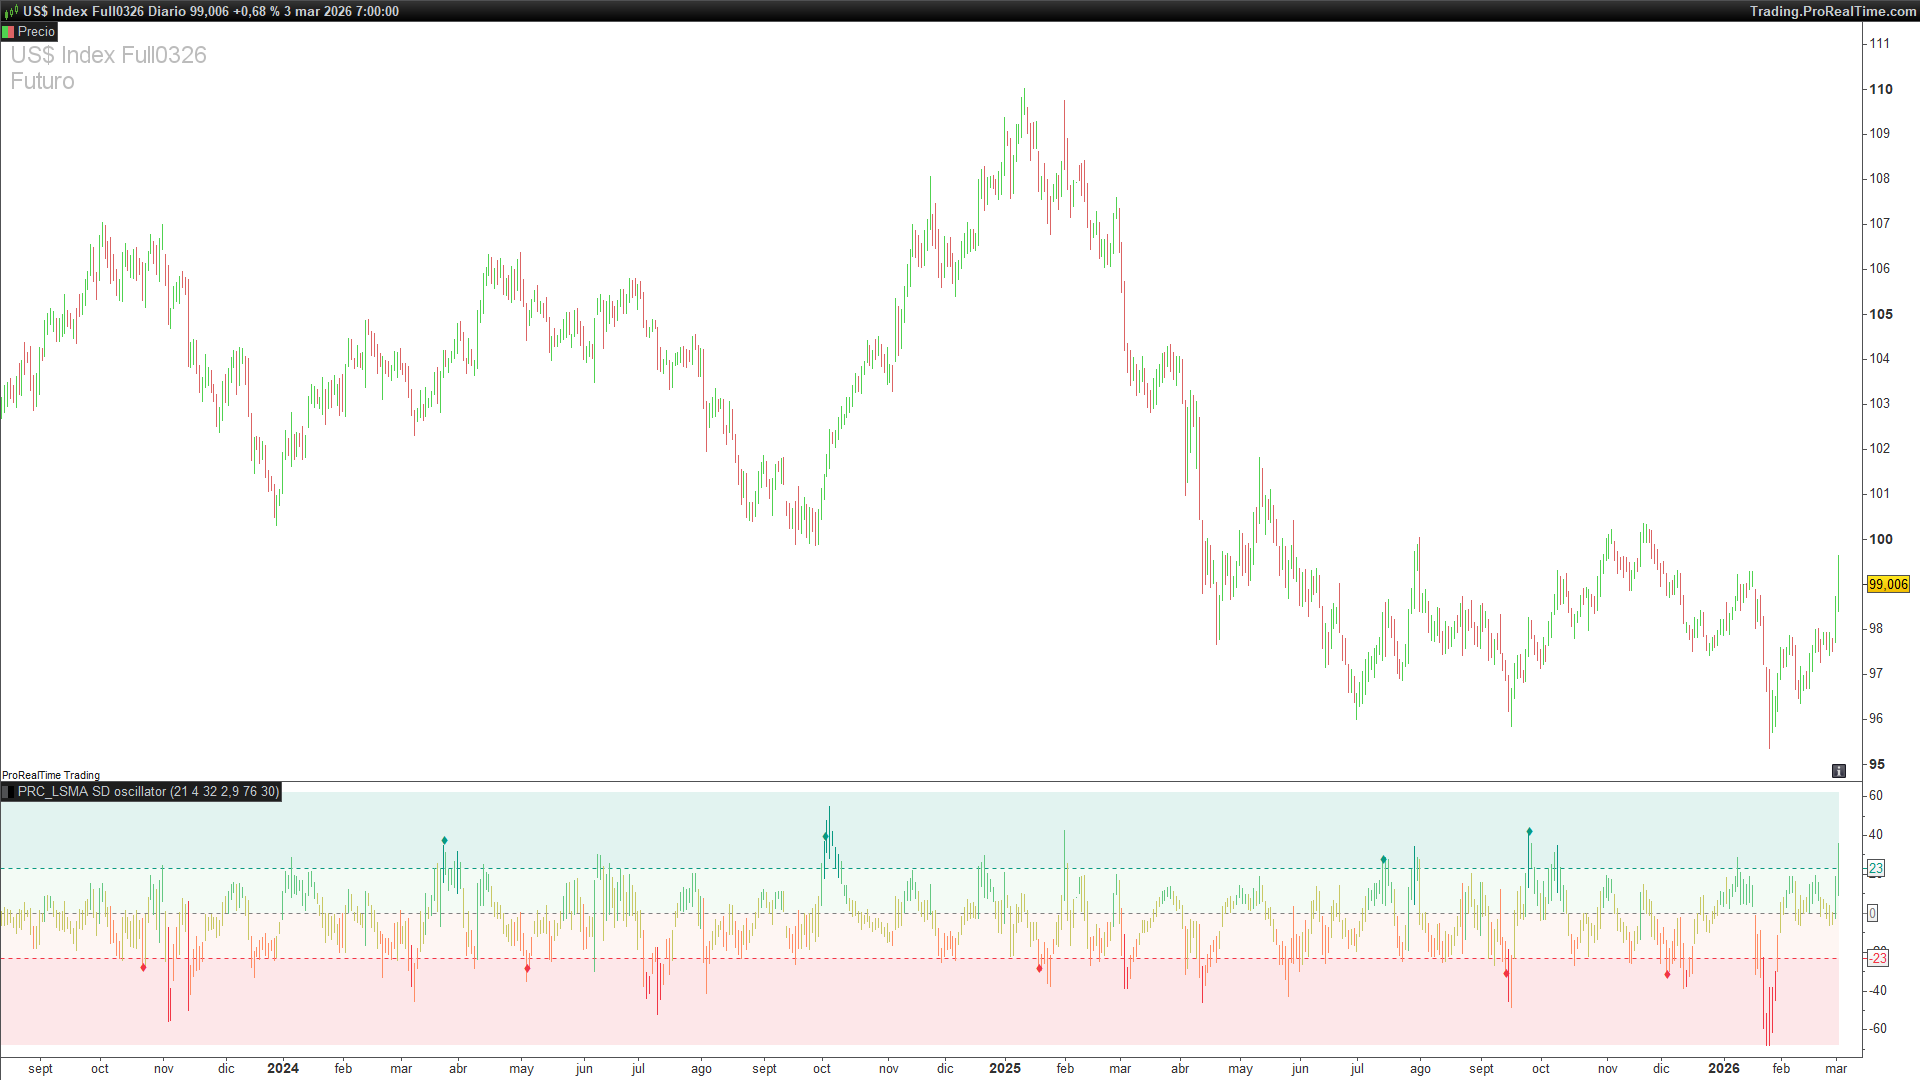
3. Reading the panel
OHLC oscillator candles
Rather than a plain line, the indicator plots full OHLC candles mapped into oscillator space. This reveals the internal bar structure in terms of relative position within the bands. For instance, a candle with a large body and long upper wick in the overbought zone may suggest rejection.
Colour zones
The panel background is divided into four semi-transparent zones:
- Red (lower) 0 – Short threshold (30) – Oversold / weakness
- Orange Short threshold – Centre (53) – Neutral-bearish
- Light green Centre – Long threshold (76) – Neutral-bullish
- Green (upper) Long threshold – 100 – Overbought / strength
Reference lines
Three dotted lines divide the panel: the long threshold (green, default 76), the short threshold (red, default 30), and the centre line (grey, corresponding to oscillator value 50, i.e. the regression axis). These are centred at zero in the panel for symmetric reading.
Signal markers (diamonds)
Green diamond (♦): long entry signal. Fires when the oscillator crosses above the long threshold AND the previous state was not “long”. Does not repeat while the state holds.
Red diamond (♦): exit signal. Fires when the oscillator crosses below the short threshold AND the previous state was “long”. Indicates exit to cash.
This state-machine approach prevents the repeated signals a simple crossover without memory would generate.
4. Full code (ProBuilder)
Copy and paste directly into ProRealTime. The indicator is added as a lower panel indicator (separate from the price chart):
//--------------------------------------------
// PRC_LSMA SD (by GForge)
// version = 0
// 04.03.2026
// Iván González @ www.prorealcode.com
// Sharing ProRealTime knowledge
//--------------------------------------------
// === PARAMETERS ===
//--------------------------------------------
src = close //Source (change to customclose for user-selectable)
lsLen = 21 //LSMA Length (10..300)
smoothLen = 4 //Endpoint Smoothing EMA (1..10, 1=off)
sdLen = 32 //StdDev Length (5..300)
sdMult = 2.9 //StdDev Multiplier (0.5..5.0)
longThr = 76 //Long Threshold (50..95)
shortThr = 30 //Short Threshold (5..80)
//--------------------------------------------
// === CORE CALCULATION ===
//--------------------------------------------
// LSMA = Linear Regression endpoint, smoothed with short EMA
rawLSMA = LinearRegression[lsLen](src)
basis = ExponentialAverage[smoothLen](rawLSMA)


// Fixed StdDev bands (Bollinger-style)
dev = sdMult * STD[sdLen](src)
upperBand = basis + dev
lowerBand = basis - dev
bandRng = upperBand - lowerBand


// Oscillator: normalized position within bands (0-100)
IF bandRng > 0 THEN
osc = 100.0 * (src - lowerBand) / bandRng
ELSE
osc = 50.0
ENDIF
//--------------------------------------------
// === PANEL COORDINATES (centered at 0) ===
//--------------------------------------------
midPt = (longThr + shortThr) / 2
nFloor = -midPt - 15
nCeil = (100 - midPt) + 15


// Map each OHLC price into oscillator panel coordinates
IF bandRng > 0 THEN
oscO = MAX(nFloor, MIN(nCeil, 100 * (open - lowerBand) / bandRng - midPt))
oscH = MAX(nFloor, MIN(nCeil, 100 * (high - lowerBand) / bandRng - midPt))
oscL = MAX(nFloor, MIN(nCeil, 100 * (low - lowerBand) / bandRng - midPt))
oscC = MAX(nFloor, MIN(nCeil, 100 * (close - lowerBand) / bandRng - midPt))
ELSE
oscO = 0
oscH = 0
oscL = 0
oscC = 0
ENDIF
//--------------------------------------------
// === CANDLE COLOR ===
//--------------------------------------------
clampOsc = MAX(0, MIN(100, osc))


IF clampOsc < 20 THEN
// Strong bearish: red
cr = 242
cg = 54
cb = 69
ELSIF clampOsc < 40 THEN
// Mild bearish: orange
cr = 255
cg = 140
cb = 100
ELSIF clampOsc < 60 THEN
// Neutral: yellow
cr = 200
cg = 200
cb = 100
ELSIF clampOsc < 80 THEN
// Mild bullish: light green
cr = 100
cg = 200
cb = 130
ELSE
// Strong bullish: TradingView green
cr = 8
cg = 153
cb = 129
ENDIF
//--------------------------------------------
// === DRAW OSCILLATOR CANDLES ===
//--------------------------------------------
DRAWCANDLE(oscO, oscH, oscL, oscC) COLOURED(cr, cg, cb)
//--------------------------------------------
// === SIGNAL STATE MACHINE ===
//--------------------------------------------
ONCE signalState = 0 // 0=cash, 1=long


IF osc CROSSES OVER longThr THEN
signalState = 1
ELSIF osc CROSSES UNDER shortThr THEN
signalState = 0
ENDIF


// Detect state transitions (signal fires only on change)
longSignal = (signalState = 1 AND signalState[1] = 0)
exitSignal = (signalState = 0 AND signalState[1] = 1)
//--------------------------------------------
// === SIGNAL MARKERS ===
//--------------------------------------------
IF longSignal THEN
DRAWTEXT("♦", barindex, oscC + 3) COLOURED(8, 153, 129)
ENDIF


IF exitSignal THEN
DRAWTEXT("♦", barindex, oscC - 3) COLOURED(242, 54, 69)
ENDIF
//--------------------------------------------
// === ZONE LINES AND FILLS ===
//--------------------------------------------
longLine = longThr - midPt
shortLine = shortThr - midPt
centerLine = 0
floorLine = nFloor
ceilLine = nCeil
//--------------------------------------------
// COLORBETWEEN zones
//--------------------------------------------
// 4 zones: bearish / neutral-low / neutral-high / bullish
COLORBETWEEN(floorLine, shortLine, 242, 54, 69, 30)
COLORBETWEEN(shortLine, centerLine, 242, 140, 100, 20)
COLORBETWEEN(centerLine, longLine, 100, 200, 130, 20)
COLORBETWEEN(longLine, ceilLine, 8, 153, 129, 30)


//--------------------------------------------
RETURN longLine COLOURED(8, 153, 129) STYLE(dottedline, 1) AS "Long Thr", shortLine COLOURED(242, 54, 69) STYLE(dottedline, 1) AS "Short Thr", centerLine COLOURED(128, 128, 128) STYLE(dottedline, 1) AS "Centre"
