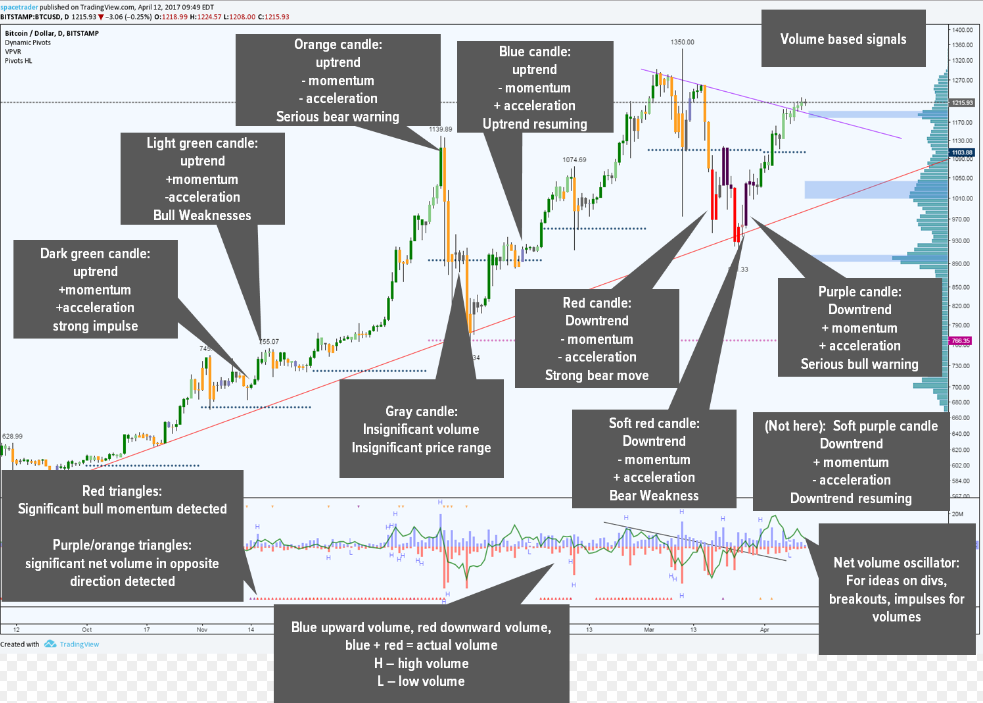
Hola,he encontrado este interesante indicador en la página:
https://es.tradingview.com/script/EHTKtnIt-ST-Volume-Flow-v6/
//@version=2
study(title=”[ST] Volume Flow v6″, shorttitle=”[ST] Volume Flow v6″, precision=0)
//inputs
showMA=input(false, title=”Show high alert level?”)
showbb = input(title=”Show BB?”, defval = false)
showhighlowwarnings = input(title=”Show high/low warnings (H/L)?”, defval=true)
plotthem = input(title=”Plot strategy shapes?”, defval = false)
showreversals = input(title=”Show reversal warnings?”, defval=true)
showrsibreakouts = input(title=”Show rsi breakouts?”, defval=true)
showoscilator = input(title=”show oscilator”, defval=true)
colorcandles = input(title=”Color candles?”, defval=true)
percentagevolume = input(title=”Show volume as % of previous volume? (% as units)”, defval=false)
uselog = input(title=”Instead show log of volume (Units e.g. log(BTC))”, defval=false)
usepercentMA = input(title=”Instead show volume as % of moving average (% as units)”, defval=false)
significantvolume = input(title=”Paint significant volume differently?”, type=bool, defval = false)
graycandles = input(title=”Use gray for low volume candles?”, type=bool, defval = true)// volumeok graycandles
modifiedobv = input(title=”Use wick rejection for obv momentum calculation?”, type = bool, defval = true)
otherunits = input(title=”Multiply by hlc3 of price? (e.g. vol of DCRBTC will be in BTC, not DCR)”, type = bool, defval = true)
multiply = input(title=”Multiply by another symbol named below?”, type = bool, defval = false)
anothersymbol = input(title=”The other symbol?”, type = symbol, defval = “BITSTAMP:BTCUSD”)
exp1 = input(title=”(e.g. If you’re looking at ALTUSD, ALTBTC can be multiplied by BTCUSD) ignore->”, type = bool, defval = false)
reversalsand = input(title=”Reversals for peak volume OR oscilator swing (alternative AND)”, type=bool, defval=true)
lengthMA=input(20, title=”ema length (for H/L, BB)”)
rsilength = input(title=”rsi length”, defval = 14)
emalength = input(title=”response speed ema length”, defval = 2)
accumsmooth = input(title=”Accum smooth”, defval = 3)
accumlength = input(title=”Accum length”, defval = 10)
highstdevs = input(title=”High warning std dev multiplier?”, defval = 4)
rsidevs = input(title=”rsi breakout std dev multiplier?”, defval = 2)
myvolume2 = otherunits? nz(volume) * hlc3 : nz(volume)
myvolume = multiply? myvolume2 * nz(security(anothersymbol, period, hlc3)) : myvolume2
//calculate fractions of volume for each direction
//basically body counts twice in body direction, wicks count once in both directions, total fraction = fractionup+fractiondown = 1, i.e. total volume is volume up + volume down
topwick = iff(open<close, high – close, high – open)
bottomwick = iff(open<close, open-low, close-low)
body = iff(open<close, close-open, open-close)
fractionup = iff( open<close, (topwick + bottomwick + 2*body)/(2*topwick + 2*bottomwick + 2*body), (topwick + bottomwick)/(2*topwick + 2*bottomwick + 2*body) )
fractiondown = iff( open<close, (topwick + bottomwick)/(2*topwick + 2*bottomwick + 2*body), (topwick + bottomwick + 2*body)/(2*topwick + 2*bottomwick + 2*body) )
volumeup = nz(myvolume) * fractionup
volumedown = nz(myvolume) * fractiondown
pvolumeup = nz(myvolume)/fixnan(myvolume[1])*100 * fractionup
pvolumedown = nz(myvolume)/fixnan(myvolume[1])*100 * fractiondown
//makes sure log is above 0 to prevent negatives
volumeuplog= max(log(volumeup),0)
volumedownlog= max(log(volumedown),0)
netvolume = volumeup – volumedown
pnetvolume = pvolumeup – pvolumedown
lognetvolume = volumeuplog – volumedownlog
totalvolume = volumeup + volumedown
ptotalvolume = pvolumeup + pvolumedown
volumeok = totalvolume > sma(nz(totalvolume[1]), round(lengthMA/2)) //lengthMA or emalength
//for % volume change compared to moving average
MApvolumeup = nz(myvolume)/ema(fixnan(myvolume[1]), lengthMA)*100 * fractionup
MApvolumedown = nz(myvolume)/ema(fixnan(myvolume[1]), lengthMA)*100 * fractiondown
//old way to calculate significant levels
emauptop = max(ema(highest(volumeup, lengthMA), lengthMA), highest(volumeup, lengthMA))
emadownbottom = min(ema(lowest(-volumedown, lengthMA), lengthMA), lowest(-volumedown, lengthMA))
emaupbottom = highest(ema(lowest(volumeup, lengthMA), lengthMA), lengthMA)
emadowntop = lowest(ema(highest(-volumedown, lengthMA), lengthMA), lengthMA)
emalows = lowest(ema(lowest(totalvolume, lengthMA), lengthMA), lengthMA)
emahighs = highest(ema(highest(totalvolume, lengthMA), lengthMA), lengthMA)
// quick rsi obv calculation for strategy
obv_btc_regular = nz(myvolume * (close – open)/(high-low)) //regular
obv_btc_modified = nz(myvolume * (3*close – open – high – low)/(high-low)) // modified where wicks count oposite and half value
all_obvbtc_regular = cum(obv_btc_regular)
all_obvbtc_modified = cum(obv_btc_modified)
obvrsi_regular = rsi(all_obvbtc_regular, rsilength)
obvrsi_modified = rsi(all_obvbtc_modified, rsilength)
obvrsi = modifiedobv? obvrsi_modified : obvrsi_regular //pick one type
emaobvrsi = ema(ema(ema(obvrsi,emalength), emalength), emalength) //triple smoothing over very small interval
// rsi break out strategy (regular obv)
rsiBO_BBcenter = ema(obvrsi_regular, lengthMA)
rsiBO_dev = stdev(obvrsi_regular, lengthMA) * rsidevs
//rsiBO_BBtop = rsiBO_BBcenter+rsiBO_dev
//rsiBO_BBbottom = rsiBO_BBcenter-rsiBO_dev
rsiBO_up = obvrsi_regular > 50+rsiBO_dev
rsiBO_down = obvrsi_regular < 50-rsiBO_dev
//stdev bands around volume
bbcenter = ema(volumeup-volumedown, lengthMA)
bbstdevup = stdev(volumeup, lengthMA)
bbstdevdown = stdev(volumedown, lengthMA)
//bbtop = bbcenter+highstdev*bbstdevup
//bbbottom = bbcenter-highstdev*bbstdevdown
bbtop = bbcenter+highstdevs*bbstdevup
bbbottom = bbcenter-highstdevs*bbstdevdown
bbtopsmooth = max(bbtop, ema(bbtop, lengthMA))
bbbottomsmooth = min(bbbottom, ema(bbbottom, lengthMA))
//find high regions
bullpeakwarning = fixnan(bbtop[1])<=volumeup
bearpeakwarning = fixnan(bbbottom[1])>=-volumedown
//find low regions
bulllowwarning = emalows>=(volumeup+volumedown) and myvolume<nz(myvolume[1])
bearlowwarning = emalows>=(volumeup+volumedown) and myvolume<nz(myvolume[1])
//checks if macd histogram on emaobvrsi got smaller bar than previous. i.e. slowing down
momentumup = sma((emaobvrsi – ema(emaobvrsi,emalength)) – (fixnan(emaobvrsi[1]) – fixnan(ema(emaobvrsi,emalength)[1])),emalength)>=0
bullish = emaobvrsi>50
bearish = emaobvrsi<50
movingup = emaobvrsi>fixnan(emaobvrsi[1])
superbullish = movingup and momentumup
superbearish = not movingup and not momentumup
uplarger = volumeup>fixnan(volumeup[1]) //and volumedown<fixnan(volumedown[1])
downlarger = volumedown>fixnan(volumedown[1]) //and volumeup<fixnan(volumeup[1])
upgrowth = max(fixnan(volumeup – volumeup[1]), 0)
downgrowth = max(fixnan(volumedown – volumedown[1]), 0)
consolidation = not uplarger and not downlarger
//triangle at bottom up means volume movement in right direction
bearishtriangledown = downlarger and not uplarger and not consolidation and bearish
bullishtriangleup = uplarger and not downlarger and not consolidation and bullish
//diamond means move in both directions
bearishdiamond = uplarger and downlarger and not consolidation and bearish
bullishdiamond = uplarger and downlarger and not consolidation and bullish
//square is warning movement is in wrong direction
bearishsquare = uplarger and not downlarger and not consolidation and bearish
bullishsquare = not uplarger and downlarger and not consolidation and bullish
//X is consolidation
bearishcross = consolidation and bearish
bullishcross = consolidation and bullish
topcolors = superbearish? color(red, 0): superbullish? color(blue, 50) : color(red, 50)
bottomcolors = superbullish? color(blue, 0): superbearish? color(red, 50) : color(blue, 50)
//color differently if % based
upcolor = volumeok and significantvolume? #7278FF : #A2A8FF //#A2A8FF //
downcolor = volumeok and significantvolume? #FF554E: #FF857E // #FF857E //
p_upcolor = (ptotalvolume)>100? green : #60D060
p_downcolor = (ptotalvolume)>100? orange : #FFAF60
// IMPORTANT: record the volume up and down actually used for plotting depending on method used so I can place H/L in right place
volumeupplot = usepercentMA? MApvolumeup : uselog? volumeuplog : percentagevolume? pvolumeup : volumeup
volumedownplot = usepercentMA? MApvolumedown : uselog? volumedownlog : percentagevolume? pvolumedown : volumedown
//oscilator
netoscilator = linreg(netvolume, lengthMA, -lengthMA)
pnetoscilator = linreg(pnetvolume, lengthMA, -lengthMA)
lognetoscilator = linreg(lognetvolume, lengthMA, -lengthMA)
//netoscilatorplot = uselog? lognetoscilator : percentagevolume? pnetoscilator : netoscilator
netoscilatorplot = linreg(volumeupplot-volumedownplot, lengthMA, -lengthMA)
score = (movingup + momentumup)/2
scorebetter = score>fixnan(score[1])
scoreworse = score<fixnan(score[1])
uptrend = scorebetter? true: scoreworse? false: fixnan(uptrend[1])
//adding accumulation region detection (price based oscilator for reversals)
hlcc4 = (high+low+close*2)/4
scoredev = stdev(hlcc4,accumlength)
scoredev := iff(scoredev==0, 1, scoredev)
a_score=(ema(ema((hlcc4-ema(hlcc4, accumlength))*100/scoredev,accumsmooth),accumlength)+100)/2-4
highest_a_score=highest(a_score,accumsmooth)
a_score_final=a_score>50?min(a_score,highest_a_score):highest_a_score<50?max(a_score,highest_a_score):na
accumulation = (a_score <= 50) and (a_score <= a_score[1])
distribution = (a_score > 50) and (a_score > a_score[1])
pullbackdown = (a_score > 50) and (a_score <= a_score[1])
pullbackup = (a_score <= 50) and (a_score > a_score[1])
oscilatorup = a_score > nz(a_score[1])
oscilatordown = a_score < nz(a_score[1])
//reversals
turnup = movingup and momentumup
turndown = not movingup and not momentumup
volumeupok = volumeup > sma(volumeup, emalength)
volumedownok = volumedown > sma(volumedown, emalength)
//darker if price momentum is still down, while volume shows up
reversalup = reversalsand? showreversals and turnup and ((volumeok and netoscilator > nz(netoscilator[1])) or bullpeakwarning) : showreversals and turnup and ((volumeok and netoscilator > nz(netoscilator[1])) and bullpeakwarning)
reversaldown = reversalsand? showreversals and turndown and ((volumeok and netoscilator < nz(netoscilator[1])) or bearpeakwarning) : showreversals and turndown and ((volumeok and netoscilator < nz(netoscilator[1])) and bearpeakwarning)
significantprice = (high > ema(high, emalength)) or (low < ema(low, emalength))
isgreen = (bullish and movingup and momentumup )
isred = (bearish and not movingup and not momentumup )
isorange = (bullish and not movingup and not momentumup)
ispurple = (bearish and movingup and momentumup)
issoftpurple = (bearish and movingup and not momentumup)
isblue = (bullish and not movingup and momentumup)
issoftgreen = (bullish and movingup and not momentumup)
issoftred = (bearish and not movingup and momentumup)
isgray = (not volumeok and not isgreen and not isred and not ispurple and not isorange and not significantprice)
candlecolor = isgreen? color(green,0): isred? color(red,0) : ispurple? color(#500050,0): isorange? color(#FF9F20,0): issoftpurple? color(#A020A0,0): isblue? color(#8080C0,0): issoftgreen? color(#88CC88,0): issoftred? color(#CC8888,0): color(black,0)
candlecolor := graycandles and isgray? color(#666666,0) : candlecolor //replaces only soft colors
//******************************
// Plotting
// *****************************
// extreme levels
plot(showMA?emauptop:na, title=”, style=circles, transp=50, color=#555555, linewidth=2)
plot(showMA?emadownbottom:na, title=”, style=circles, transp=50, color=#555555, linewidth=2)
// Volume boilinger bands
bb1 = plot(showbb? bbtopsmooth:na, transp = 100) //top of bb
bb2 = plot(showbb? bbbottomsmooth:na, transp = 100) //bottom of bb
fill(bb1, bb2, color = teal, transp = 85)
// H/L: have to also plot a circle or H/L will not be visible (offscreen) sometimes
plot(showhighlowwarnings and bullpeakwarning and nz(myvolume)>0? volumeupplot*1.3:na, style=circles, transp=99)
plot(showhighlowwarnings and bearpeakwarning and nz(myvolume)>0? -volumedownplot*1.3:na, style=circles, transp=99)
plot(showhighlowwarnings and bulllowwarning and not barstate.islast and fixnan(myvolume)>0 ? volumeupplot*1.3:na, style=circles, transp=99)
plot(showhighlowwarnings and bearlowwarning and not barstate.islast and fixnan(myvolume)>0 ? -volumedownplot*1.3:na, style=circles, transp=99)
plotshape(showhighlowwarnings and bullpeakwarning and nz(myvolume)>0? volumeupplot*1.2:na, style = shape.labeldown, location = location.absolute, text=”H”, textcolor = color(blue, 30), color = white, transp = 100, editable=true, size = size.auto)
plotshape(showhighlowwarnings and bearpeakwarning and nz(myvolume)>0? -volumedownplot*1.2:na, style = shape.labelup, location = location.absolute, text=”H”, textcolor = color(blue, 30), color = white, transp = 100, editable=true, size = size.auto)
plotshape(showhighlowwarnings and bulllowwarning and not barstate.islast and fixnan(myvolume)>0 ? volumeupplot*1.2:na , style = shape.labeldown, location = location.absolute, text=”L”, textcolor = color(blue, 30), color = white, transp = 100, editable=true, size = size.auto)
plotshape(showhighlowwarnings and bearlowwarning and not barstate.islast and fixnan(myvolume)>0 ? -volumedownplot*1.2:na, style = shape.labelup, location = location.absolute, text=”L”, textcolor = color(blue, 30), color = white, transp = 100, editable=true, size = size.auto)
// old shapes, maybe I should retire them
plotshape(plotthem and bearishtriangledown, style = shape.triangledown, location = location.bottom, color = topcolors, editable=true, size = size.auto)
plotshape(plotthem and bullishtriangleup, style = shape.triangleup, location = location.top, color = bottomcolors, editable=true, size = size.auto)
plotshape((plotthem and bearishcross), style = shape.xcross, location = location.bottom, color = topcolors, editable=true, size = size.auto)
plotshape((plotthem and bullishcross), style = shape.xcross, location = location.top, color = bottomcolors, editable=true, size = size.auto)
plotshape((plotthem and bearishsquare), style = shape.square, location = location.bottom, color = topcolors, editable=true, size = size.auto)
plotshape((plotthem and bullishsquare), style = shape.square, location = location.top, color = bottomcolors, editable=true, size = size.auto)
plotshape((plotthem and bearishdiamond), style = shape.diamond, location = location.bottom, color = topcolors, editable=true, size = size.auto)
plotshape((plotthem and bullishdiamond), style = shape.diamond, location = location.top, color = bottomcolors, editable=true, size = size.auto)
// volume histogram
plot(percentagevolume?na:volumeupplot, title=’Volume UP’, style=histogram, transp=0, color=upcolor, linewidth=4)
plot(percentagevolume?na:-volumedownplot, title=’Volume DOWN’, style=histogram, transp=0, color=downcolor, linewidth=4)
plot(percentagevolume?volumeupplot:na, title=’Volume UP’, style=histogram, transp=0, color=p_upcolor, linewidth=4)
plot(percentagevolume?-volumedownplot:na, title=’Volume DOWN’, style=histogram, transp=0, color=p_downcolor, linewidth=4)
// volume oscilator
plot(showoscilator? netoscilatorplot:na, style = line, linewidth = 2, color = color(#007700, 30))
plot(showoscilator? netoscilatorplot:na, style = circles, linewidth = 2, color = color(#007700, 100))
// little allows showing significant volume moving opposite direction for reversals
plotshape(reversalup and oscilatordown, style = shape.triangleup, location = location.bottom, color = purple, transp = 50, editable=true, size = size.auto)
plotshape(reversalup and oscilatorup, style = shape.triangleup, location = location.bottom, color = orange, transp = 50, editable=true, size = size.auto)
plotshape(reversaldown and oscilatorup, style = shape.triangledown, location = location.top, color = purple, transp = 50, editable=true, size = size.auto)
plotshape(reversaldown and oscilatordown, style = shape.triangledown, location = location.top, color = orange, transp = 50, editable=true, size = size.auto)
//strategy
//plot(myvolume*0, color = rsiBO_up? lime : color(lime, 100))
//plot(myvolume*0, color = rsiBO_down? red : color(red, 100))
//plotshape(rsiBO_up, style = shape.labelup, location = location.bottom, text=”*”, textcolor = color(green, 30), color = white, transp = 100, editable=true, size = size.auto)
//plotshape(rsiBO_down, style = shape.labeldown, location = location.top, text=”*”, textcolor = color(red, 30), color = white, transp = 100, editable=true, size = size.auto)
plotshape(showrsibreakouts? rsiBO_up:na, style = shape.triangleup, location = location.bottom, color = #FF3333, transp = 30, editable=true, size = size.auto)
plotshape(showrsibreakouts? rsiBO_down:na, style = shape.triangledown, location = location.top, color = #FF3333, transp = 30, editable=true, size = size.auto)
// color candles
barcolor(colorcandles? candlecolor : na)
Las instrucciones de interpretación se adjuntan en la foto.A ver si alguien lo puede traducir………
Gracias.