Hola, puede alguien traducir este código a PRT: https://www.tradingview.com/script/ZNgiVb6Q-DVDIQQE-DW/
DESCRIPCIÓN:
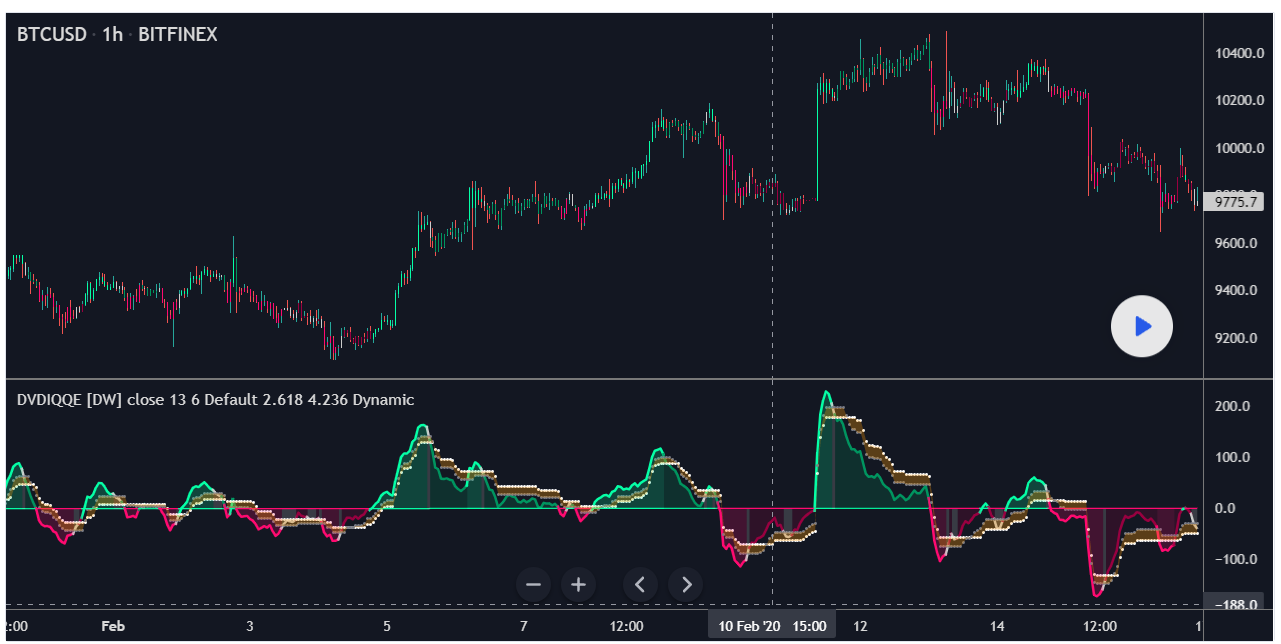
“Este es un estudio experimental inspirado en el indicador de Estimación Cualitativa Cuantitativa diseñado para identificar tendencia y actividad de olas.En este estudio, en lugar de utilizar RSI para el cálculo, se utiliza el oscilador de índice de divergencia de volumen dual.
Primero, el oscilador DVDI se calcula tomando la diferencia entre PVI y su EMA, y NVI y su EMA, luego tomando la diferencia entre los dos resultados.
Los parámetros opcionales para el cálculo de DVDI se incluyen en este script:
– Una opción para usar el volumen de tick en lugar del volumen real para la fuente de volumen
– Una opción para usar datos acumulativos, que suma los movimientos del oscilador desde el principio hasta el final de la ventana máxima de TradingView para brindar una imagen más amplia del sentimiento del mercado.”
// © DonovanWall
//██████╗ ██╗ ██╗
//██╔══██╗██║ ██║
//██║ ██║██║ █╗ ██║
//██║ ██║██║███╗██║
//██████╔╝╚███╔███╔╝
//╚═════╝ ╚══╝╚══╝
//@version=4
study(“Dual Volume Divergence Index Quantitative Qualitative Estimation [DW]”, shorttitle=”DVDIQQE [DW]”, overlay=false)
//by Donovan Wall
//This is an experimental study inspired by the Quantitative Qualitative Estimation indicator designed to identify trend and wave activity.
//In this study, rather than using RSI for the calculation, the Dual Volume Divergence Index oscillator is utilized.
//First, the DVDI oscillator is calculated by taking the difference between PVI and its EMA, and NVI and its EMA, then taking the difference between the two results.
//Optional parameters for DVDI calculation are included within this script:
// – An option to use tick volume rather than real volume for the volume source
// – An option to use cumulative data, which sums the movements of the oscillator from the beginning to the end of TradingView’s maximum window to give a more broad picture of market sentiment
//Next, two trailing levels are calculated using the average true range of the oscillator. The levels are then used to determine wave direction.
//Lastly, rather than using 0 as the center line, it is instead calculated by taking a cumulative average of the oscillator.
//Custom bar colors are included.
//Note: For charts that have no real volume component, use tick volume as the volume source.
//—————————————————————————————————————————————————————–
//Updates:
//Migrated from pine v2 to v3. Adjusted the equations accordingly.
//Changed default smoothing period to 6.
//—————————————————————————————————————————————————————–
//Updates:
// -> Migrated to v4.
// -> Updated DVDI function.
// -> Corrected NaN values to stabilize initial conditions.
// -> Added the option to choose between a static or dynamic center line. When the line is static, its value is 0.
// -> Reorganized script structure.
// -> Revamped color scheme.
//—————————————————————————————————————————————————————–
//Functions
//—————————————————————————————————————————————————————–
//EMA Function
EMA(x, t)=>
EMA = x
EMA := na(EMA[1]) ? x : (x – nz(EMA[1]))*(2/(t + 1)) + nz(EMA[1])
EMA
//Dual Volume Divergence Index Function
DVDI(x, t1, t2, v_type)=>
tick = syminfo.mintick
rng = close – open
tickrng = tick
tickrng := abs(rng) < tick ? nz(tickrng[1]) : rng
tickvol = abs(tickrng)/tick
vol = v_type==”Default” ? (na(volume) ? tickvol : volume) : tickvol
var PVI = 0.0
PVI := vol > nz(vol[1]) ? PVI + (x – nz(x[1])) : PVI
psig = EMA(PVI, t1)
pdiv = EMA(PVI – psig, t2)
var NVI = 0.0
NVI := vol < nz(vol[1]) ? NVI – (x – nz(x[1])) : NVI
nsig = EMA(NVI, t1)
ndiv = EMA(NVI – nsig, t2)
DVDI = pdiv – ndiv
DVDI
//Trailing Level Function
tl(x, t, m)=>
wper = (t*2) – 1
rng = abs(x – x[1])
avrng = EMA(rng, wper)
smrng = EMA(avrng, wper)*m
tl = x
tl := na(tl[1]) ? x : (x > nz(tl[1]) ? ((x – smrng) < nz(tl[1]) ? nz(tl[1]) : (x – smrng)) : ((x + smrng) > nz(tl[1]) ? nz(tl[1]) : (x + smrng)))
tl
//Cumulative Average Function
cmean(x)=>
var xsum = 0.0
xsum := xsum + x
var tsum = 0.0
tsum := tsum + 1
cmean = xsum/tsum
cmean
//—————————————————————————————————————————————————————–
//Inputs
//—————————————————————————————————————————————————————–
//Source
src = input(defval=close, title=”Source”)
//Sampling Periods
per = input(defval=13, minval=1, title=”Sampling Period”)
smper = input(defval=6, minval=1, title=”Smoothing Period”)
//Tick Volume Toggle
vol_type = input(defval=”Default”, options=[“Default”, “Tick”], title=”Volume Type”)
//DVDI ATR Multipliers
fmult = input(defval=2.618, minval=0, title=”Fast Trailing Level Range Multiplier”)
smult = input(defval=4.236, minval=0, title=”Slow Trailing Level Range Multiplier”)
//Center Line Type
center_type = input(defval=”Dynamic”, options=[“Static”, “Dynamic”], title=”Center Line Type”)
//—————————————————————————————————————————————————————–
//Definitions
//—————————————————————————————————————————————————————–
//DVDI Oscillator
dvdi = DVDI(src, per, smper, vol_type)
//Trailing Levels
ftl = tl(dvdi, per, fmult)
stl = tl(dvdi, per, smult)
//Center Line
center = center_type==”Dynamic” ? cmean(dvdi) : 0
//Colors
dcolor = (dvdi > ftl) and (dvdi > stl) and (dvdi > center) ? #05ffa6 :
(dvdi < ftl) and (dvdi < stl) and (dvdi > center) ? #00945f :
(dvdi < ftl) and (dvdi < stl) and (dvdi < center) ? #ff0a70 :
(dvdi > ftl) and (dvdi > stl) and (dvdi < center) ? #990040 : #cccccc
ccolor = center > center[1] ? #05ffa6 : center < center[1] ? #ff0a70 : #cccccc
//—————————————————————————————————————————————————————–
//Outputs
//—————————————————————————————————————————————————————–
//DVDI Oscillator Plot
dvdiplot = plot(dvdi, color=dcolor, linewidth=2, title=”DVDI Oscillator”)
//Trailing Level Plots
stlplot = plot(stl, color=color.white, style=plot.style_circles, title=”Slow Trailing Level”)
ftlplot = plot(ftl, color=color.gray, style=plot.style_circles, title=”Fast Trailing Level”)
//Center Line Plot
centerplot = plot(center, color=ccolor, title=”Center Line”)
//DVDI Fill
fill(dvdiplot, centerplot, color=dcolor, transp=80, title=”DVDI Oscillator Fill”)
//Trailing Levels Fill
fill(stlplot, ftlplot, color=color.orange, transp=70, title=”Trailing Zone Fill”)
//Bar Color
barcolor(dcolor)