Hi,
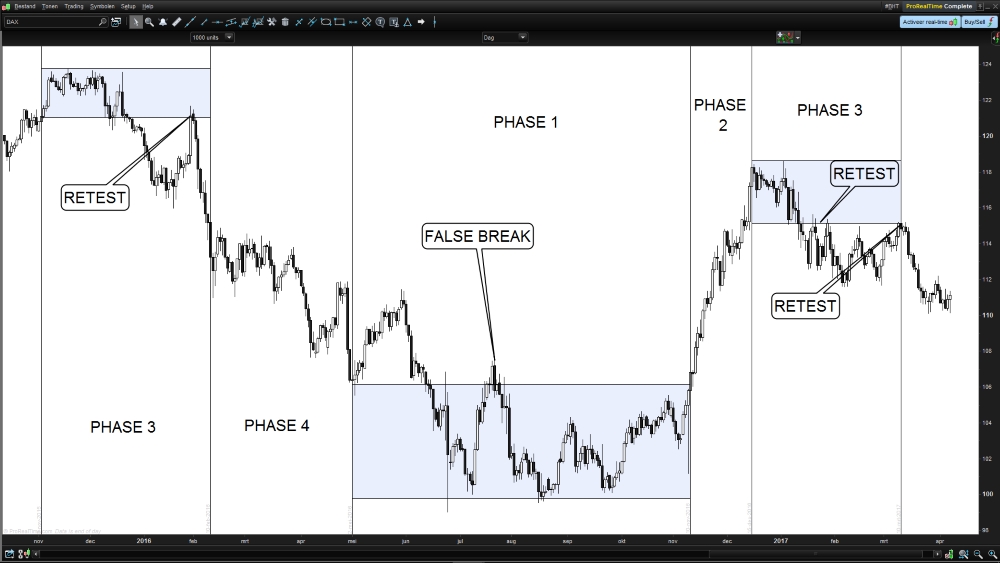
For years I divide the market in 4 phases. Phase 1: A sideways (ranging) market around the lowest price. Phase 2: A bullish trending market. Phase 3: A sideways (ranging) market around the highest price. And phase 4:A bearish trending market. Any market is always in one of the phases.
The idea for a ProScreener is to use a (favorite) Moving Average to divide a market in the Phases. (1: The MA is flat around the bottom of the chart. 2: The price broke out the range to the upside and the MA is pointing to the north. 3:The MA is flat around the top of the chart. 4:The price broke out the range to the downside and the MA is pointing to the southth).
Can anyone taking up the challenge to translate this idea, or inventing a better one, to a ProScreener code?
Thank you……….
Hi Marcel, interesting idea and concept. I can help for sure. Please just let me know how do you want to proceed.
How do you identify yourself these different kind of market phases? You can add screenshots to illustrate your idea, many thanks.
Sounds good and aligns with Stage Analysis in Stan Weinstein’s book … link below to ‘Stage Summary’ in pdf and the book on Amazon (I’ve read then skimmed again a few times!).
Ill be interested in this if we can get this going, the pdf may help with the rationale?
https://www.debeurs.nl/Forum/Upload/2012/6160228.pdf
https://www.amazon.co.uk/Stan-Weinsteins-Secrets-Profit-Markets/dp/1556236832
GraHal
Well, we need definitions.
I suggest using using the highest and lowest close or ma value as a base for determining the top and bottom of the chart. Upper third is top, lower third is bottom.
To determine if the MA is rising we could use MA>MA [20] and MA>MA [1]. A few more steps could help to determine if the MA is actually moving up.
For a range we could simply check if the MA is inside it’s 20 day high low range.
@Marcel, Grahal: Any other suggestions?
@Derek, nice study of the market phases.
Another way would include correlation coefficient between a straight linear regression and the moving average. If the correlation is superior to 80% for X periods and its slope is “flat”, then we are in ranging phase, etc. for the other phases. It would need more study though, just a rough Sunday evening idea 🙂
I would suggest the smoothest MA as possible. After all, is it about the big picture. I included a screenshot (DAX daily) of the way I identify the phases by hand. When doubt I use a higher timeframe to confirm the phase. The problem seems to be the randomness of the phase size. My knowledge about programming a screener is to limited, but 1+1+1 together makes 3, so please let’s continuing this study!
How do you define the starting point of a phase? In your screenshot I don’t see how the upper and lower boundary of phase 1 are calculated.
@Derek, The starting point is roughly defined from the highest high of a phase after both the top and bottom were hit by the price for at least three times . Make sence?
Well, it’s always easier to stop these phases on chart history 🙂 For me, the phases you defined on your example are not quiet easy to spot and I must admit I don’t understand them well! 🙂 Maybe we could restart from the beginning with your first post definitions of the 4 phases:
- Phase 1: A sideways (ranging) market around the lowest price.
- Phase 2: A bullish trending market.
- Phase 3: A sideways (ranging) market around the highest price.
- Phase 4:A bearish trending market. Any market is always in one of the phases.
I think the phases 2 and 4 are the easier to identify. The ranging ones are a bit challenging because we need to define the “lowest” and “highest” prices, I think a lookback period of X weeks should do the trick? Maybe we need other examples Marcel! Thank you.
@Nicolas,
You pinpointed it exactly.
Phases 2 and 4 are not the problem.
Is it a strange Idea to use a moving average enveloppe over the high/low with a certain %deviation over a certain amount of periods to create a kind of a flat range for phases 1 and 3?
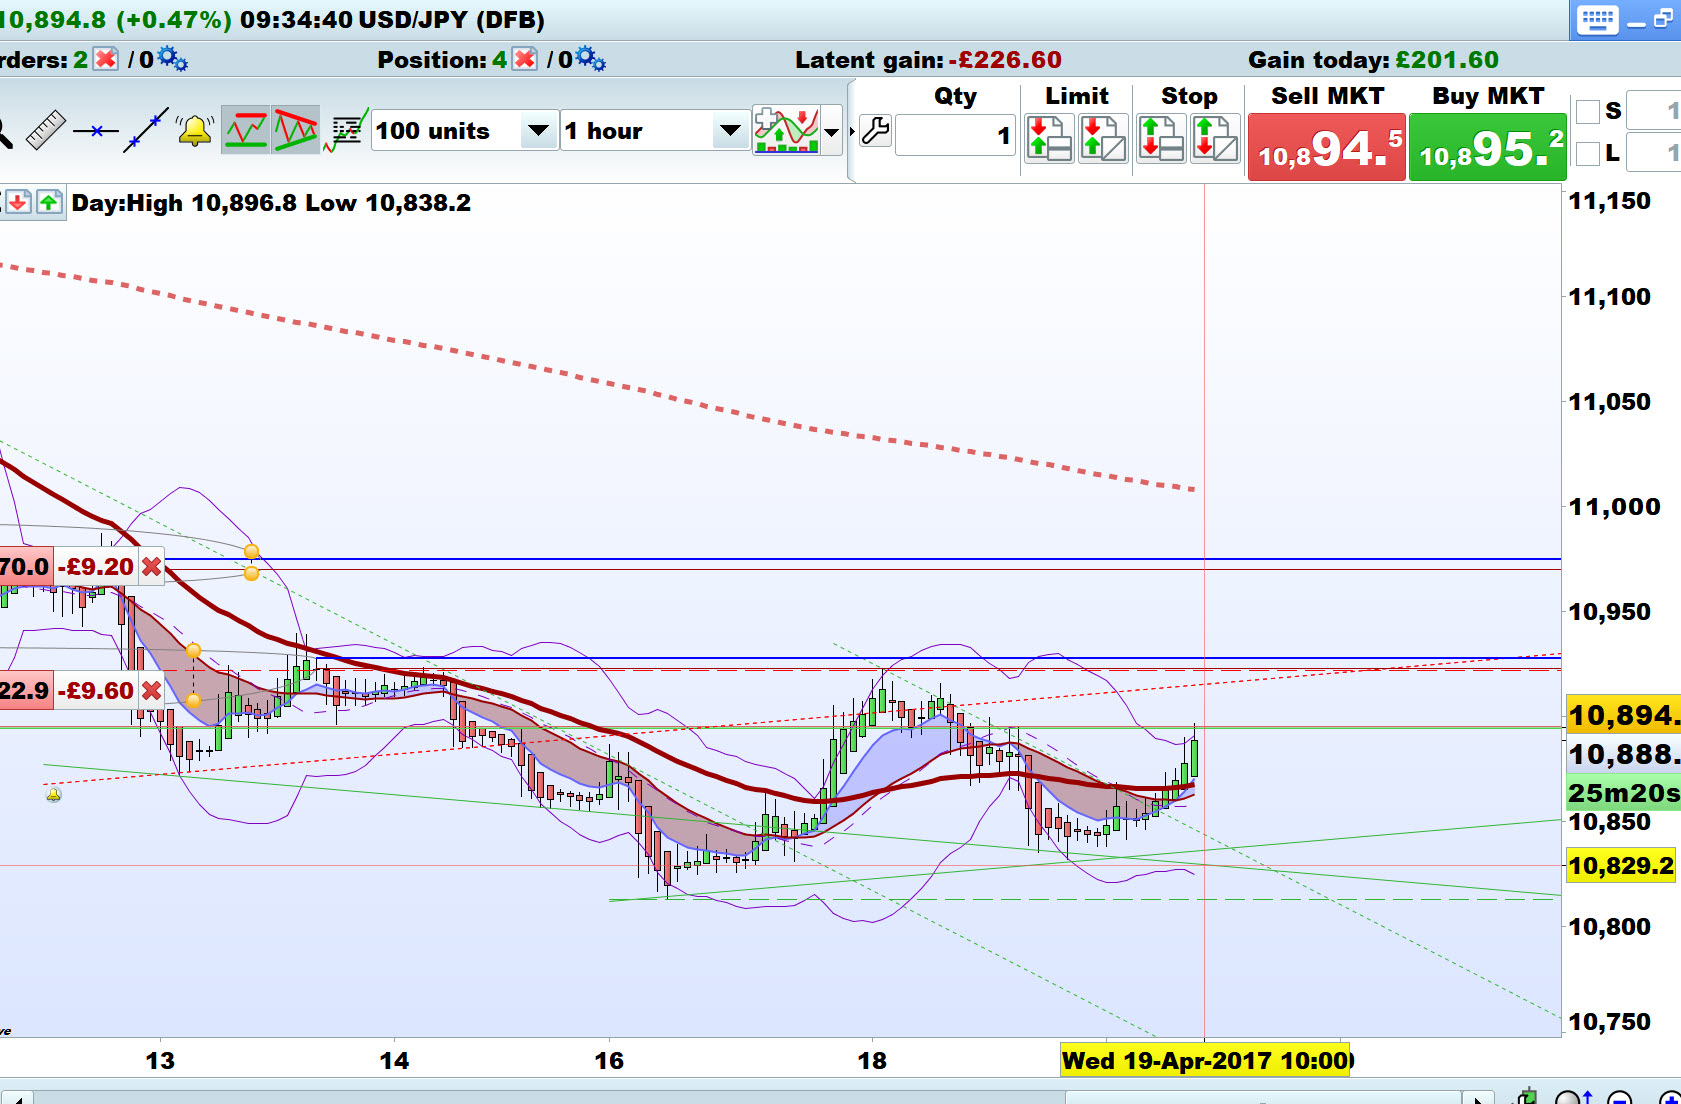
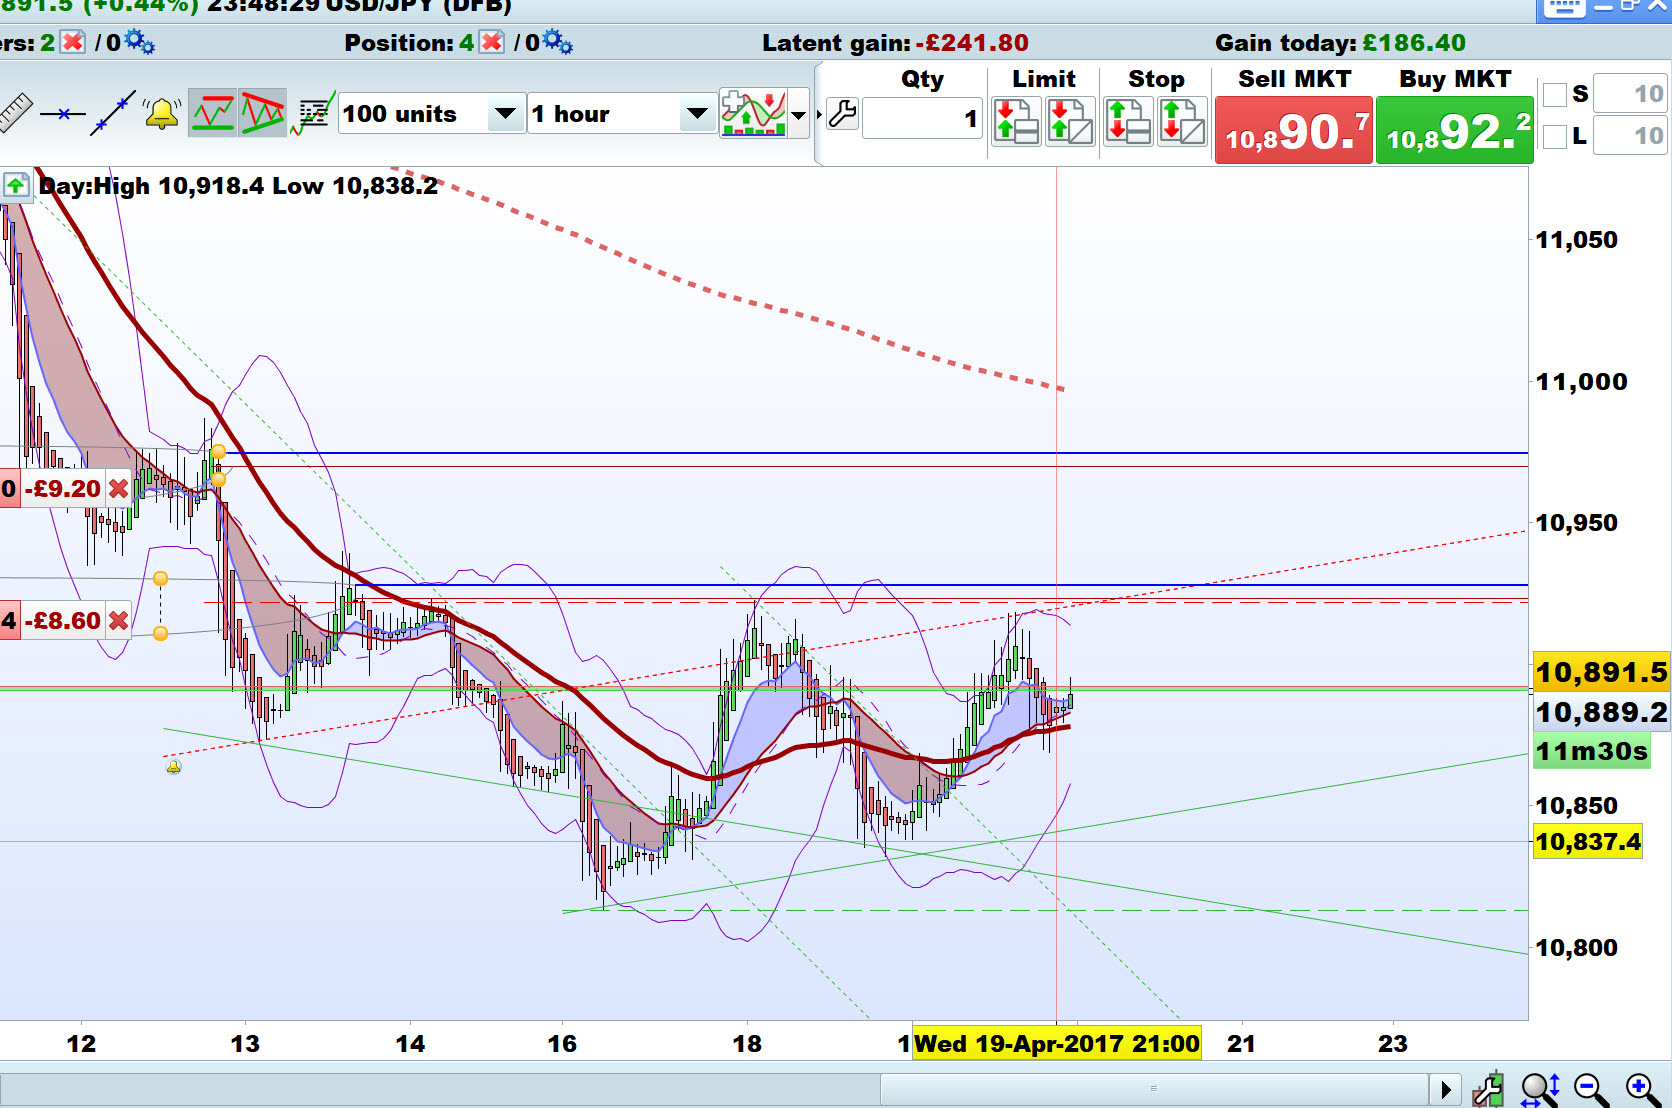
@Marcel no it’s not strange, it’s a good idea to use a flattened MA with % deviation, this will detect a Stage 1 and 3 … see attached example of MA(60) on 1H TF on USD/JSP.
GraHal
@GraHal,
Yes, thanks a lot. This is a pretty good visualisation of my idea. If we can put this and the phases Nicolas described into one strategy, I think we have a solid base to tweak it from further. I only have experience with the 4 phases on the daily and weekly timeframe. I think a larger timeframe, a higher MA and a tweaked % will smooth out ‘the bands’ even more.
I use Stages all the time in my manual trading and often look for a breakout / breakdown after a period of flatness; this can often be dramatic … longer the base, higher into space (is the breakout). mmm I think that’s the expression! 🙂
It works at all time frames, I manual trade using the 1 minute and even 6 seconds and it happens / works on short timeframes also.
I’m keen to get a strategy coded up that is based on Stage Analysis … it’s easy to look at a Chart and see it all but not easy to code it.
You any good at coding? 🙂
It’s a pity we can’t form into Teams of some sort as there are thousands of users of this site but not much collaboration between members? If anything happened to Nicolas and / or the few who do help with coding problems then we’d be sinking fast??
GraHal
Hi Marcel
USD/JPY is still ranging but creeping up (attached), I reckon it might breakout tonight / tomorrow.
All we need to do is code up what we see … as a trial!? 🙂
MA % Deviation could be circa 0.3% for attached?
GraHal
Hi GraHal,
I agree with your breakout to come. The problem is that I am new to coding after about 15 years experience in trading manualy and my English language is too poor to translate the coding manual. The way I see is the only way to get this strategy working is to form a team. We do allright till now right?
Greetings from Holland,
Marcel