Speaking of TradingView @Macro_trader…I came across this a couple of weeks back and I am not sure if it’s accurate. I think it’s worth looking into though. The code in that tradingview link you put in the thread could technically be converted to excel, it would just take a bit of reverse engineering 🙂
https://www.tradingview.com/script/8nmHQ1Xr-DDAP/
Looks like we are getting closer but when displaying the data on Trading View charts and then applying KMs risk ranges they don’t quite match up. Keith mentioned the RR last week and said the key input was the volatility. He said ‘x’ level in the Vix gave him a risk range high in SPY of ‘x’. So we know the Vix or at least 30 day implied Vola is a key input into the model. The next question is how on earth does one use that for individual stocks?
I have been following @kerberos007 on Twitter and he’s a master of ML and coding etc. I reckon if anyone could crack it he could!
Hi all,
Does anyone have a spreadsheet that calculates a 30-day rolling hurst exponent (or any other short period)? I think it’s a key part of the RR calculation.
Also, does anyone have any thoughts on how KM calculates the Bull / Bear trend lines? I was thinking it might be a 60 day hurst exponent calc, but not sure.
Thanks
Hi all. I recently re-read an Early Look that I think gave some strong clues to how the Risk Range is formed!
Keith mentioned on 11 Dec:
- Total US Equity volume (ic dark pool) decelerated 18% day over day
- Front month Equity Volatility (VIX) went from RR low end in AM to RR top end in PM
- IVOL on SPY went from -12% discount (vs 30 day RVOL) to a +17% Premium by the close
“…these are the ROC facts about Price, Volume and Volatility in particular moments in trading time where making buy/sell decisions mattered.”
So, maybe these are the factors combined with price and maybe ROC from the previous day’s prices that factor into the RR???
So!
In the Early Look last week KM told us how the RR is calculated, well, largest hint yet!!
He said ‘My re-scaled range (Mandlebrot) Risk Range process isn’t opinion. Its fractal math!’
So maybe now we have this we just have to figure out how the re-scaled range and volatility (which seems to be IVOL) is merged and calculated into a Risk Range??
Hi all,
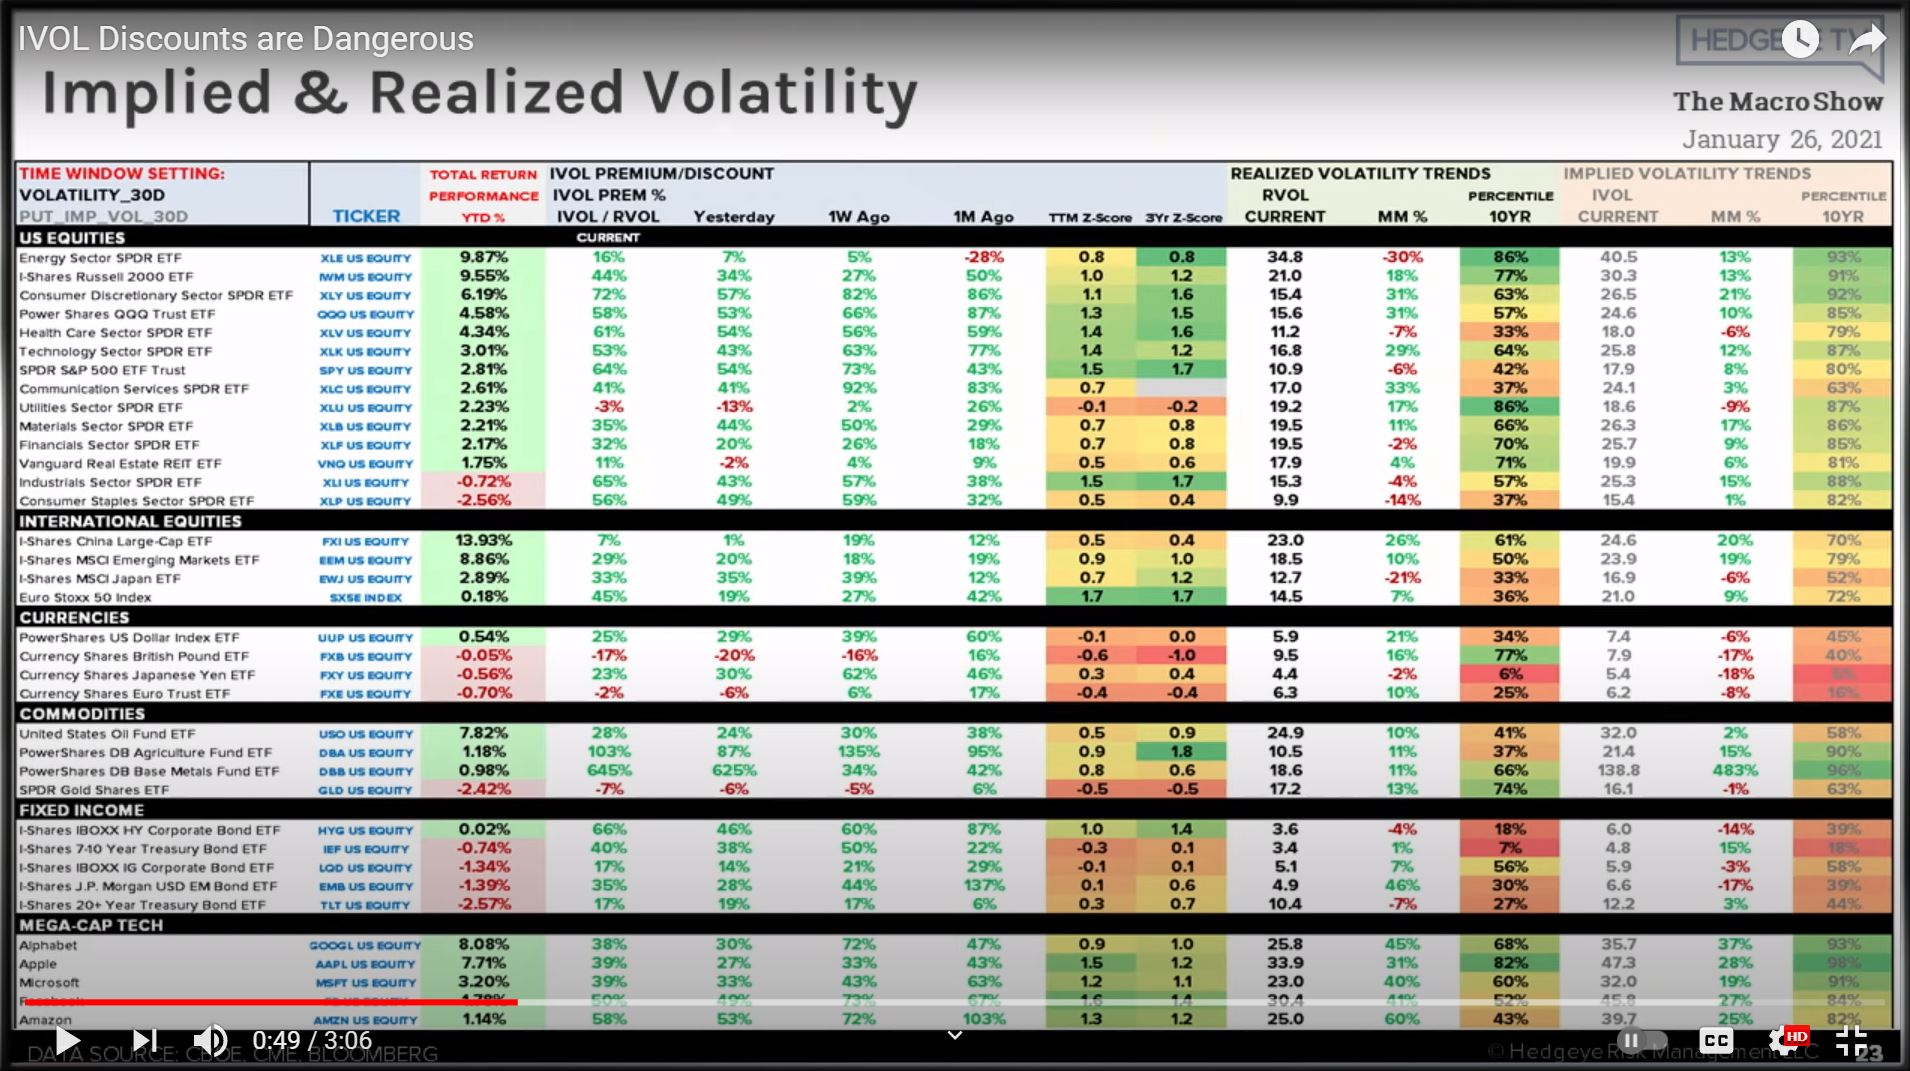
I’m not sure if this will help in the discussion at all, but I have this screenshot of Keith’s “Implied & Realized Volatility” spreadsheet from a clip from The Macro Show on 1/26/21 (free on Youtube). It’s what ultimately brought me to this discussion and forum, just trying to figure out the secret sauce. Maybe it’s helpful for those of you who are much more mathematically than me…?
Very informative thread, so thank you for that!
@GP44
Thank you for your comment where you went through the ivol of calls and puts in detail. I think there’s definitely something to the strategy you mentioned that gets us closer, and you’ve convinced me it is superior to the donchian channel method. Your comment helped point me in a better direction. To answer some of your questions about why I calculated a few things the way I did in my sheet, have you ever heard the expression: “if you can’t tie a knot, tie a lot?” I kept playing around with the numbers until they got closer. One issue I was having was figuring out the “correct” way to calculate vol and ivol; it seems everyone has their own opinion on how to calculate it.
But the VIX is the gold standard, so I decided to create a program that will let you run the VIX calculation on any stock. I painstakingly followed the VIX whitepaper to the letter. To the best of my knowledge and testing, the math is accurate, and the output appears to be accurate. It’s pulling option chains from the TD Ameritrade API. To run the program, you will need a TD Ameritrade API key, but they’re surprisingly easy to acquire, your grandma can get one too. I’ve included instructions on how to use the program, and I tried to make it accessible to everyone, but feel free to reach out if you want to play around with it and run into issues. One thing to note is that the math does start to break down when applied to stocks with extreme option prices. For example, Gamestop will output over 8000. I get the impression the CBOE didn’t intend to use this on anything else besides the S&P, but for most big name tickers, the output is reasonable.
I now understand a lot more about how option prices are being used to calculate vol. I’d like to try and use the same approach I used here to programmatically calculate your math @GP44. I think there’s something to it.
Thanks again, and I’m glad to see this thread is still going.
https://github.com/AlextheYounga/vix-vol-calculator
@JohnLawsCarriage
I just wanted to help guide your energies before you went too far down the IVOL rabbit hole like I have… I don’t believe IVOL to be the correct number Keith is using in the RRs. Why? IVOL is the output of the Black Scholes model, which considers volatility constant across time. So it is the average volatility that can be extracted from all currently priced options. Practitioners have a saying, “the wrong number(IVOL), in the wrong model(Black scholes), to get the right price(current market prices for options)”. However, as Keith says, “It’s the particular thing at the particular time that matter.” So, what does that mean? We need a particular volatility figure to use in the RR. Now to introduce: Local Volatility. To go a step deeper than the average volatility, we can use the average volatility, all the currently priced strikes and break them down to find the specific volatility figure to price that option (Dupire).
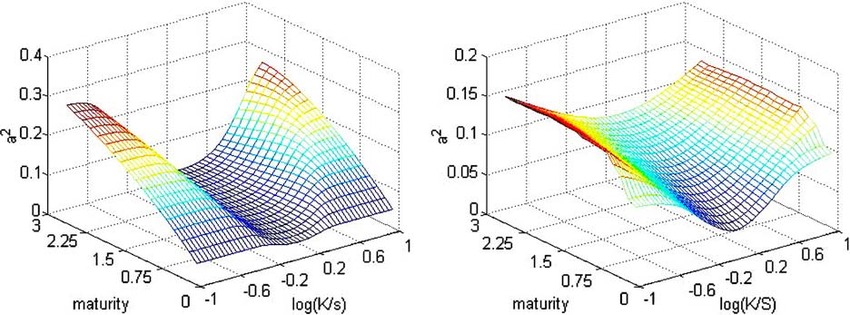
Why Local Volatility? Volatility is not constant across time (Volatility Surface). The Volatility Surface tells us that short term volatility (ST Vol) is expected to be higher than intermediate term volatility (IT Vol) and maybe lower, or equal to long term volatility (LT Vol). These relationships change very frequently – whenever a trade happens and provides real-time insight into what the market (the machine) is thinking about expected volatility over various time horizons into the future. That being said, by using IVOL we are likely understating volatility for short term forecasts, such as the RR.
After all – it is the particular thing, not the average of things that matters most to KM, and market participants in general.
I’m still working through things myself, especially how to back out local volatility from the weekly strikes and IVOL, and then re-scale the time frame down to a 1-day time period. If anyone here is pretty decent at partial differential equations and wants to work together closely on this, I think we could be getting closer to the truth.
I attached a picture of the Local Volatility Surface.
Happy hunting gang,
Andrew
> I’m still working through things myself, especially how to back out local volatility from the weekly strikes and IVOL,
Jim Gatheral’s TVS book – pg 11 – 14. I’ve seen KM wave the book around on the show once – doubt he really understands the entirety of the subject.
@alochemes
I’m curious as to what you mean by local volatility as I’m still not entirely sure I understand the concept.
I understand your criticisms of the Black Scholes model, I share them. Scholes himself lost his shirt using that model. But the concept of implied volatility is not dependent on the Black Scholes model. The Black Scholes model as I understand it is generally used to find the “fair price” of the option. If you ask me, the “fair price” for anything is what the other guy is willing to pay for it; that’s basic economics, Mr. Scholes. I think @GP44 said it perfectly: the real question is, do you believe there is useful information embedded in option prices? The more I’ve played around with the VIX equation, the more I’ve become convinced that there is. When I first started playing around with the VIX, I was doubtful. It almost seemed like a neat party trick. And although there are some parts of the equation that seem needlessly complex, (or perhaps way beyond me), I think these guys were really on to something; the core concepts of the VIX actually make a lot of sense.
The math aside, at its core, all the VIX does is this:
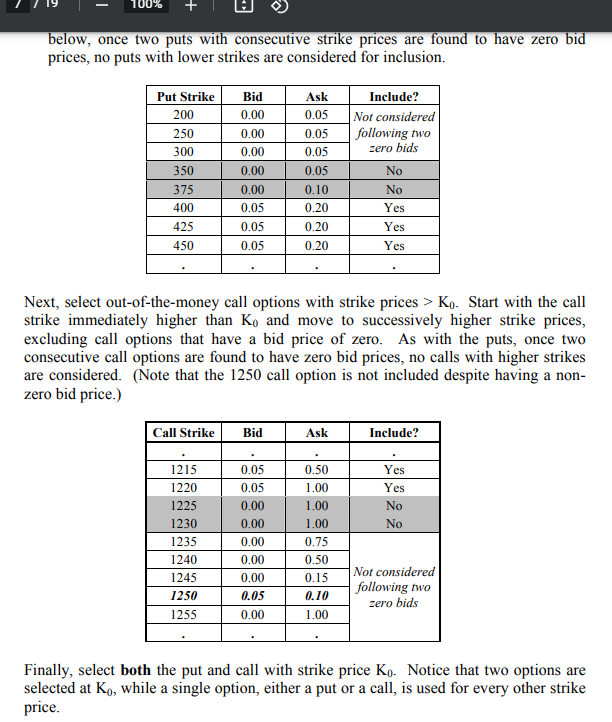
1) Find the most competitive option contract on the market for this month and the next – that is, the strike price where the puts and calls prices are almost equal. They call this the forward level.
2) Starting from that forward level strike price, go up and down the list of strikes until the bid prices start to drop off to zero. Once you hit two strike prices in a row with a zero bid, you stop going any further. (see screenshot for more).
Basically all you’re doing is creating a range of prices where speculators have the most skin in the game. It’s that range that the VIX uses in the equation. I didn’t see anything when building the equation that suggested it would act like a volatility constant. On the contrary, the price changes each minute by design. One of the main variables is time to expiration in minutes.
The VIX is not perfect by any means, but I think I’m convinced it does what it sets out to do rather well, to get a number that represents the concept of implied volatility. Not to mention, we can be pretty sure the major market algorithms are all using something close to the VIX.
Great to find this thread to see so many people doing what I’ve been trying to do on my own.
I have created my own risk range approximation tool I call “Bridge Bands”. You can add it to XXXXXXXXXXXX.
If you’re interested in a more in-depth explanation of how these work, join the growing XXXXXXXXXXXXXX.
Search “risk range meeting recording” once you join for a video explanation. I will say bridge bands are more of a coincidental workaround than anything close to what KM is actually doing. What I’m looking to do is take some of the principles I’ve laid out already, but apply it to implied volatility instead of price. I understand the rescaled range calculation but still do not understand how to apply it to achieve an actual price range. I read this entire forum and found some helpful hints and things to explore further, so thank you all for that. Hope to collaborate further as I learn more
@joecat808
no personal info and data, nor external info/links to other platforms other than ProRealTime can be posted.
Thank you 🙂
No personal info was shared. There are links all over this forum to papers, videos, etc.
There’s even a TradingView link at the top of this exact page.
But ok.
@joecat808 Rather draconian rules indeed.
@robertogozzi
This post in particular has already brought multiple people to create an account on this platform, myself included. If you search “risk range” on Google and DuckDuckGo, this is now the second/third link in the search results. We’ve somehow managed to get this post just below Hedgeye’s ads. I imagine this post is generating a lot of traffic to your site. If you’re employed in any way by this platform, you are currently benefiting from this ongoing discussion, as is.
I don’t believe it’s in your best interest to strictly enforce this rule.
If you’re employed in any way by this platform, you are currently benefiting from this ongoing discussion
Moderators are not employed by the forum platform. They work for free in their own spare time to assist forum members with code and to help keep the platforms tidy and well organised so that they can be a useful source for everyone interested in PRT.
The forums are owned by Nicolas.
I have asked him off forum if the TradingView code in the deleted link could possibly be converted to PRT code and hopefully when he has finished enjoying his Sunday he will let us know whether it can or can’t and perhaps add it to his very long list of free code conversions.