Great discussion, i’m also a RR subscriber but wanted something i could apply to individual stocks not covered in the RR. I’ve been using Buddy Carters algo [[60d ATR * 10d SMA of Actual Daily Range as a % of 60d ATR]] but that always results in a Range which is always evenly split. I’ve been trying to work on getting the x% upside x% percent downside ranges that Keith produces.
That question was great yesterday and had me googling Hurst Exponents and that’s how i found this forum, i was hoping he might be using something similar to Buddy’s formula as volatility metric and using Hurst result to skew the range higher or lower depending on the trend strength.
Hi guys and thanks for the continued discourse!
You beat me to it. I think Daryl raised his eyes at the ‘newbie’ question concerning the IVOL/RVOL discounts and premiums, but I’m glad that it was asked as it lead to further clues with the Risk Range. I noted Hurst Coefficient and Hurst Component. When I Googled these I came up with various links showing the Hurst fractal math can be applied to time series. Bingo. Then it got a little deep for my coding and mathematical ability! Of note was that Hurst close to 0.5 was a Brownian (ie random). Hurst 0-0.5 was indicative of a time series subject to ‘mean reversion’. Of note, I found a few articles where Hedge Fund / CTA algos had been using the Hurst <0.5 for pairs trading, hoping to find pairs trades about to mean revert. That leaves a Hurst >0.5 to 1 (can never be greater than 1) that indicates a time-series that is ‘trending’
Regarding the volume, I still don’t see how these tie into the RR, other than Keith’s slides from the Macro Show each day that show the previous day’s volume compared to 1 day, 1 month and 3 months. When we have a large up day but on low volume (relative to previous day) it often shows a move that is losing strength.
This site is quite useful for a Hurst explanation.
I can’t work out if the RR changes due to the trend – or if the values are always the same, it’s just Keith changes the top and bottom of the ranges to sell/buy depending on his trend? Let’s see if we can collectively dig deeper using the knowledge we have shared here, by asking pertinent questions on the Macro Show this week!!
I forgot to add this week, that Keith mentioned that the bottom of the risk range in SPX was a direct function of the VIX that day. So SPX 2782 was tied to Vix 42.32 (high of its RR)
 p2
p2Participant
New
“Donchian channel” is a classic “moving monkey” indicator 🙂 Its pretty basic, in the sense that it provides you with an upper band and a lower band. I played with different inputs and I finally got something that produces close to what Keith provides. Keith’s way of creating risk ranges is definitely superior imho, besides, he attempts to predict today’s range from yesterday’s numbers…. DC indicator lets us start with a basic risk range. But at the low end of the range and sell at the high… we can apply fractal math on this and improve it. Eitherway, the DC indicator with an appropriate length is within 1-2% of keith’s numbers (except for very high IV situations). This accuracy is ok with me for most equities trading that don’t involve leverage. Try it out and see if you can customize/improve it for your style of trading.
hope this helps.
This is an interesting paper that I came across while looking into Rescaled Range Analysis and the Hurst Exponent. I don’t necessarily think this is a good trading strategy, but was educational about how the Hurst Exponent can be used practically. The authors used a Hurst Fast Exponent (16 days) minus a Hurst Slow Exponent (32 days) to generate buy and sell signals when it crossed 0 (rising=buy / falling=sell). I thought this paper would add to the conversation. I also wonder if something like this could be used to confirm a bullish/bearish trends.
https://www.scitepress.org/Papers/2018/66670/66670.pdf
Hi guys – RTA and RR subscriber as well. I agree that volume probably does not play as much a part in this as most people think. For example, the FXY alert had very low volume until the RTA went out then voume spiked. I think algo’s are keen to his alert’s and trade around him pretty quickly. Just my 2 cents and glad to add where I can. Thanks for the discussion
@p2 After looking into Donchian Channels, really disappointed that I missed this. When playing with the numbers a couple weeks back I apparently made the start of a Donchian channel despite not knowing what it was, but I thought the numbers were a fluke, figured it couldn’t be that simple and didn’t keep digging into it. But I think Donchian Channel is the clear starting point, and then, like you said @p2, maybe he somehow uses the Hurst exponent to adjust the channel.
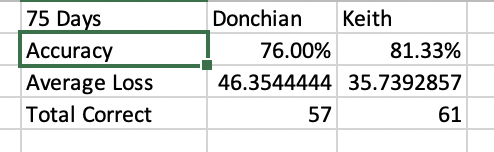
I just ran the numbers on the S&P comparing Keith’s numbers to a 16 day Donchian Channel (3 weeks in trading days), and the numbers are pretty close. Keith’s numbers are better, but definitely not by that much. I’m attaching a screenshot of some of the stats I ran comparing DC to Keith. The closing S&P price fell within Keith’s range 81.33% of the time, and within the Donchian Channel’s range… wait for it… 76% of the time. When Keith was wrong, he was wrong by an average of 35.7 points, and when Donchian was wrong, it was wrong by an average of 46.3 points, so Keith will save you by about 10 points on the S&P give or take.
Thanks for introducing me to the DC indicator @p2, definitely a breakthrough I think.
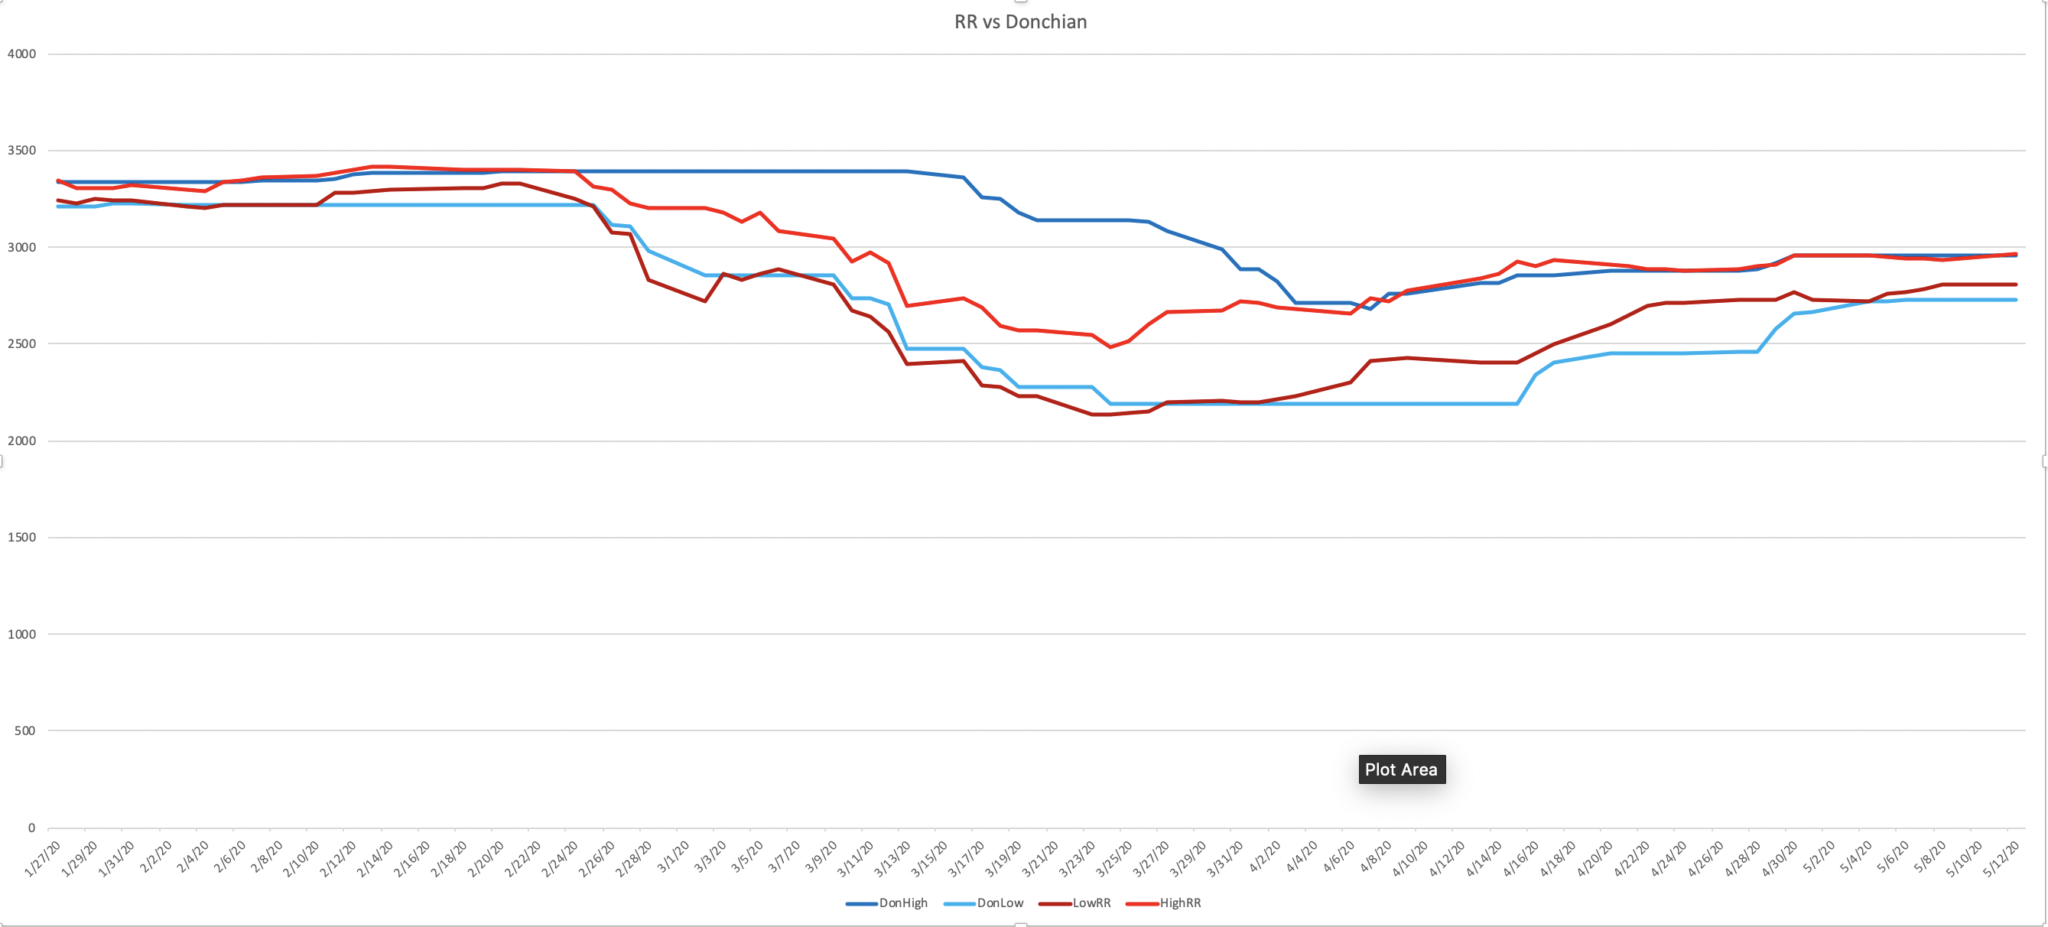
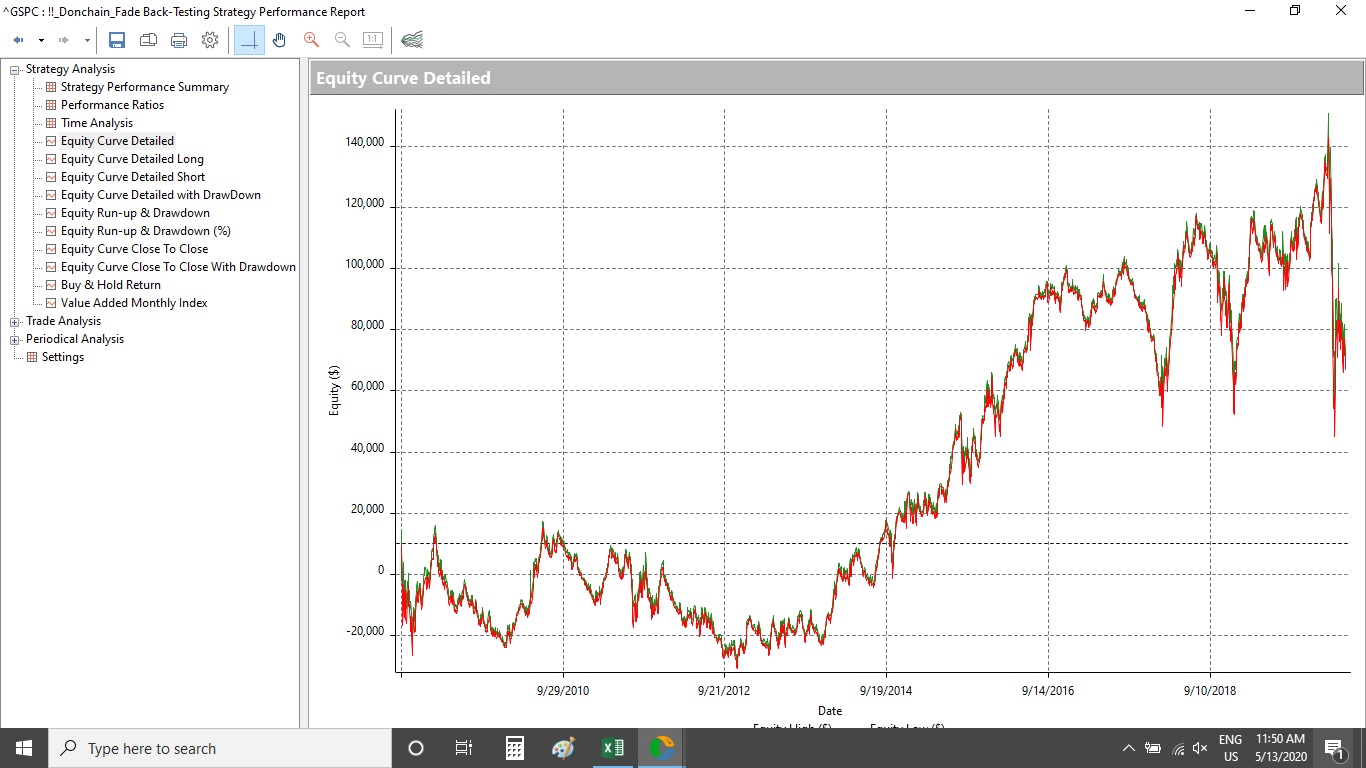
Where Keith’s numbers are superior to DCs is in big moves. Donchian channels can be slow to adjust to big moves up or down. Check out this graph and see how Keith’s numbers adjusted quickly to the market tanking in Feb/March, while the upper range Donchian channel was slow to adjust. I imagine that could be problematic on its own.
Thanks Guys. What DC are you using? The PRT supplied one and with what settings?
John. Nice analysis and graph. Promising. I see what you mean about the band width. Keith’s is more sensitive to changes. He mentioned today that the oil risk range has diverged as a function of OVX going from 115 to 85 today. I attended the RR call this week too and he was able to give instant RR on any stocks asked in the queue. I wonder if the Vola used in individual stocks is taken from the options market? The IVOL/RVOL function from put call strikes could be worth exploring.
Hey guys. John, are you only using the DC in your excel?
Daryl today was avoiding the Hurst question, so Keith is probably using it to adjust the RR levels. I’m also trying to understand what correlation does Keith use between VIX and SPX, do you guys have any idea?
Carlos yes I saw that Q in the queue and upvoted it. I presumed it was from John on the forum here!!
Looking at the DC it’s the same formula that Carver (ex AHL Hedge Fund PM) uses in his ‘breakout’ indicator. He takes it further using a ‘scaled price’ to ascertain trend.
If midline or average from DC is used it’s simply (price minus average) /( HHn minus LLn ). We know Keith and machines use 30 days but he alluded to sometimes using 60 day Vola a few weeks ago.
We know the low of SPX RR is a function of the high in the Vix RR so there must be a simple input here. Getting VIX data into PRT would be hard, only manually each day I guess?
Message for Carlos Ribeiro: please update your country flag in your profile, thank you 🙂
(hover your mouse over your profile pic in top right corner of current page, a menu appears, select “settings” and then “location”, thank you)
Gentlemen (for I believe there are no lady participant here),
I have followed your discourse with great interest and am sure in due course you will successfully meet your stated objective. But please allow me, with due apologies, to respectfully submit the following:
- Donchain Channels – made famous by Richard Dennis and his Turtle Trading system — are designed for BREAKOUT and TREND trading; even though in quite / sideways markets they can be profitably faded.
- Risk Ranges is clearly a REVERSAL method; for selling at the top end of the range and buying at the bottom end of the range.
- The two cannot be more conceptually different! And any correlation is merely coincidental, episodic, and extremely dangerous to one’s financial health.
@p2 even if a Donchian Channel of an appropriate length may be within 1-2% of Keith’s numbers most of the time; question remains what does one do when they do are not?
@JohnLawsCarriage
- I completely miss the why the closing S&P prices falling within Keith’s range 81.33% of the time, and the Donchian Channel’s range 76% of the time during a 75 days period may be significant. Should not the pertinent question be what profit accrued by selling at the top end of the 16 period Donchain and buying at the bottom end of the 16 period Donchain?
- If, indeed, what you say is significant, the difference is not savings of about 10 points on the S&P; rather the numbers are 1.3:1 in favour of Keith. In real money trading 1.3:1 can kill a trader on the wrong side, and make a fortune for a trader on the right side.
- That Keith’s numbers are way superior to Donchian Channel’s in big moves is absolutely correct; and it is almost always the big moves which kills a trader on the wrong side.
I am not YET proficient in ProRealTime code, but can do the needful in EasyLanguage. With APOLOGIES to the moderators and ProReal community, here is a basic 16 Period Donchian Channel fade strategy in EasyLanguage:
[IntrabarOrderGeneration = True]
Inputs: Length(16);
Vars: upBand(0),dnBand(0);
upBand = Highest( High, Length )[1];
dnBand = Lowest( Low, Length )[1] ;
If High crosses over upBand then SellShort (“DCfSell”) next bar upBand Stop;
If Low crosses under dnBand then Buy (“DCfBuy”) next bar dnBand Stop;
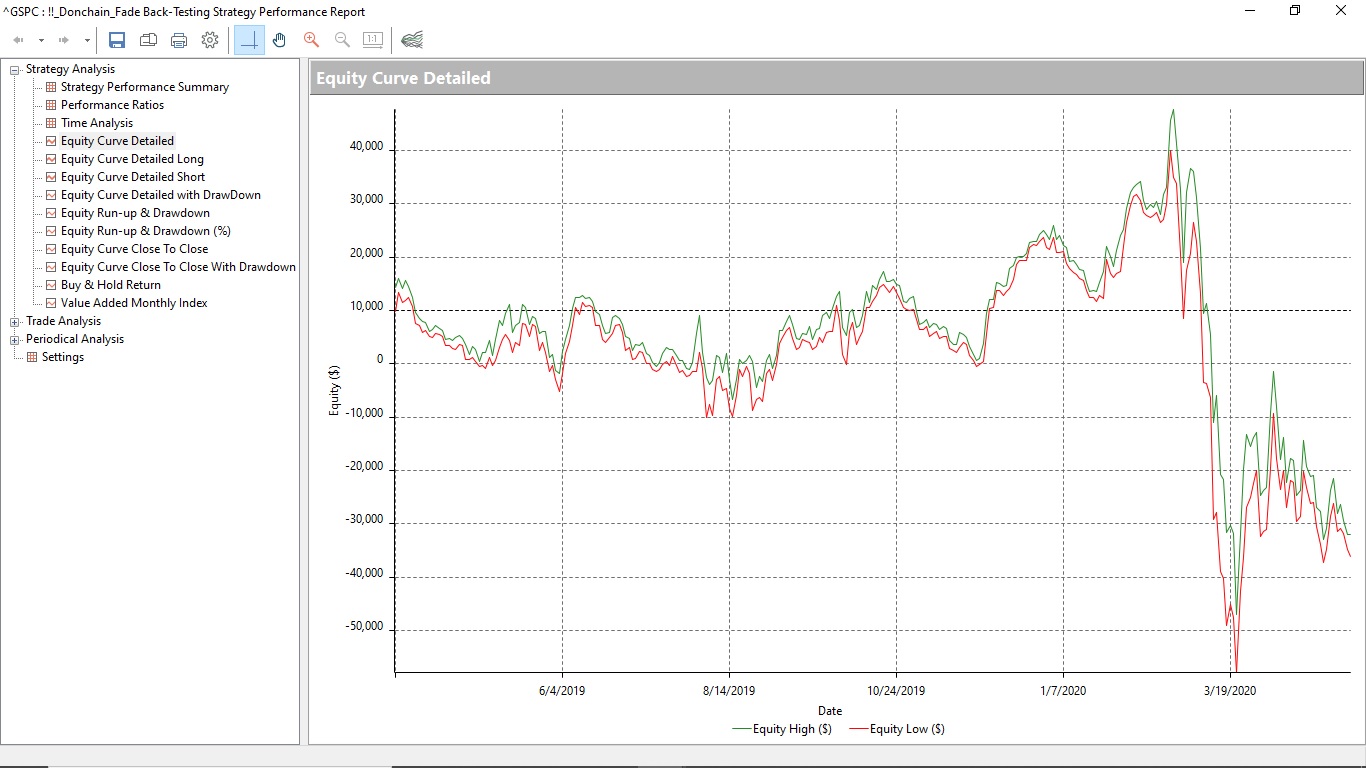
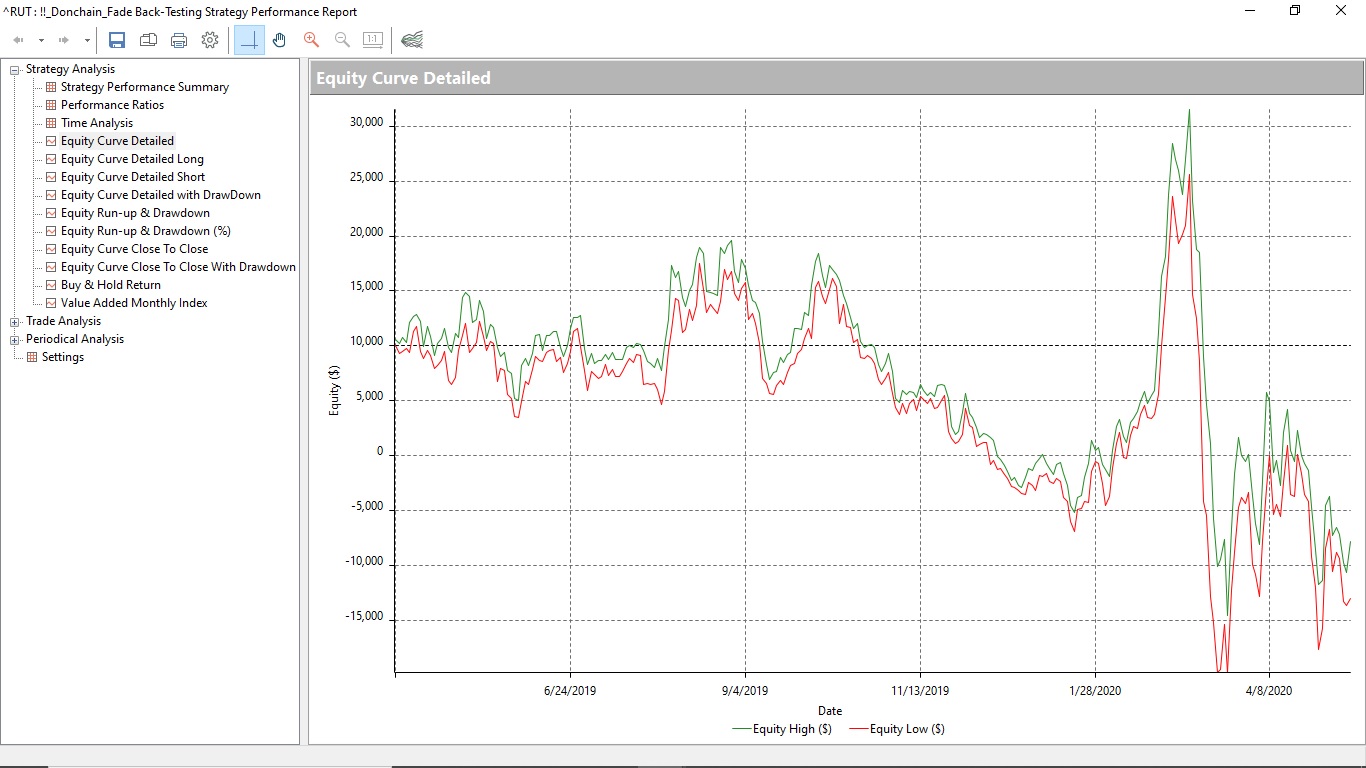
I tested this strategy on daily S&P 500 and Russell 2000 over August 2008 to date, and January 2019 to date. The equity curves are attached. There are probably enough wins fading 16 Period Donchain here to lure an unsuspecting trader?
Caveat Emptor!
I would welcome a scientific analysis and objective critique of what I have submitted. It is only by way of rigorous investigation can one find the answer, for science advances one funeral at a time!
Thank you.
I too have been looking to reverse engineer the HE Risk Range product. I save everything that is said or written into and Evernote file. I have also spent a lot of time studying the Rescaled Range as Keith has mentioned many times that this is an important part of his process. I know the Rescaled Range/Hurst Exponent is used to determine if something is trending, mean reverting or in Brownian Motion (random). My guess is that Keith uses the rescaled range to see if a position is trending or mean reverting and may adjust tactics accordingly. I think that he uses the Skew (not sure if it is the trend in skew or the skew itself) and the cost of hedging for the bullish/bearish trend decision while the Vol of Vol for each position is used to determine the risk range itself. I know Keith has mentioned that as Vol goes up the risk range expands, he has also said that as the vol goes down the top end of the range moves up (Macro Show last week). I have not figured out how the risk range itself is calculated or how the Volatility (and Vol of Vol) changes the risk range values. IVOL/RVOL premiums and discounts seem to be more of a trading tool (helps decide the rank of possible longs and shorts as opposed to being figured into the range) I am not sure how Volume plays into the equation.
I have attached my notes. I hope these help figure this out. While the risk range product is great and I have done will with it I want to be able to follow it closer during the trading day, follow some of the position not listed and the RR product and be able to do more Internationally.
Hey Everyone – I too have been working on trying to reverse engineer the RR. I have a bloomberg terminal so am happy to help pull any of the data, especially IVOL data that we think could be helpful here. Let me know what you need.
Hi wp20
I have been trawling the HE site and videos and KM made a good point that I think we may have missed. The RR is a quantitatively producer high and low for that day’s trading based on the previous n period close. Whilst some technical indicators might get close, as mentioned before the results /correlation are not statistically significant. Ergo, I think trying to use PRT to produce the RR could be a red herring. Maybe he uses Python code or Excel with an API feed.
In order to produce the RR for stocks he must be using options Put and call 30 day IVOL based on the previous day’s close?