@derricksikes
The short, one word, reason for the wider spread is VOLUME – yesterday’s!
The angle, of course, is in the details!!
For those of you digging in on Mandelbrot’s work, this site has links to what Yale considers his 14 most influential papers. It includes the paper written with Van Ness mentioned during the Hurst discussion in Chapter 9 of The (Mis)Behavior of Markets.
https://users.math.yale.edu/mandelbrot/webbooks/wb_top.html
how useful are the riskranges they provide? would you guys recomend subsribing to it?
@snucke
Keith McCullough is very good at what he does. But only you can decide if Risk Ranges are right for you. Risk Ranges are intermediate term support and resistance levels — PIVOTS, if you like. If that kind of trading appeals to you, do explore them.
By the way, Risk Ranges will not make you money; The Process will!
Best.
 JL
JLParticipant
New
Does anyone have the SPX risk ranges for May 19, 20, 22, 27 & 28? I’m missing those data points.
If someone could post those ranges I would be grateful.
And I only began collecting the SPX risk ranges on April 24. If anyone has data prior to that that would be helpful also.
Thanks.
Hi PJ –
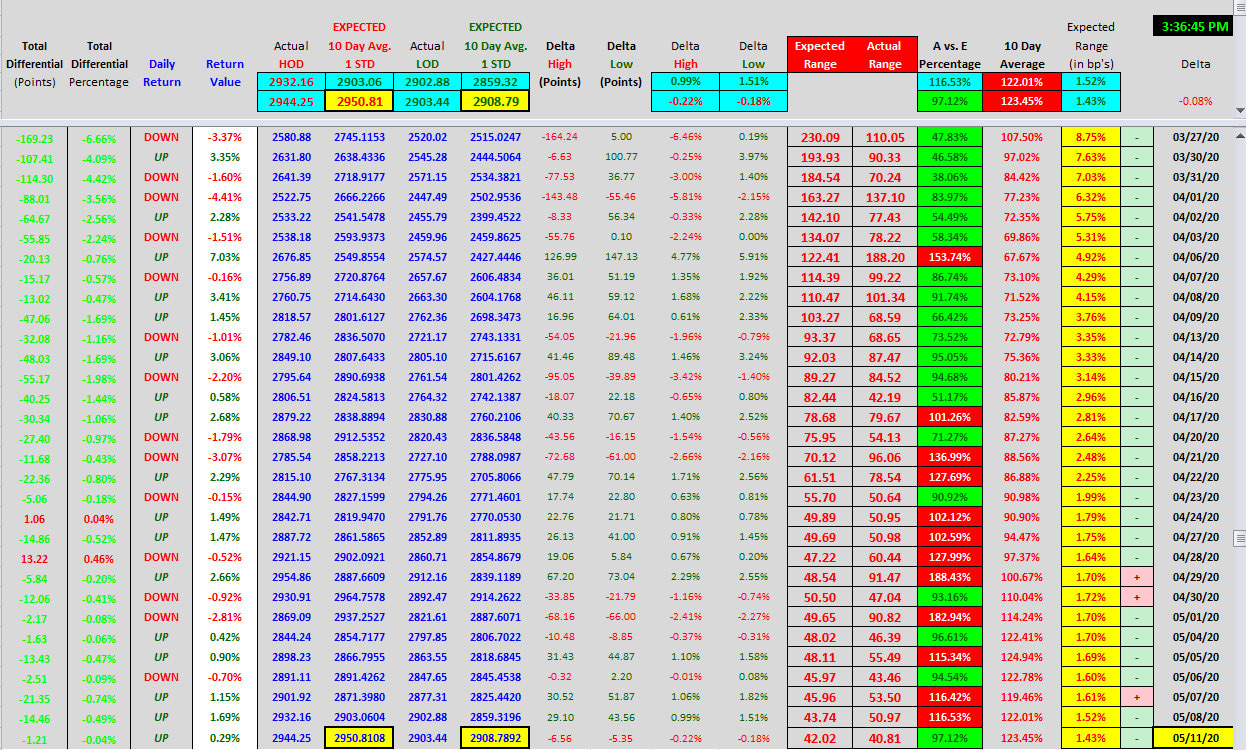
I’ve been trying to replicate Buddy’s expected range calc from some charts he’s posted on Twitter but I’m clearly doing something wrong. Are you able to post an Excel file with the actual calc or post an example of how you calculate it (I see the formula Buddy uses but I must be doing something wrong because my calculated range is different than his)? Similar to you, my guess is Keith’s range uses some version of this expected range with adjustments to the top and bottom of the range.
I attached a table with Buddy’s expected range in case it’s useful to anyone.
thanks
@JL
Here you are. I built a program that grabs the risk ranges very easily. I don’t want to give out Keith’s sauce to the world though, I’m not sure if it’s the right thing to do. So I have it password protected. It will prompt you to enter two passwords, just use the same password twice. The password is the sell trade, the high end of the risk range, for the NIKKEI 225 INDEX in today’s (June 1st) risk range sheet. I have data going back to late January.
Hope this helps.
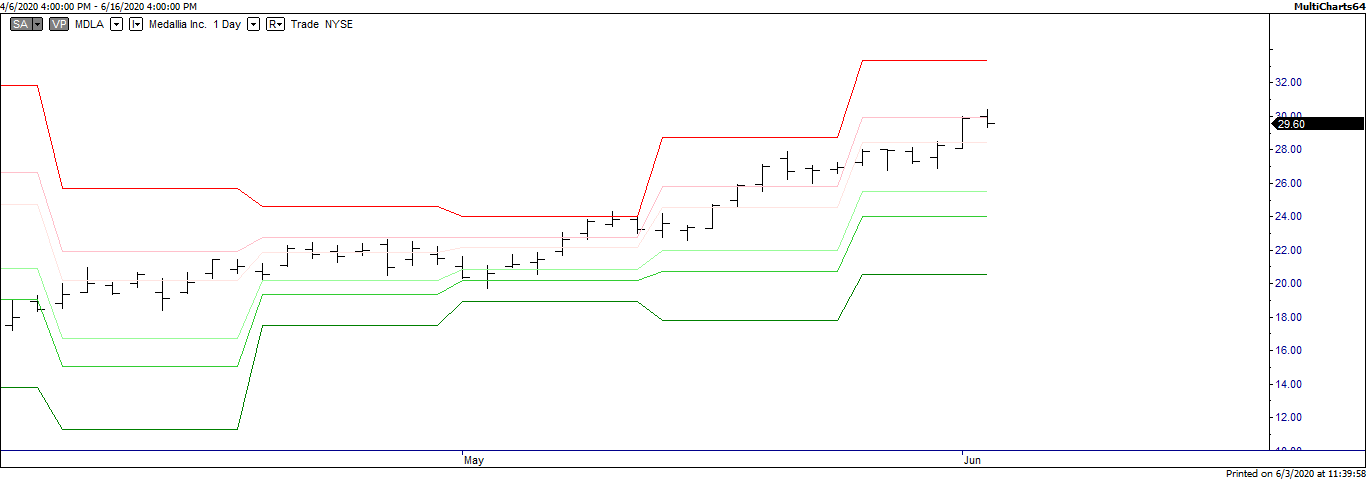
With your formula, can you also calculate a risk range for example of MDLA? Is the HURST coefficient import in the equation?
Thank you!
@JohnLawsCarriage
Thank you for the RR’s, but I don’t see any calculations – simply the daily rr’s typed into spreadsheet. Are you actually calculating the ranges or is your program grabbing the numbers from theie website/product sheets?
@KillJoy
Thanks for this. Are you able to provide some more detail about how you are calculating the MDLA ranges in the chart and the probability estimates? Also, what leads to say MDLA was clear buy on May 5…Just trying to learn. Thanks again!
@Macro_trader
What formula are you using to calculate those ranges?
Thanks!
@Macro_trader
@Carlos Ribeiro
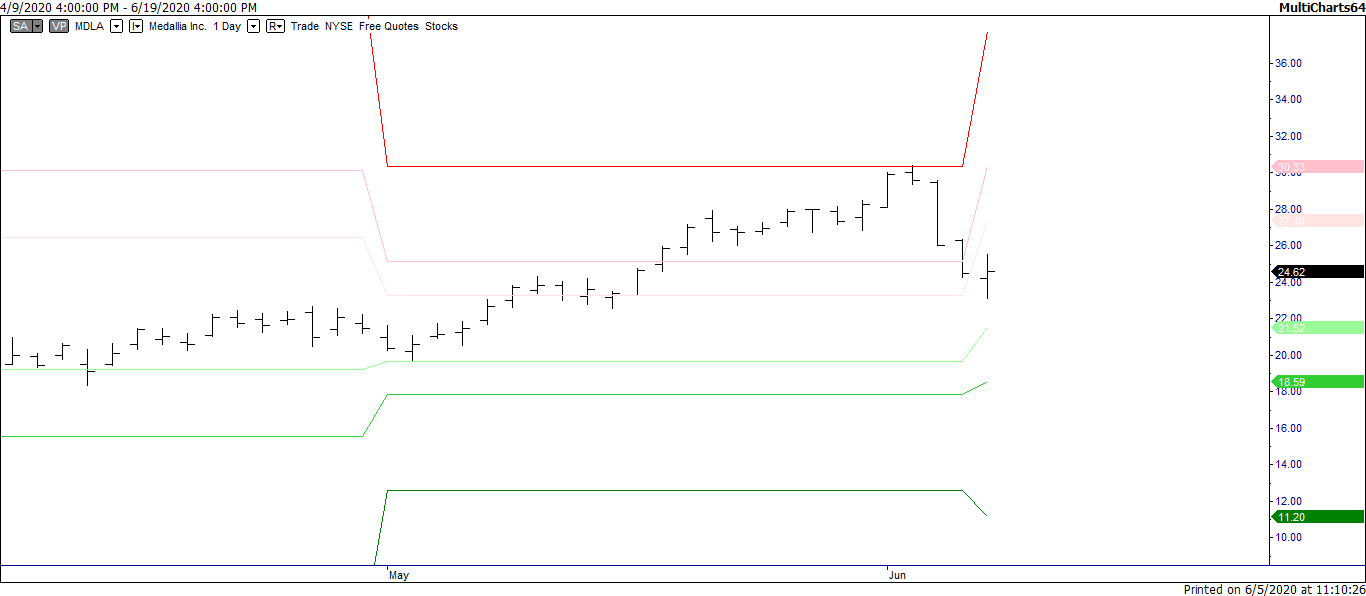
You will have to excuse me for not responding as asked today, or the next few says. It is 2:20 am past midnight here and I have no strength left. Nevertheless, I will hasten to add the lines on the chart are end of day prices volatility-based support and resistance; they are NOT ranges, or predictive turning points levels of any kind!
Thursday and Friday I have prior commitments, but I shall write full disclosure in detail Saturday and Sunday.
Please bear with me.
Thank you.
MDLA SellShort is in fun territory now; if one can manage risk in the expanded volatility environment.
Hi Guys
I found the below in another forum that could be of interest?
First of all let’s describe the strategy I used, the strategy would consist in two filter crosses with :
A main filter who aimed to provide optimal noise removal while keeping high reactivity and a signal filter who aimed to provide optimal crosses with the main filter.
Those filters where based on two groups of filters, the main filter F was using :
An exponential moving average , a fractal adaptive moving average , a least squares moving average and a recursive filter S described as follows :
S = (p*price+(1-p)*S) + k*(F – F’)
Where p = running hurst exponent estimated via the rescaled range method and k = square root of p
The signal filter F’ was using :
A least squares moving average , a simple volatility stop and a filter S’ described as follows :
S’ = (p*price+(1-p)*S’) + k*(F – F’)
Each filter F and F’ is calculated from a weighted sum that maximized the equity function of the strategy. Because I wasn’t patient I tossed aside the optimization of the filters settings and used a period of 50 for every filters in the main group and a period of 200 for every filters in the signal group.
The optimization of the weights was done using gradient descent, because I was in a hurry I just used the weights found after a low number of epochs. Everything was done wrong, from picking the filters in the groups to training and testing the model.