ALE
ALEModerator
Master
@EVERY
In my demo account Pathfinder AG Jan swing V1, closed position @ 09.46.31 (utc +1) @ 1696,2
Profit 652€
Hi
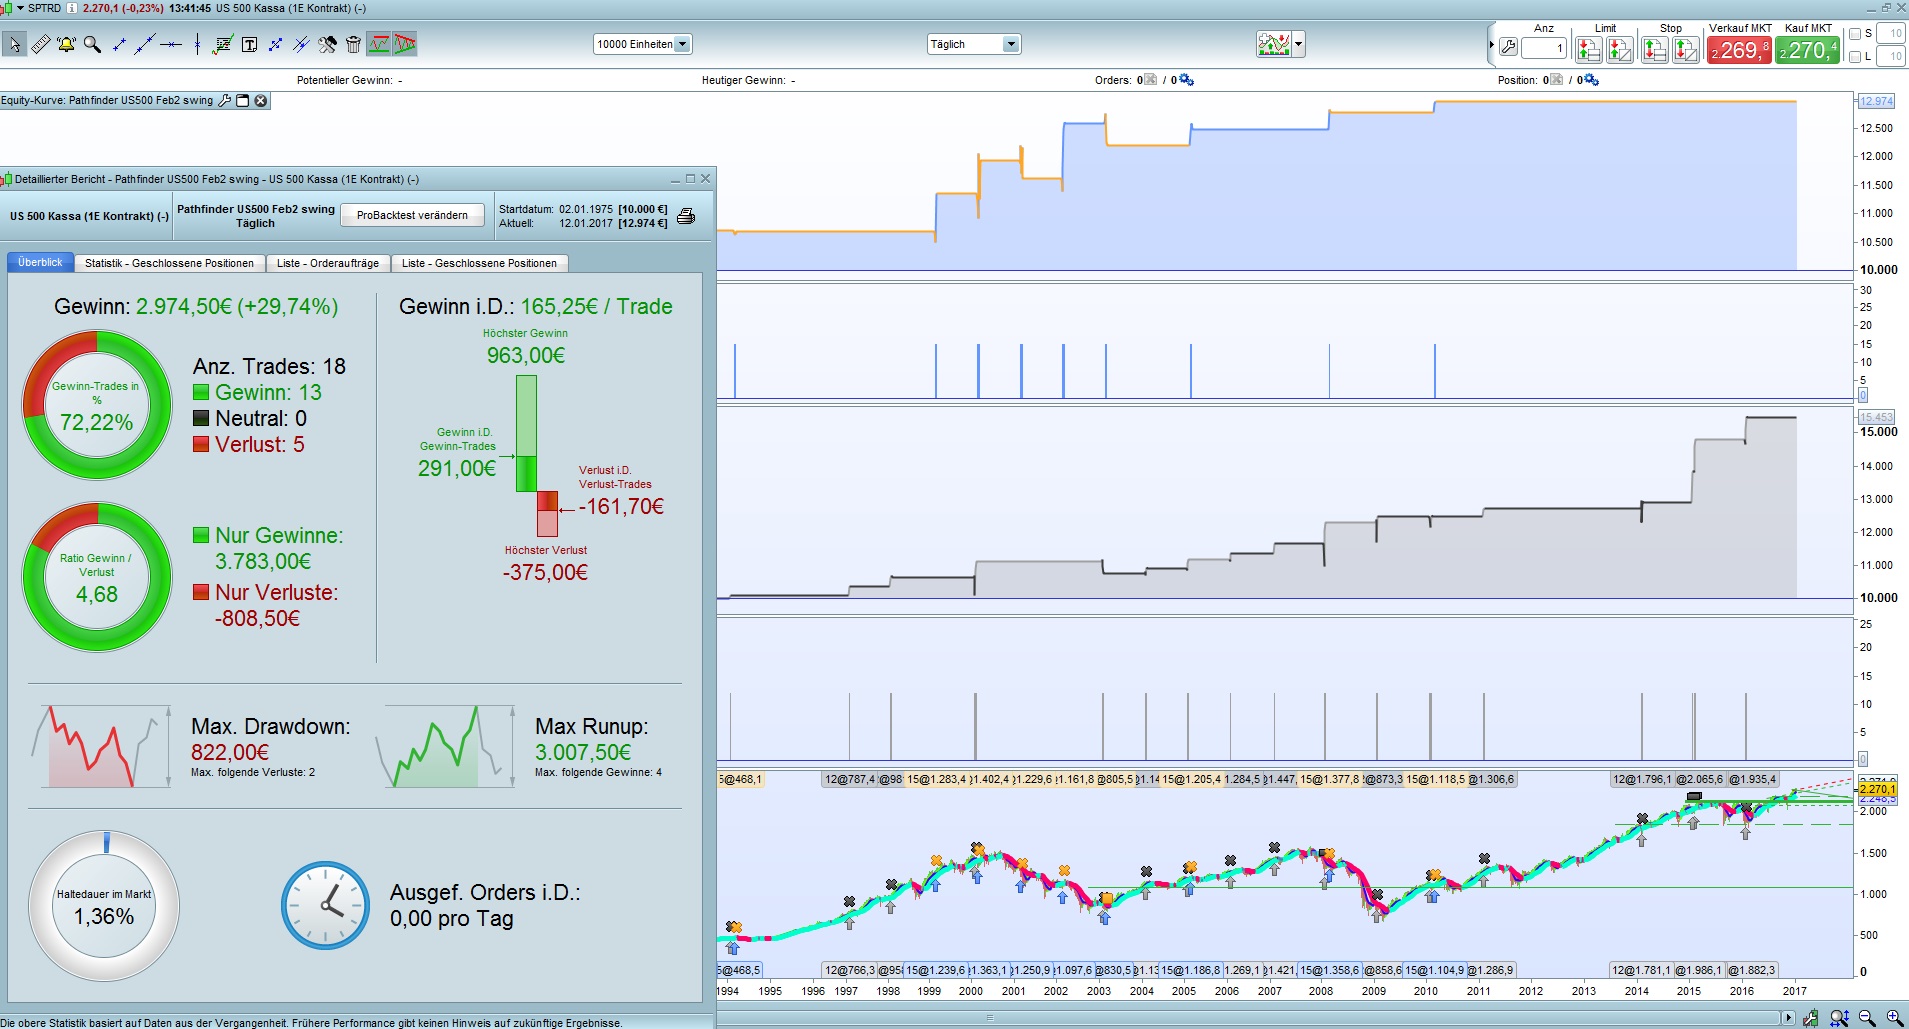
In the attachment US 500 Feb2 backtest from 1975 – 2017. 72.2 Gain trades and 8.22 Drawdown. But In 42 years 2974.50 $ gain is not wat I like.
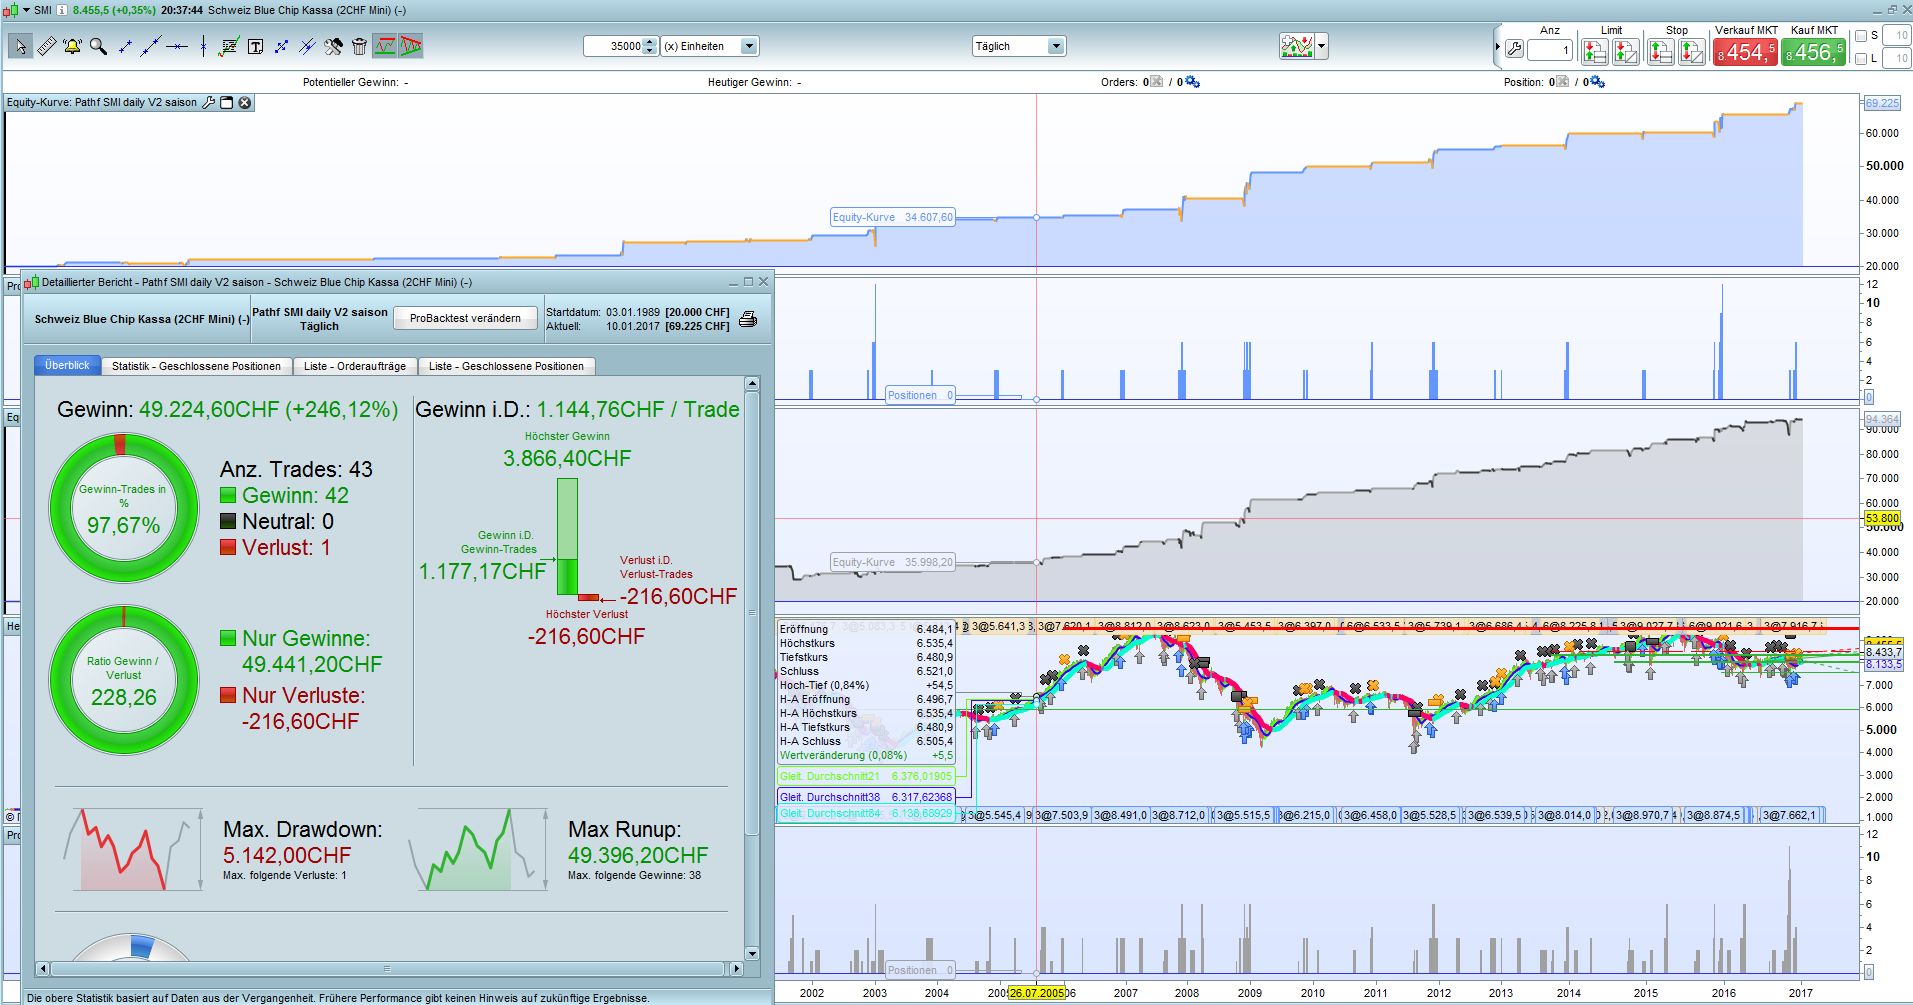
I go back to test SMI.
Michi
Hi
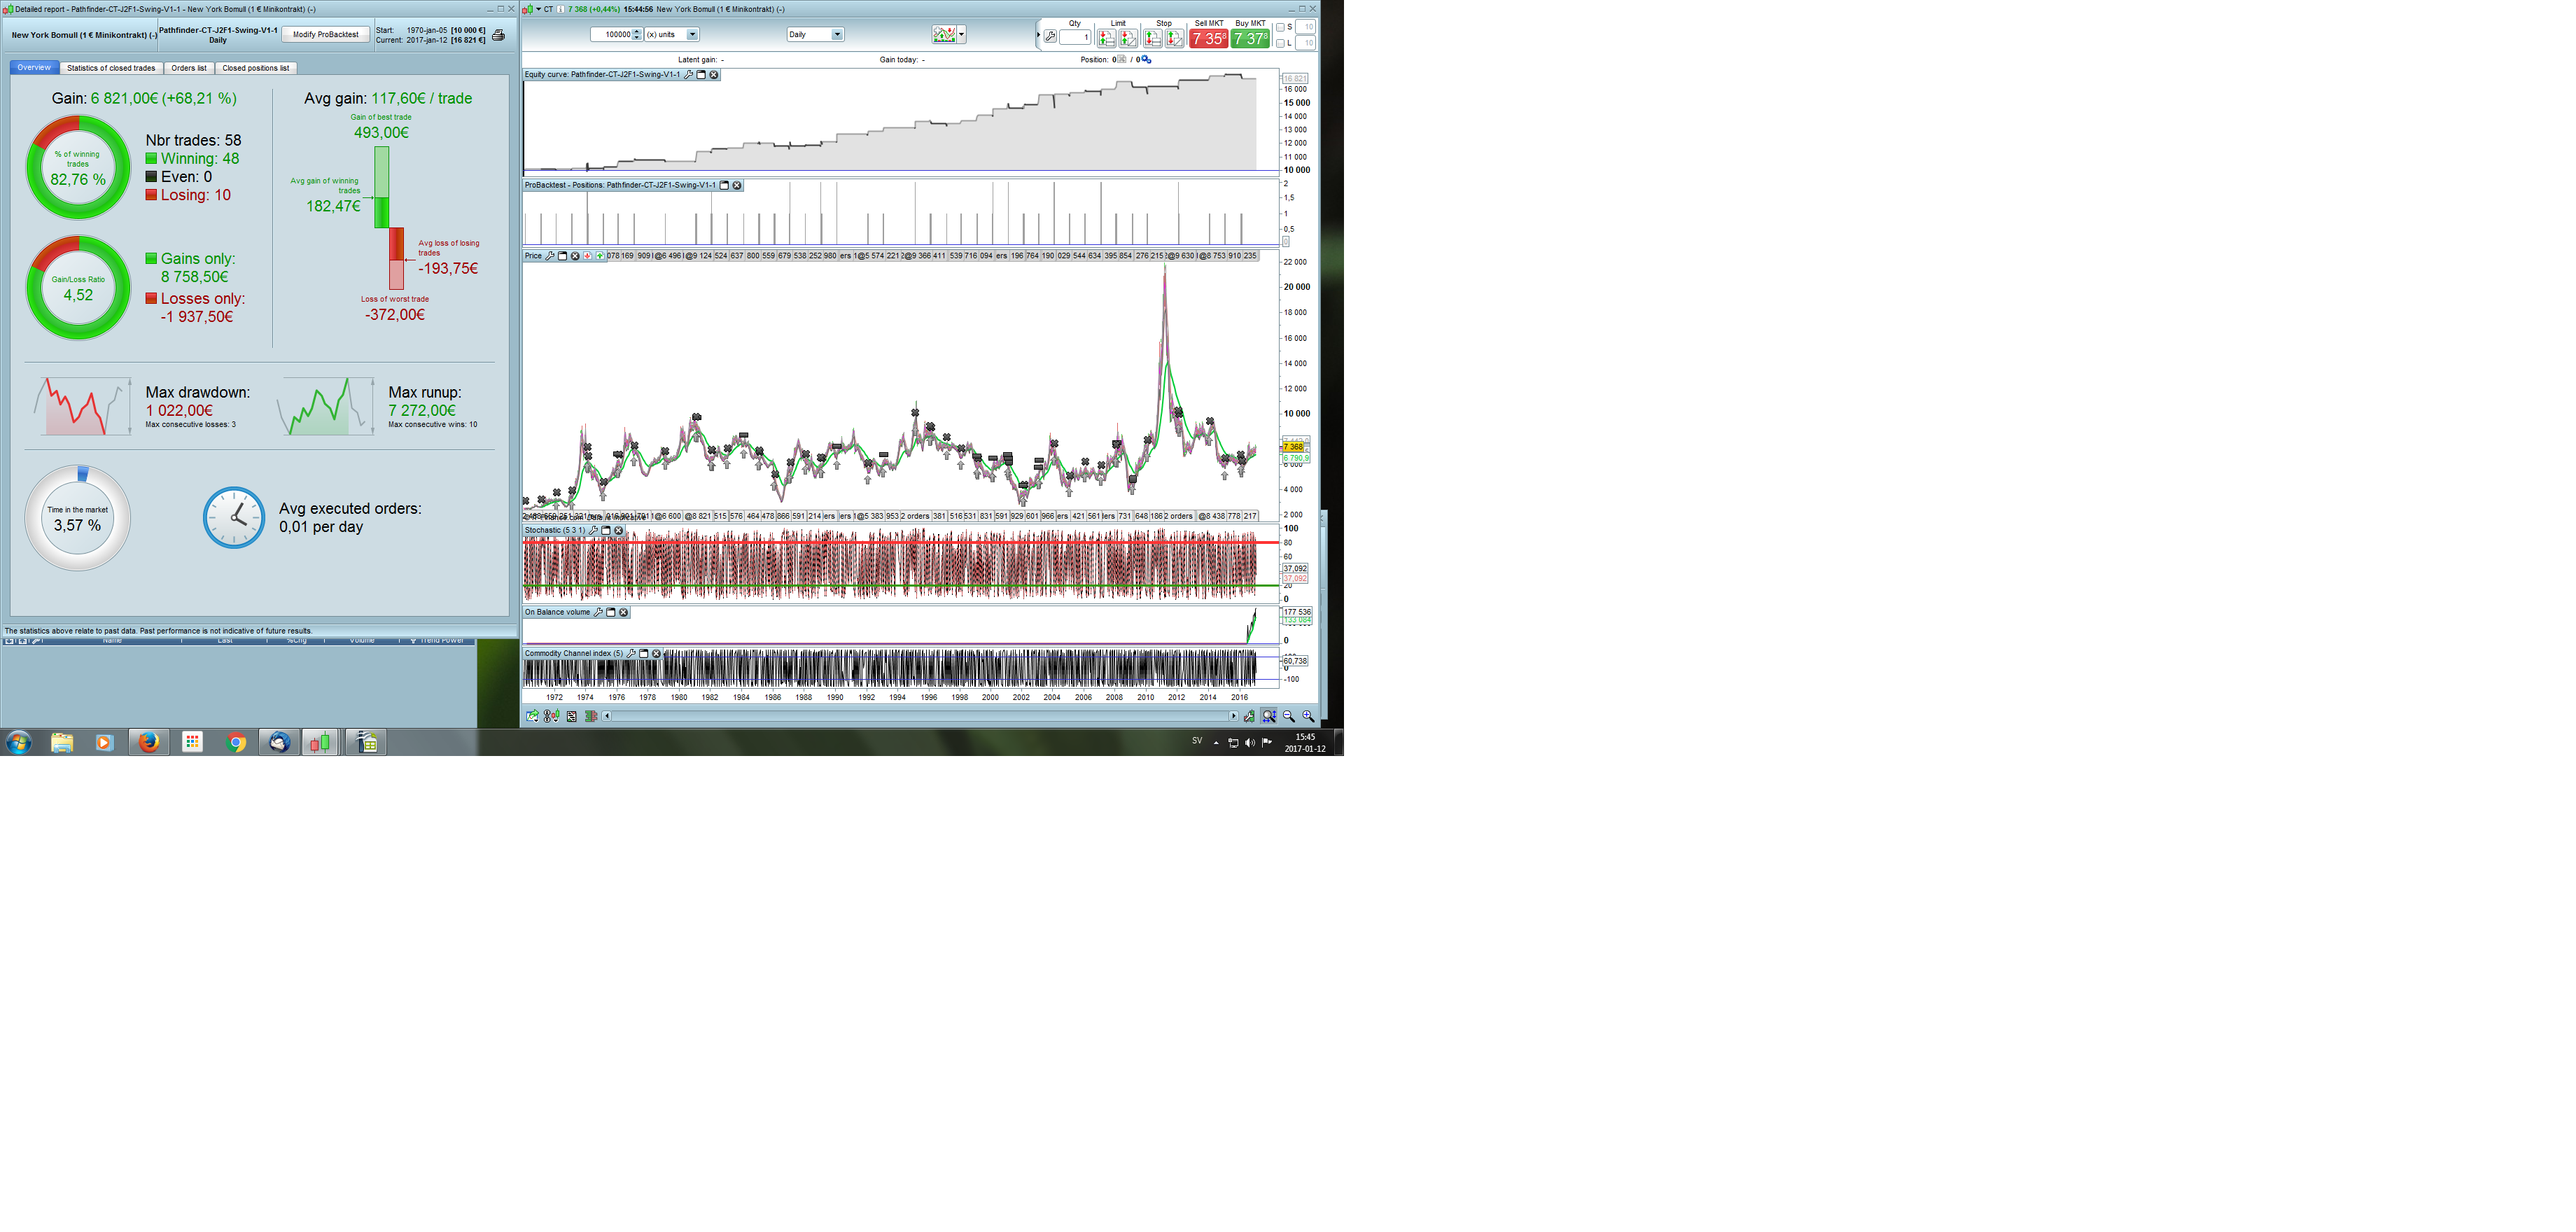
Cotton/CT for J2F1. Hope I’ve got it right:)
/Martin
Hello,
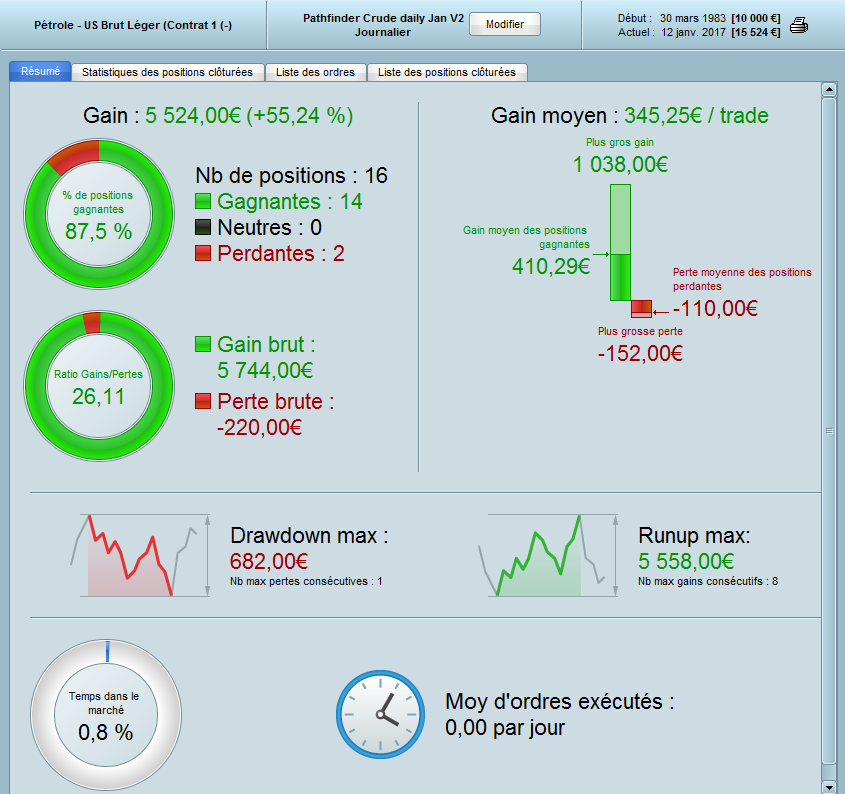
Here is the crude, for january2. Backtest from 1983, and a correct DD
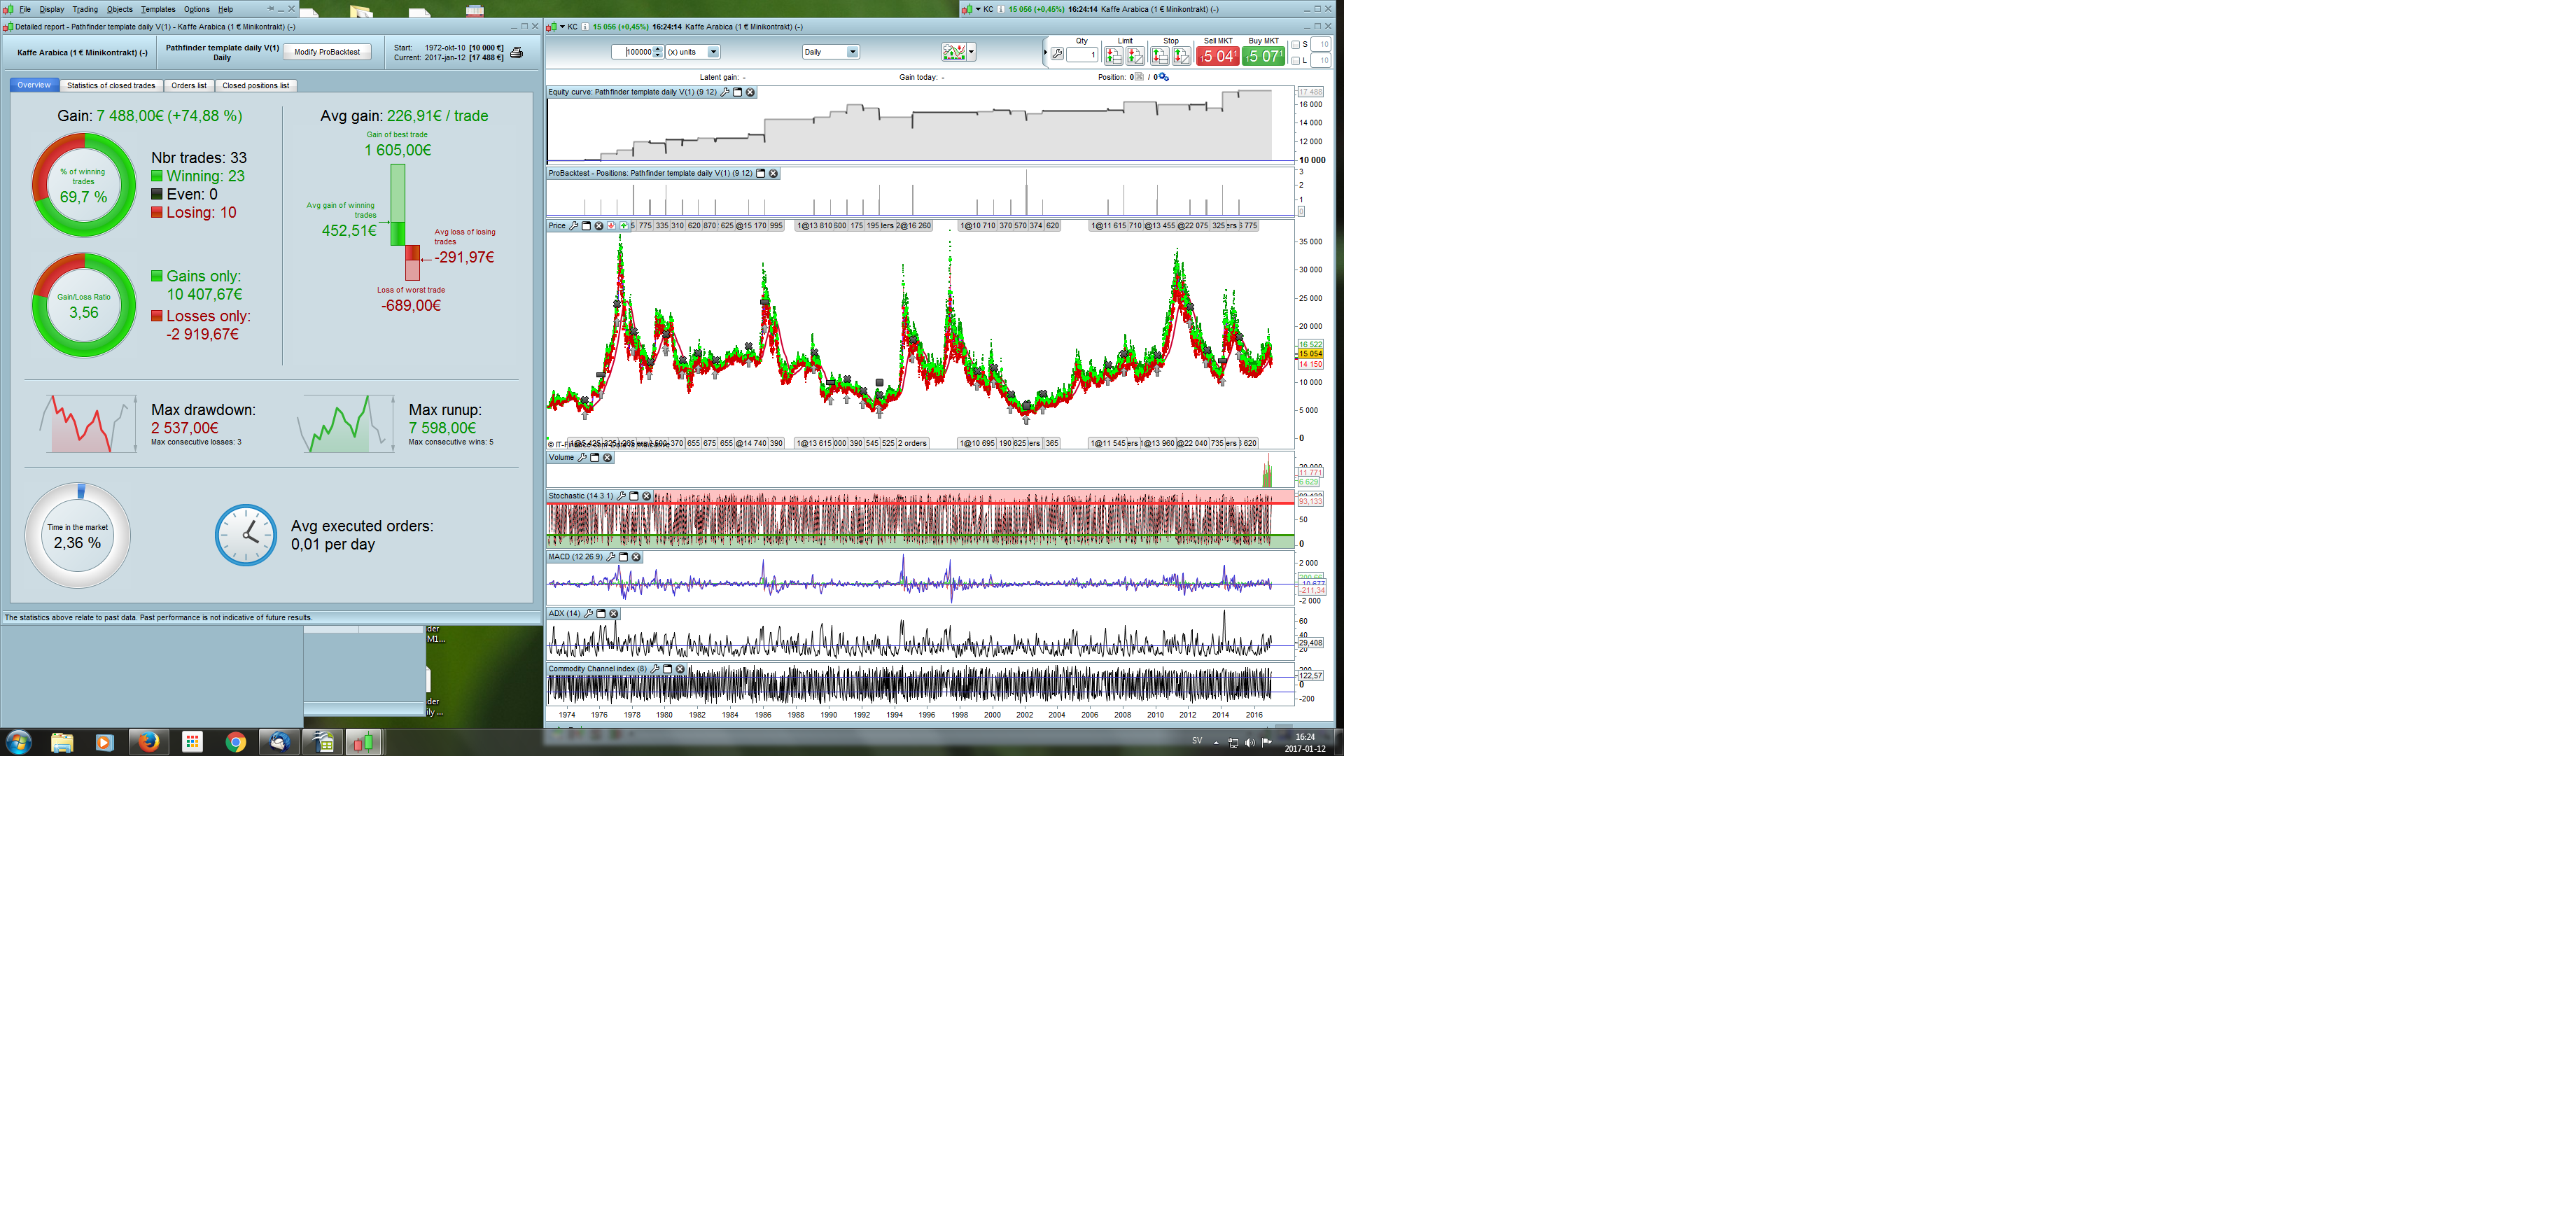
And here is Coffee/KC for Jan2. It’s red on the roadmap for this period.
/Martin
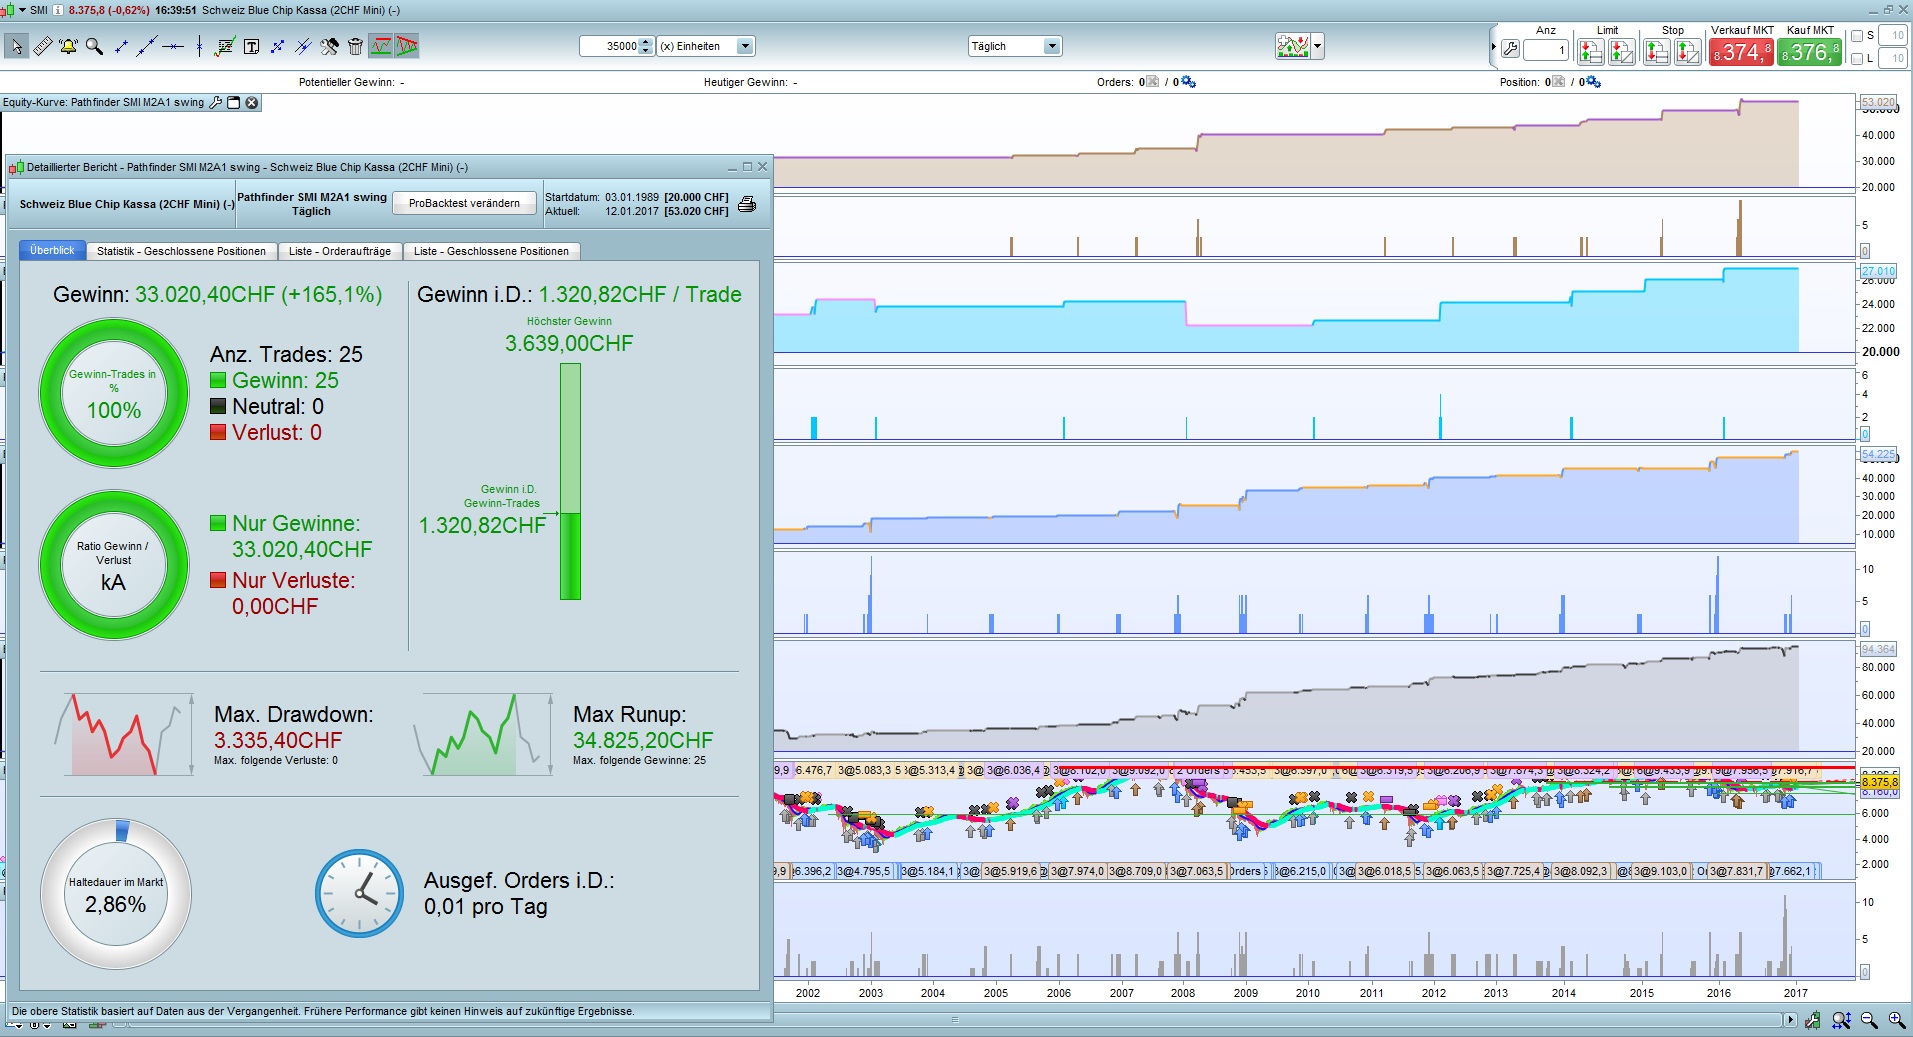
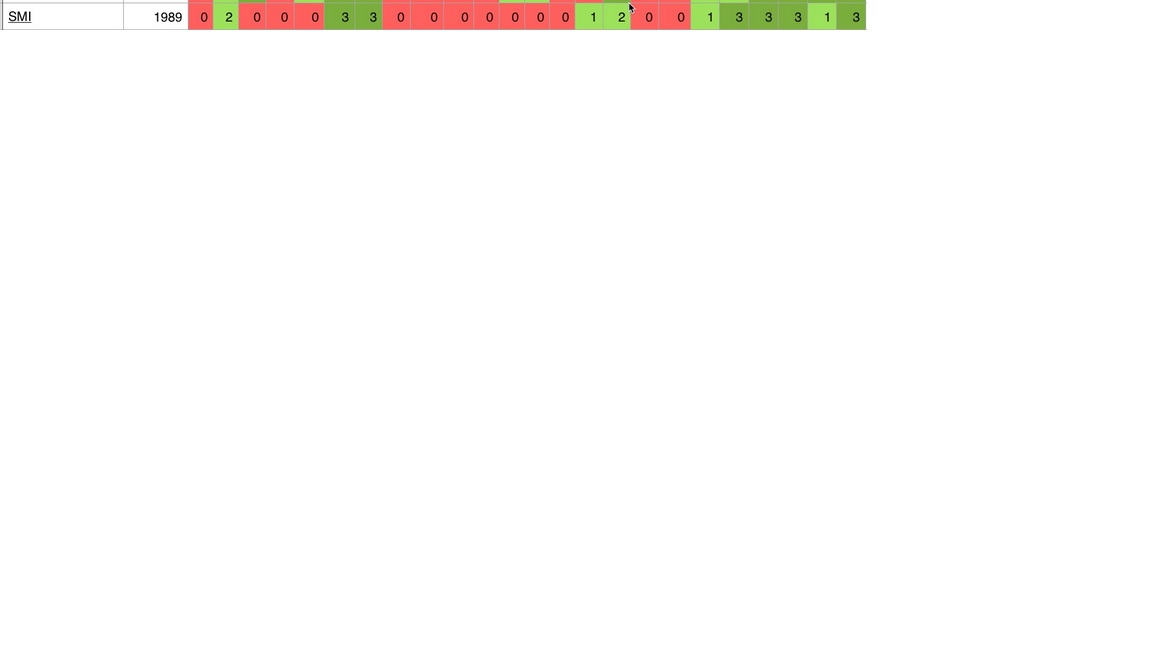
In the attachement SMI M2A1 (March2 – April 1) 1989 – 2017. Without a loss trade just 100% Gain :-). Do not forget the smallest unit to play with the SMi are 2 CHF per point.
Prost
Michi
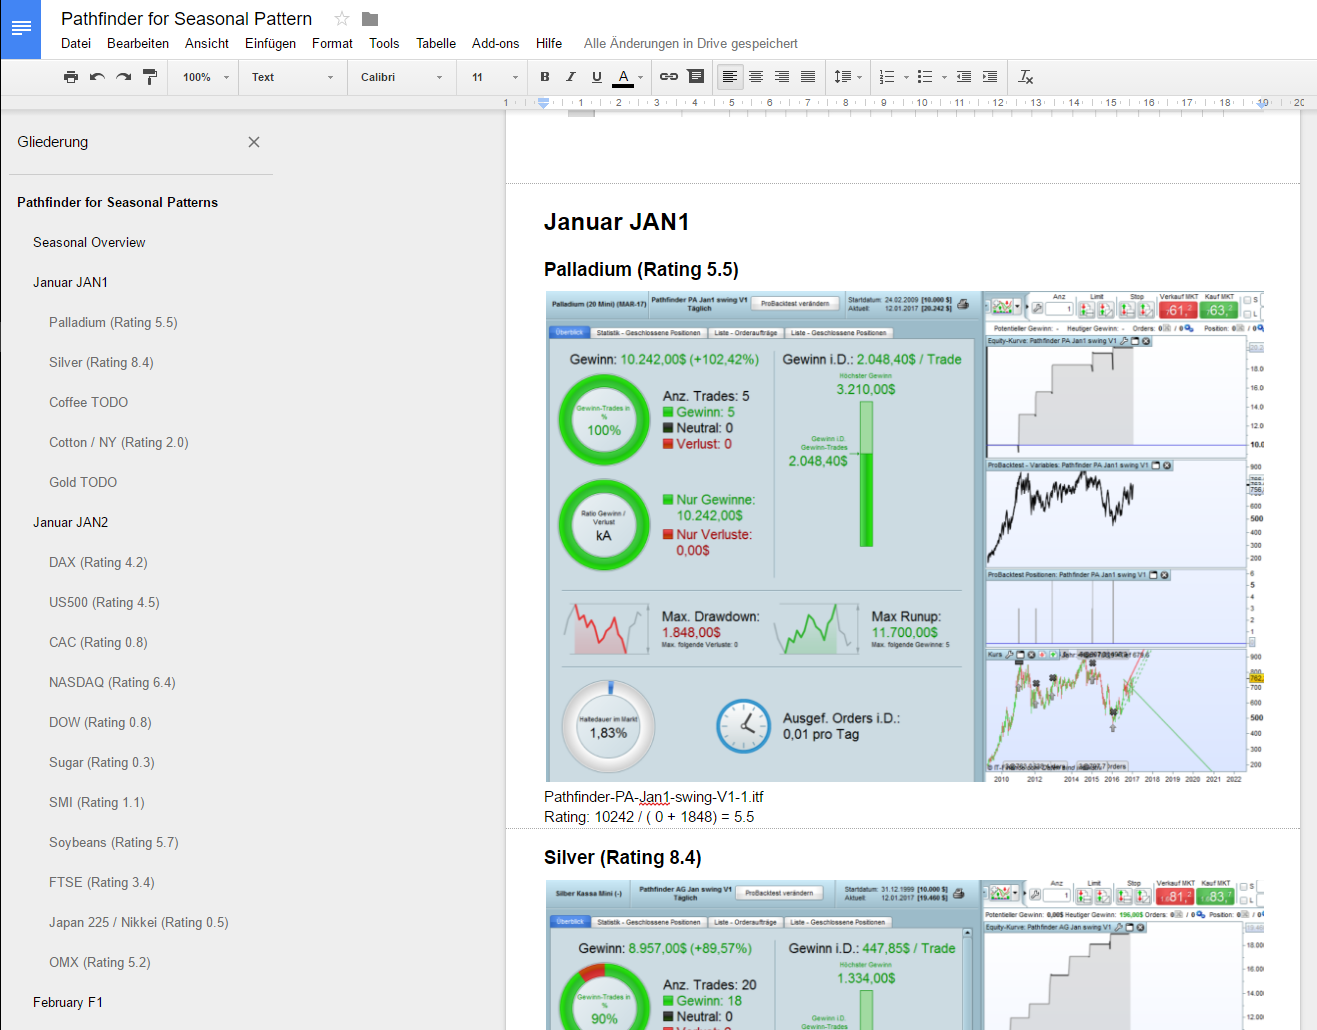
As promised, I have collected all the approved programs in an online document, created detailed reports (with data from 2000) and did a quick rating.
If you think, that sth is wrong, just put a comment in the document.
Check it out:
https://docs.google.com/document/d/1AumB7oFoQy4aJYoYuyLXDKfLCBrQLDzmOpf79ILD7pw
(Dont forget to add a Navigation Bar with “Tools -> Document Structure”.)
All programs in a zip file:
https://drive.google.com/open?id=0B8sYYnIsbVYZWHpZQ1ZGaHVQU28
I hope this makes our work more manageable.
 Alco
AlcoParticipant
Senior
Great work Pfeiler! thanks 🙂
Hi
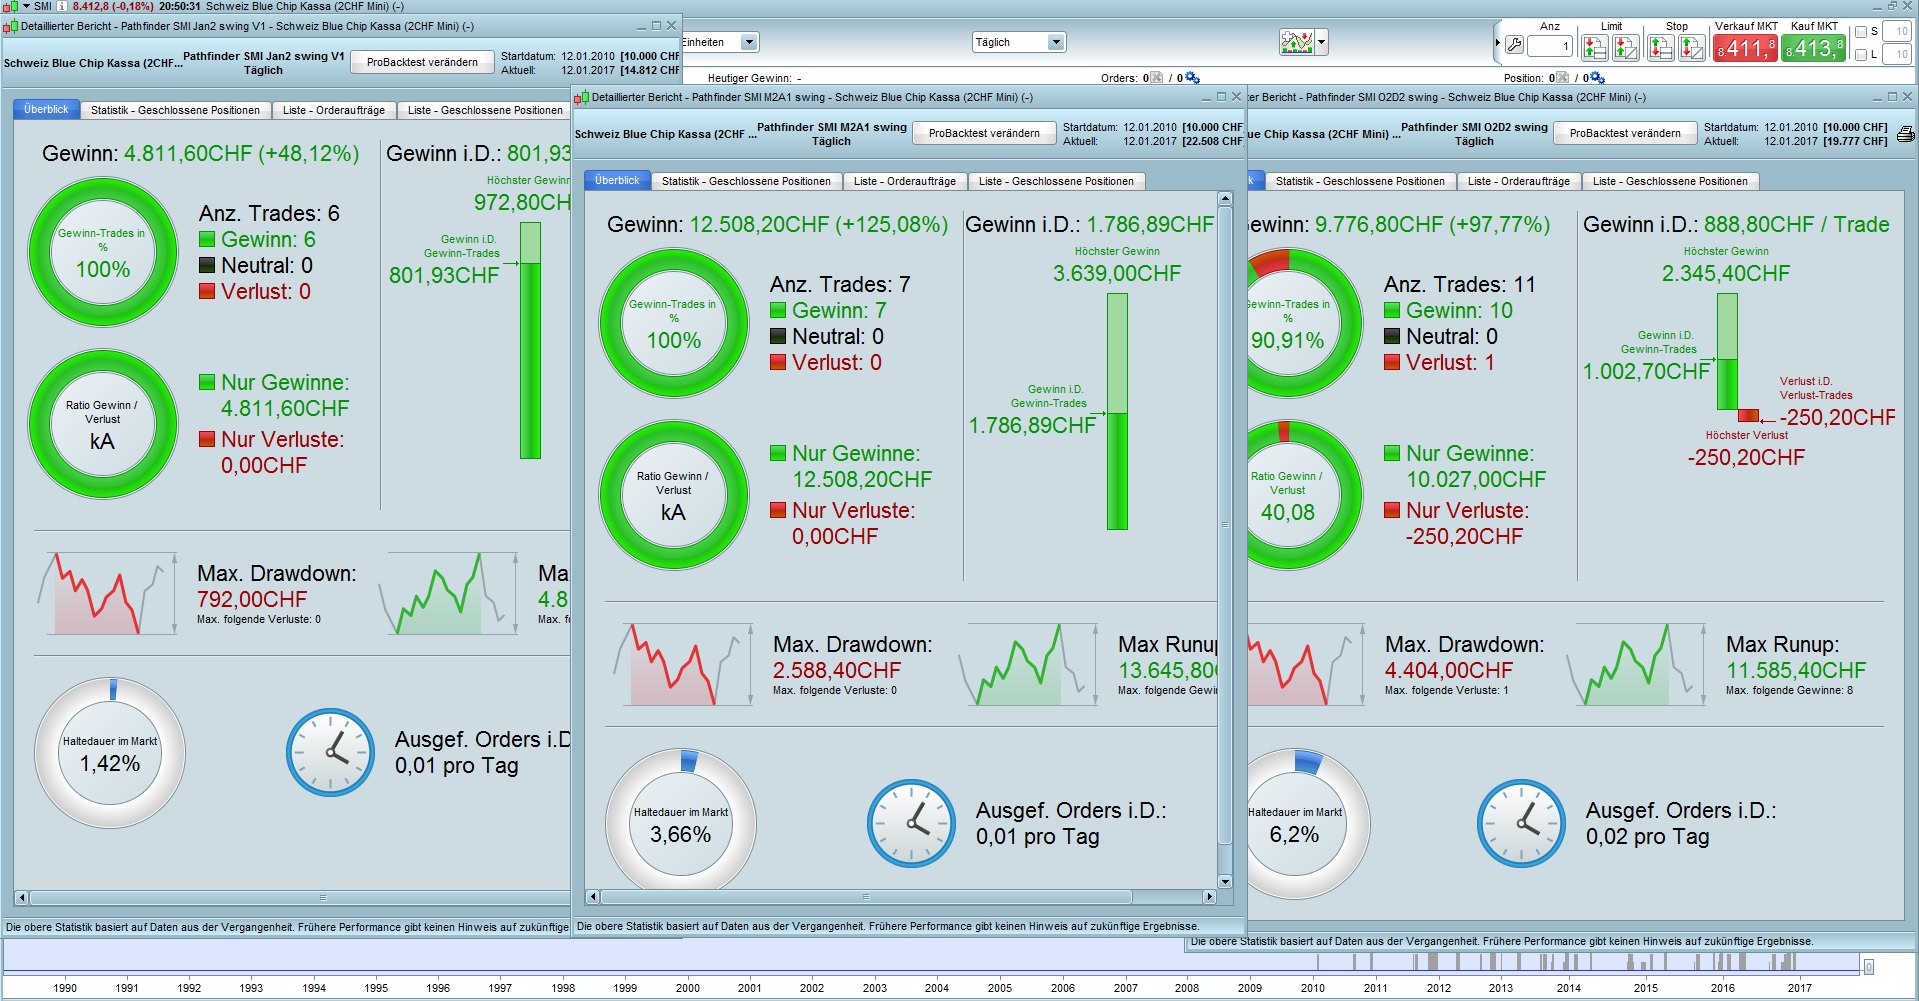
The SMI is finished except that Reiner can still improve it. I have set the deposit value to 10’000 CHF instead of to 20’000 CHF. Bu don’t forget the the SMI makes 2 .- CHF per point. On the first picture you can see the b.test of the last 7 years. In the attachment there is the last SMI Version from October to December O2-D2.
 Mark
MarkParticipant
Senior
@Pfeiler
HG Copper is done and can be added, its at the top of page 11
MarkParticipant
Senior
Ignore that, just seen it
Hi Reiner,
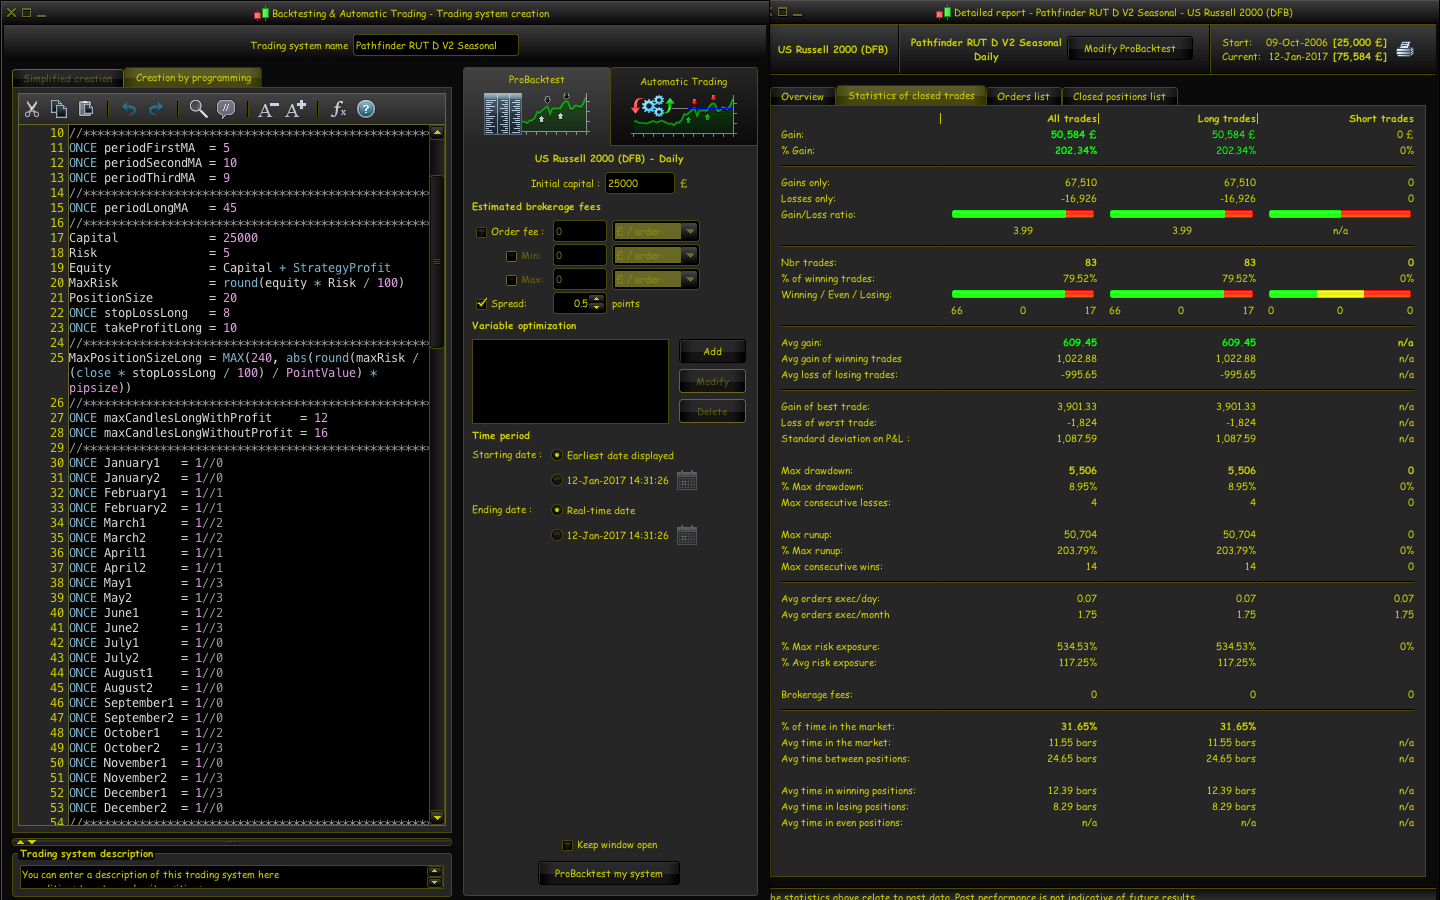
I noticed that you hadn’t considered the RUT (Russell 2000) for the portfolio so decided to add it as another option. As it’s not included in the Swing Roadmap, I created the roadmap values and ran subsequent backtests based on that data. I enclose below pictures of my spreadsheets (I don’t use excel, I use OpenOffice, so unsure if you can open the actual spreadsheets).
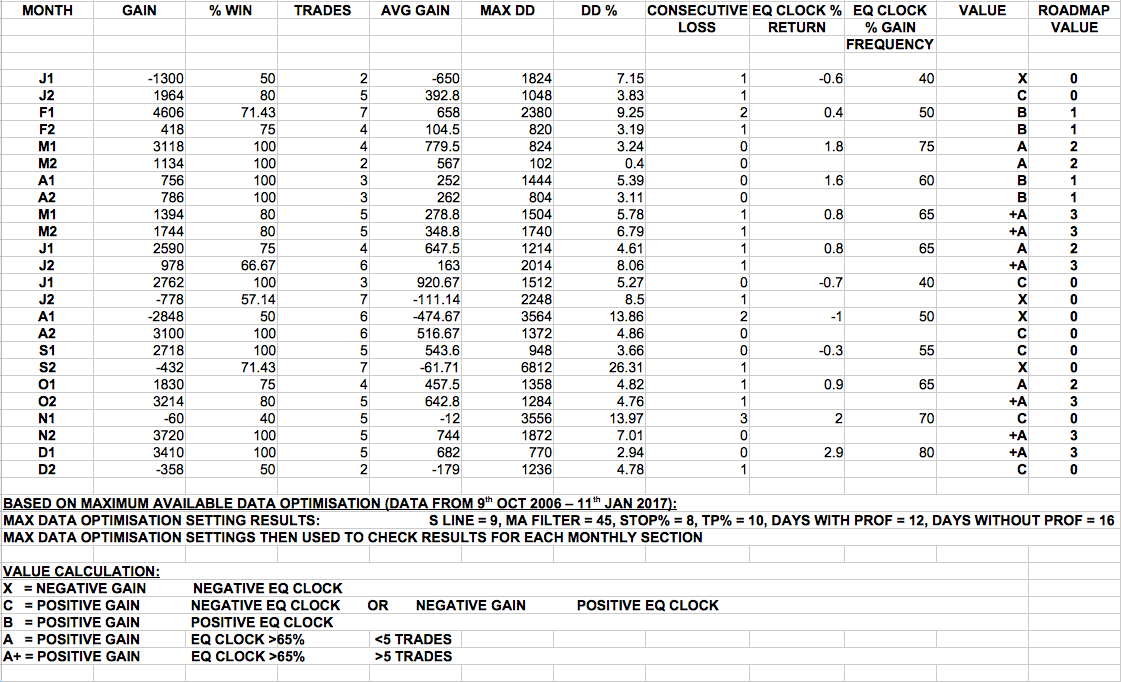
To create the spreadsheets, I initially ran a full backtest optimisation on the data available from IG (with a multiplier of 1 for each monthly section). I then used this optimisation to go through each monthly section and check viability using the same settings. I then documented this information and used the equity clock seasonality to help me create a value.
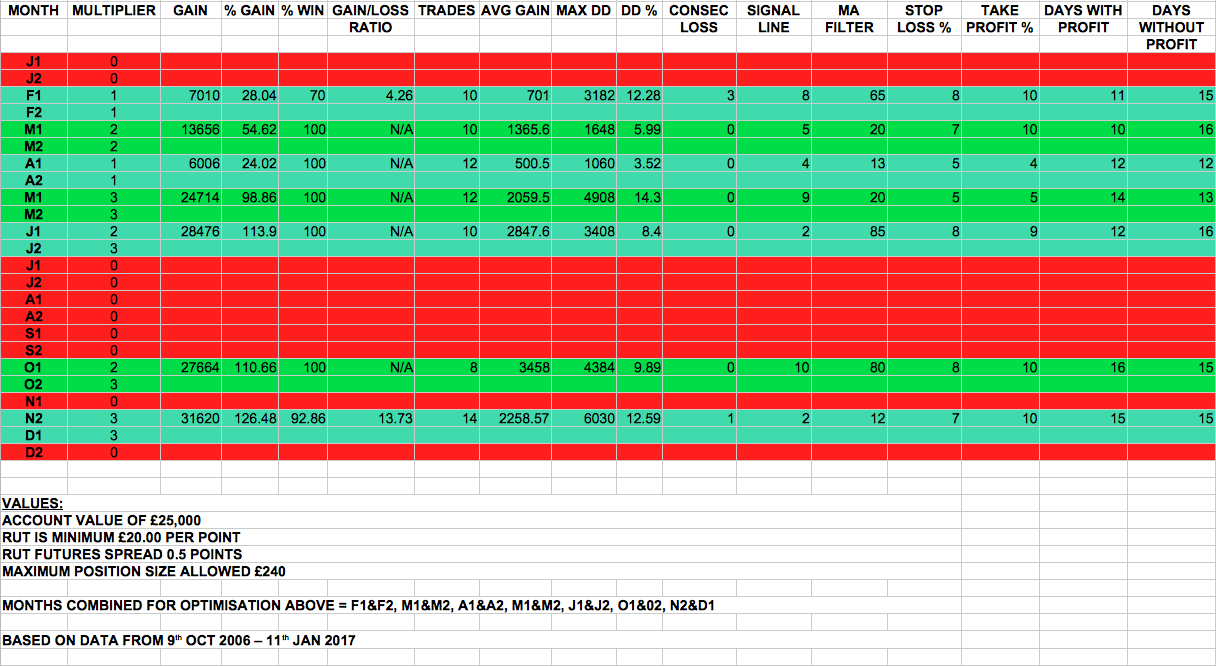
Once I created the multiplication values for the roadmap, I optimised each qualifying monthly section and recorded the data. The RUT futures have a 0.5 point spread and minimum size of £20 per point on IG. I produced a control where I multiplied every monthly section using 3 to give me profit of £148,818.00. When using the month by month optimisations for qualifying months, the profit results are £139,146.00 with extremely high % win and low % draw down.
When looking at these results, one could say that they look fitted, but virtually all Pathfinder optimisations are very profitable for the RUT. Please see the attached documents for the detailed results.
I didn’t want to detract from the current portfolio optimisations in the forum, but thought it may be useful to discuss how to create roadmap values so we can standardise a procedure as we add to, adjust and balance the portfolio.
I will add the ITF files for 2017 to the next post.
Thank you for your hard work and the time you dedicate to this forum.
Best regards,
Robin.