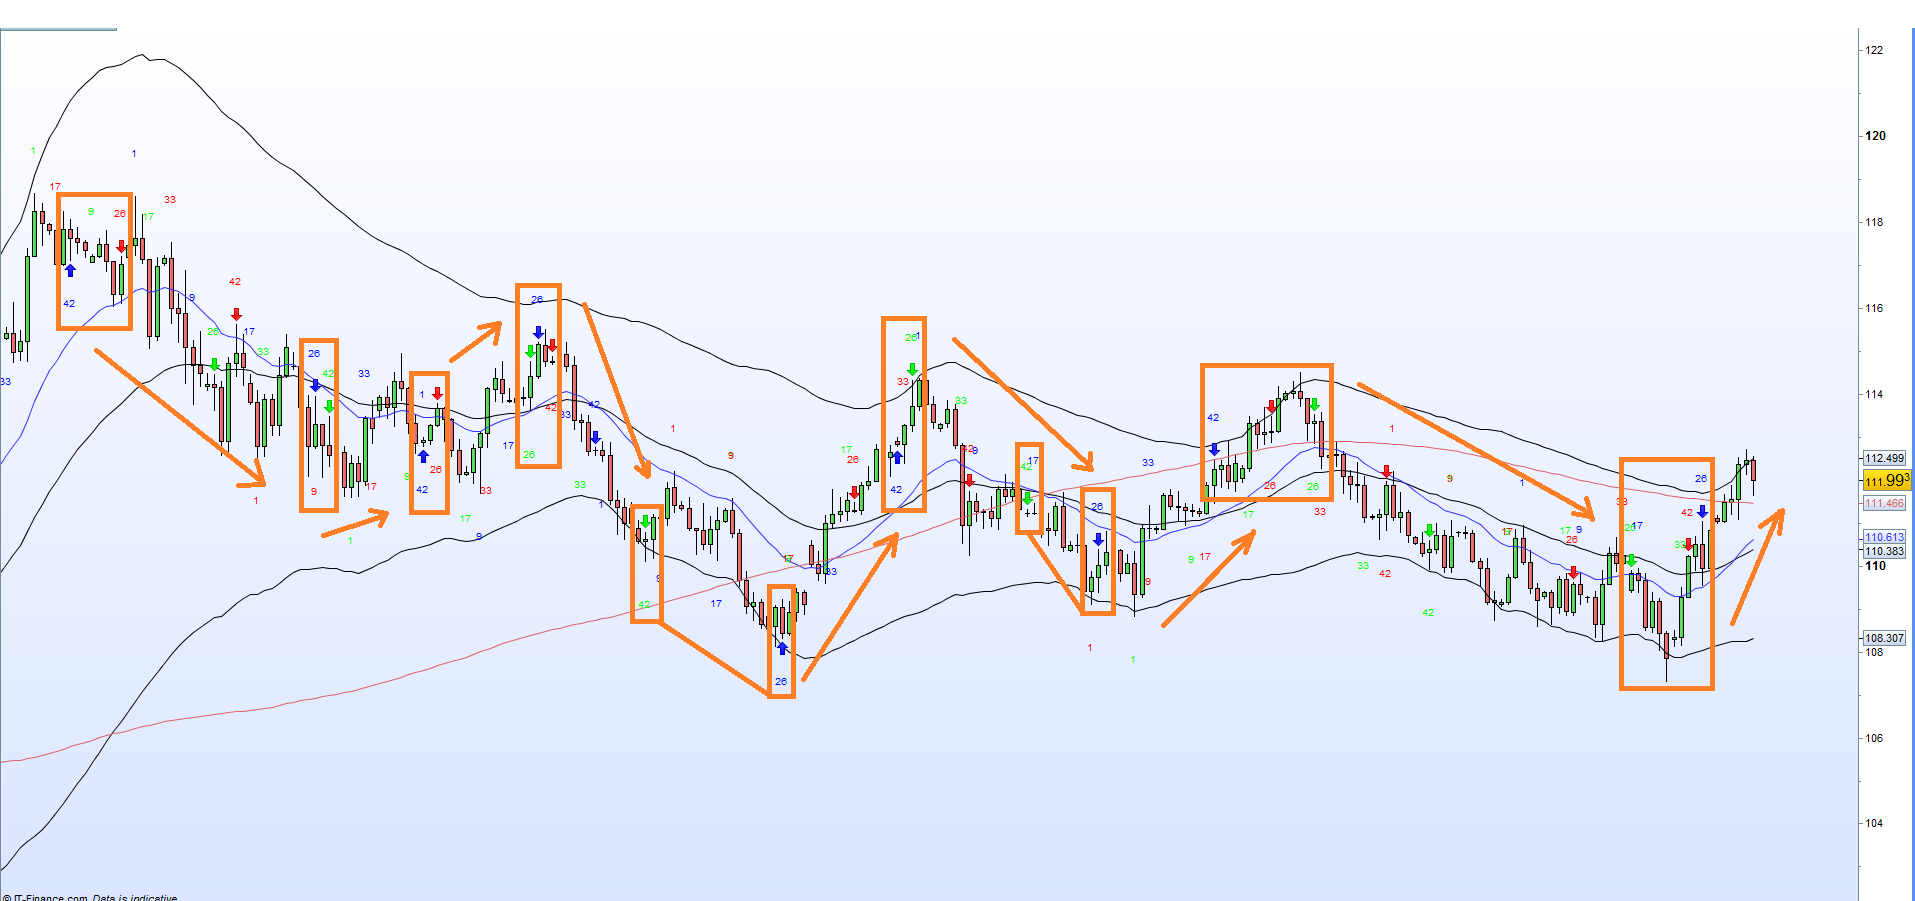
Hi Despair, I have spent some time studying some charts and their behavior relative to the numbers and the one thing that stood out was that each time a 42 was followed up by 26 (or vice versa) in close proximity and more specifically when either the 42 or 26 was a blue number, a new trend direction was soon to follow. Attached latest examples from the USDJPY Daily.
I updated the indicator to highlight the number 26 and 42 with an arrow. I have also made some adjustments to increase the accuracy of the drawing coordinates as their hight did not take into account the -4 offset.
Lastly I introduced a variable called x to scale the pipsize used as reference for the numbers relative vertical positioning between different timeframes.
.ITF and screenshot attached.
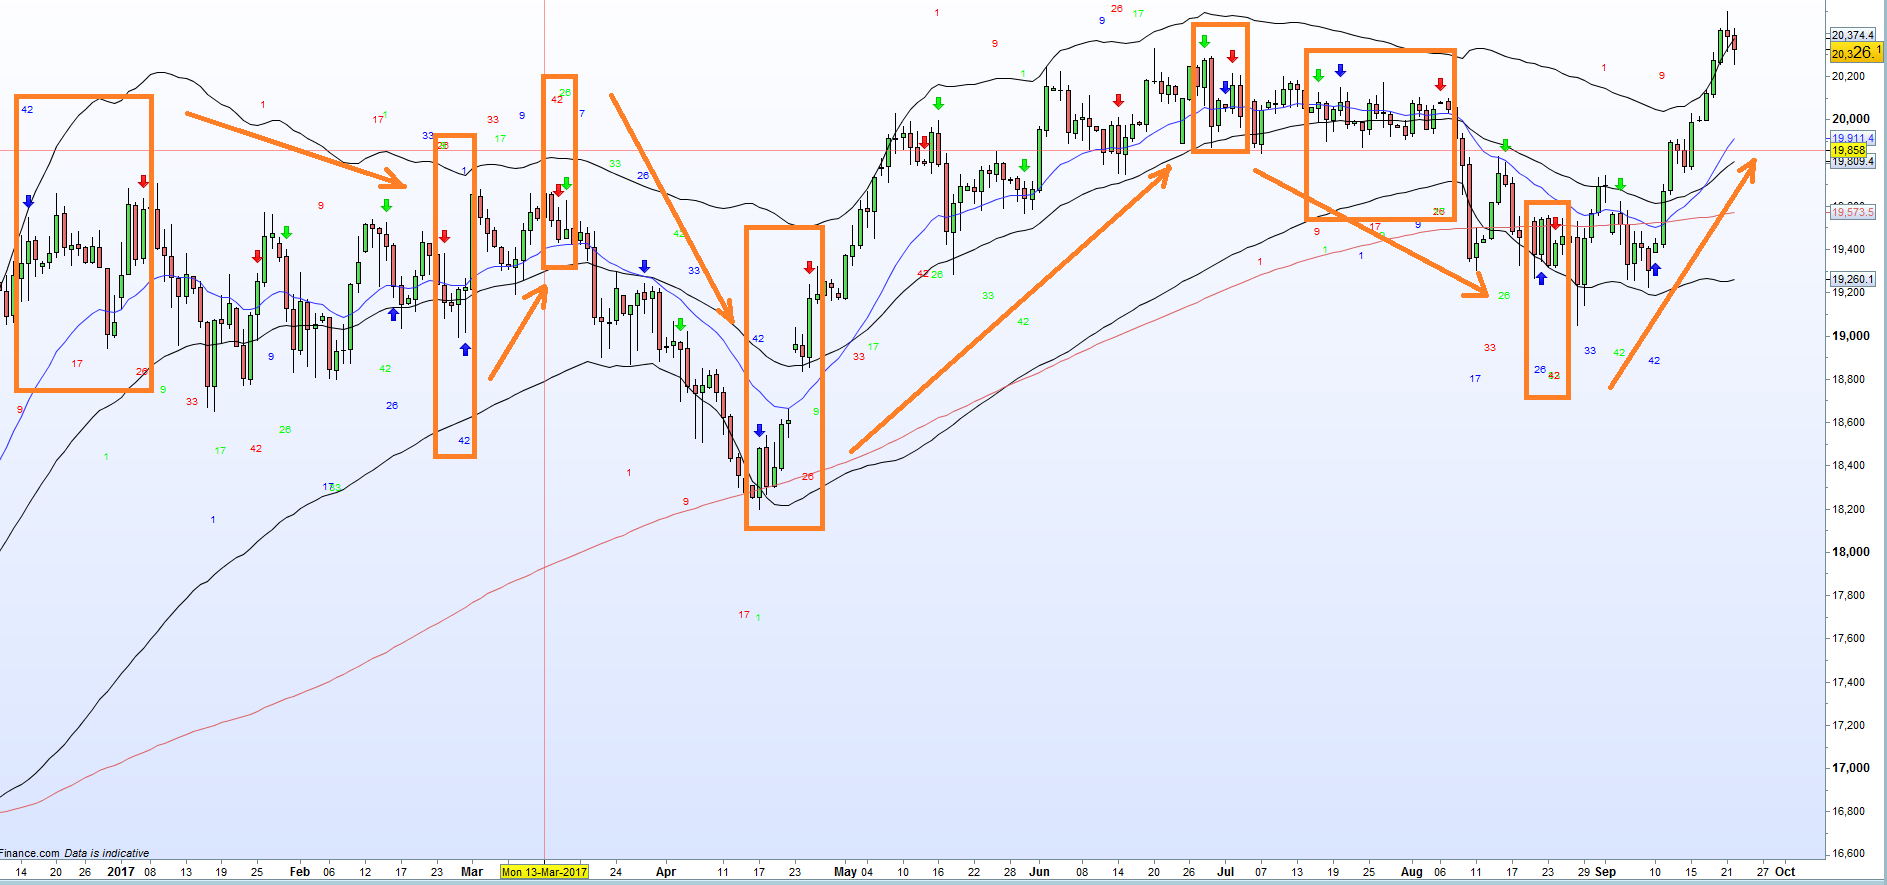
Okay so I think it is safe to say that a 26 and 42 close to each other (with one being blue), definitely beats statistical randomness when it comes to preceding a new swing. Here is just one more form the latest Nikkei Daily chart.
Interesting observation. Did you try testing this find with a strategy?
No, not yet, but will try to create something in the near future.
I have continued to play around with the concept, even expanding the range of Ichimoku Numbers up to the max Ichimoku number of 257 (i.e. 9,17,26,33,42,65,76,129,172,257).
Attached is the .ITF with the additional numbers (All I am going to say is watch that Blue 257 – Scary Stuff!)
Your indicator doesn’t draw any numbers for me at all, just arrows.
Edit: Now I saw you put the numbers so far away that they were off the screen for me. 🙂
The x variable needs to be adjusted between Shares, FX and Indices as well as Timeframes to display properly. Simple High/Low +- (10*pipsize) doesn’t work.
Sure, I didn’t test it on so many different assets.
The attached version includes some fixes as well as variables to quickly adjust the qualifying fractal shoulder size as well as the distance of the numbers above/below the candles.
Hi guys, got a pending post for the library about this indicator, what is the good version please? 🙂
Seems very interesting, good job!
Hey Nicolas,
Juan has here some modifications on the indicator. I think there is little to tidy up. I will do so and upload a version for the library. Sorry for the double post but the indicator changed a lot after I thought it was finished. 🙂
@Juanj: Please have a look at the attached version of the indicator. You had there some error in the calculation of the offset of the numbers/arrows. I changed that and made it that it should adapt to a good distance in every TF automatically.
But you made quite some more changes and I didn’t work through all those. You added arrows to some numbers but there are still numbers without arrows. Is this supposed to be like this? I’m just asking because I want to finish a version for the library.
Hi Despair, thanks for working with me here towards an excellent library ready indicator.
I again built onto your latest indicator to add the ATR distance as an adjustable parameter.and changed the arrows to only highlight numbers 172 and 257.
I also changed the arrows to only highlight numbers 172 and 257 as I found them to be most significant in preceding a major market move.
I also found that using a Fractal Shoulder of 14 bars yielded the most accurate results.
Because the latest version utilizes the complete Ichimoku number set up to 257 as opposed to 42, the significance of the 26/42 is no longer applicable but rather the presence of a 172 and 257.
For those ‘John Nash – A Beautifull Mind’ types who might naturally see patterns in numbers, please let us know if you find something interesting.
@Nicolas @Despair you can go ahead with posting the above in the library.
Used in conjunction with the Ichimoku Cloud and Ichimoku Wave Analysis the above indicator can be used to confirm the end of a cycle. Significant points of interest are the numbers 172 and 257 as they usually precede a major market turn. The numbers are simply calculated as the number of bars from a previous swing high/low. The swing point can be adjusted based on the shoulder length (Default = 14)
i.e. ShoulderSize of 14 means there are 14 preceding lower highs and 14 succeeding lower highs for a swing high or 14 higher lows preceding and 14 succeeding higher lows for a swing low.
 AVT
AVTParticipant
Senior
Great, I have been following this and now I can read the source code (and transscribe it to MT4 to see whether my idea is correct) .