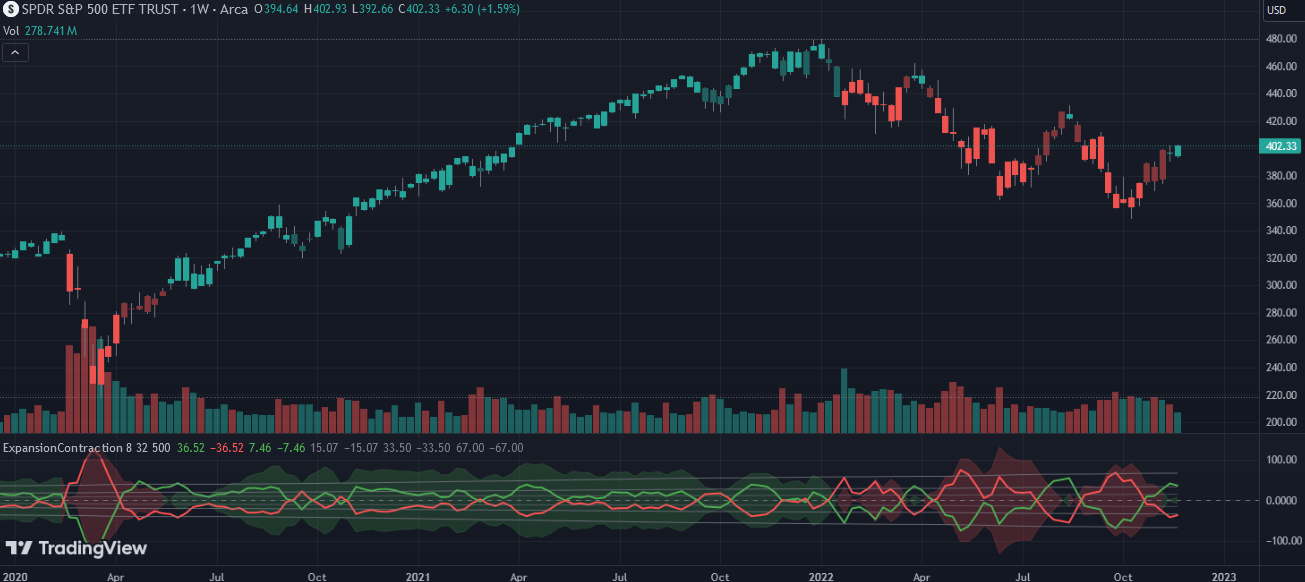
Expansion Contraction compares 2 price points (the high and the low), up or down through the 2 moving average channel (MAC) settings. Since Expansion Contraction measures every period (chart setting), it technically has “zero lag”. A second indicator compares 2 price points (the high and the low), up or down through 2 longer look-back moving average channel settings… Note: Ideally, this ratio usually produces a condition where a 2 standard deviation short term move (strong swing) equals approximately a 1 standard deviation long term move (trend strengthening).
Basically, if both the short term swing is expanding higher and the long term trend is expanding higher, then that signals the strongest part of the current swing higher (dark green bars). The strongest part of the current swing lower (dark red bars), occurs when both the short term swing is expanding lower and the long term trend is expanding lower.
Light green bars occur when the short term swing is expanding lower however; the long term trend is still bullish. Light red bars occur when the short term swing is higher however; the long term trend is still bearish. These indicate weakness in the current swing and Jake’s trailing stop rules should be considered.
When both the short term swing and the long term trend are within 1 standard deviation based on the short term swing, the resulting narrow range indicates a “not trending” or range bound condition.
When the short term swings are at or beyond +2 standard deviations, this setup is a leading indicator of the trend direction most of the time (not how long the trend will last). When the long term trend, up or down exceeds a 2 standard deviation move higher, the condition is considered over-bought or over-sold, respectively. Trade Navigator programming appears as a colored triangle (red/green). Use trailing stop rules.
Indicator created by Brian Latta based on Jake Bernstein’s principles of Moving Average Channel system.
Brian Latta – Author of “The Book on Trading”, trading system developer and coach
Jake Bernstein – Speaker at Wealth365®
//+------------------------------------------------------------------+
//|                                         ExpansionContraction.mq5 |
//|                         Copyright 2022, Trade Foreign Currencies |
//|                              https://tradeforeigncurrencies.com/ |
//+------------------------------------------------------------------+
#property copyright "Copyright 2022, Trade Foreign Currencies"
#property link      "https://tradeforeigncurrencies.com/"
#property version   "1.00"
#include <MovingAverages.mqh>
#property indicator_separate_window
#property indicator_buffers 12
#property indicator_plots   11
//--- plot PositiveShort
#property indicator_label1  "PositiveShort"
#property indicator_type1   DRAW_LINE
#property indicator_color1  clrLime
#property indicator_style1  STYLE_SOLID
#property indicator_width1  2
//--- plot NegativeShort
#property indicator_label2  "NegativeShort"
#property indicator_type2   DRAW_LINE
#property indicator_color2  clrRed
#property indicator_style2  STYLE_SOLID
#property indicator_width2  2
//--- plot PositiveLong
#property indicator_label3  "PositiveLong"
#property indicator_type3   DRAW_LINE //DRAW_FILLING
#property indicator_color3  clrPaleGreen,clrLightSalmon
#property indicator_style3  STYLE_SOLID
#property indicator_width3  1
//--- plot NegativeLong
#property indicator_label4  "NegativeLong"
#property indicator_type4   DRAW_LINE //DRAW_FILLING
#property indicator_color4  clrLightSalmon,clrPaleGreen
#property indicator_style4  STYLE_SOLID
#property indicator_width4  1
//--- plot UpperShort
#property indicator_label5  "UpperShort"
#property indicator_type5   DRAW_LINE
#property indicator_color5  clrDarkGray
#property indicator_style5  STYLE_SOLID
#property indicator_width5  1
//--- plot LowerShort
#property indicator_label6  "LowerShort"
#property indicator_type6   DRAW_LINE
#property indicator_color6  clrDarkGray
#property indicator_style6  STYLE_SOLID
#property indicator_width6  1
//--- plot UpperLong
#property indicator_label7  "UpperLong"
#property indicator_type7   DRAW_LINE
#property indicator_color7  clrDarkGray
#property indicator_style7  STYLE_SOLID
#property indicator_width7  1
//--- plot LowerLong
#property indicator_label8  "LowerLong"
#property indicator_type8   DRAW_LINE
#property indicator_color8  clrDarkGray
#property indicator_style8  STYLE_SOLID
#property indicator_width8  1
//--- plot UpperLong2
#property indicator_label9  "UpperLong2"
#property indicator_type9   DRAW_LINE
#property indicator_color9  clrDarkGray
#property indicator_style9  STYLE_SOLID
#property indicator_width9  1
//--- plot LowerLong2
#property indicator_label10  "LowerLong2"
#property indicator_type10   DRAW_LINE
#property indicator_color10  clrDarkGray
#property indicator_style10  STYLE_SOLID
#property indicator_width10  1
//--- plot ZeroLine
#property indicator_label11  "ZeroLine"
#property indicator_type11   DRAW_LINE
#property indicator_color11  clrDarkGray
#property indicator_style11  STYLE_DASH
#property indicator_width11  1
//--- paint Bars
#property indicator_label12  "BarColor"
#property indicator_type12   DRAW_COLOR_CANDLES
#property indicator_color12  clrPaleGreen,clrLightSalmon,clrLime,clrRed
//--- input parameters
input int      shortLookback=8;
input int      longLookback=32;
input int      stdevLookback=500;
//--- indicator buffers
double         PositiveShortBuffer[];
double         NegativeShortBuffer[];
double         PositiveLongBuffer[];
double         NegativeLongBuffer[];
double         UpperShortBuffer[];
double         LowerShortBuffer[];
double         UpperLongBuffer[];
double         LowerLongBuffer[];
double         UpperLong2Buffer[];
double         LowerLong2Buffer[];
double         ZeroLineBuffer[];
double         BarColorBuffer[];

double maxShort[];
double maxLong[];
//+------------------------------------------------------------------+
//| Custom indicator initialization function                         |
//+------------------------------------------------------------------+
int OnInit()
  {
//--- indicator buffers mapping
   SetIndexBuffer(0,PositiveShortBuffer,INDICATOR_DATA);
   SetIndexBuffer(1,NegativeShortBuffer,INDICATOR_DATA);
   SetIndexBuffer(2,PositiveLongBuffer,INDICATOR_DATA);
   SetIndexBuffer(3,NegativeLongBuffer,INDICATOR_DATA);
   SetIndexBuffer(4,UpperShortBuffer,INDICATOR_DATA);
   SetIndexBuffer(5,LowerShortBuffer,INDICATOR_DATA);
   SetIndexBuffer(6,UpperLongBuffer,INDICATOR_DATA);
   SetIndexBuffer(7,LowerLongBuffer,INDICATOR_DATA);
   SetIndexBuffer(8,UpperLong2Buffer,INDICATOR_DATA);
   SetIndexBuffer(9,LowerLong2Buffer,INDICATOR_DATA);
   SetIndexBuffer(10,ZeroLineBuffer,INDICATOR_DATA);
   SetIndexBuffer(11,BarColorBuffer,INDICATOR_DATA);
//--- name for indicator subwindow label
   IndicatorSetString(INDICATOR_SHORTNAME,StringFormat("XC(%d,%d,%d)",shortLookback,longLookback,stdevLookback));

//---
   return(INIT_SUCCEEDED);
  }
//+------------------------------------------------------------------+
//| Custom indicator iteration function                              |
//+------------------------------------------------------------------+
int OnCalculate(const int rates_total,
                const int prev_calculated,
                const datetime &time[],
                const double &open[],
                const double &high[],
                const double &low[],
                const double &close[],
                const long &tick_volume[],
                const long &volume[],
                const int &spread[])
  {
//---
   if(rates_total<longLookback){
      return(0);
   }

   int limit = prev_calculated - 1;
   if (prev_calculated == 0) {
      limit = 0;
   }

   int bullColor = clrPaleGreen;
   int bearColor = clrLightSalmon;

   for (int i = limit; i < rates_total; i++) {
      ArrayResize(maxShort,rates_total);
      ArrayResize(maxLong,rates_total);

      double avgHighShort = SimpleMA(i,shortLookback,high);
      double avgHighLong = SimpleMA(i,longLookback,high);
      double xcPositiveShort = (high[i] - avgHighShort) + (low[i] - avgHighShort);
      double xcPositiveLong = (high[i] - avgHighLong) + (low[i] - avgHighLong);

      double avgLowShort = SimpleMA(i,shortLookback,low);
      double avgLowLong = SimpleMA(i,longLookback,low);
      double xcNegativeShort = (avgLowShort - low[i]) + (avgLowShort - high[i]);
      double xcNegativeLong = (avgLowLong - low[i]) + (avgLowLong - high[i]);

      double mediumShort = (xcPositiveShort + xcNegativeShort) / 2;
      double mediumLong = (xcPositiveLong + xcNegativeLong) / 2;

      PositiveShortBuffer[i] = xcPositiveShort - mediumShort;
      PositiveLongBuffer[i] = xcPositiveLong - mediumLong;
      NegativeShortBuffer[i] = xcNegativeShort - mediumShort;
      NegativeLongBuffer[i] = xcNegativeLong - mediumLong;

      maxShort[i] = PositiveShortBuffer[i] > NegativeShortBuffer[i] ? PositiveShortBuffer[i] : NegativeShortBuffer[i];

      double avgShort = SimpleMA(i,stdevLookback,maxShort);
      double stdevShort = StdDevFunc(maxShort,avgShort,i,stdevLookback);

      maxLong[i] = PositiveLongBuffer[i] > NegativeLongBuffer[i] ? PositiveLongBuffer[i] : NegativeLongBuffer[i];
      double avgLong = SimpleMA(i,stdevLookback,maxLong);
      double stdevLong = StdDevFunc(maxLong,avgLong,i,stdevLookback);

      UpperShortBuffer[i] = avgShort + stdevShort;
      LowerShortBuffer[i] = -UpperShortBuffer[i];

      UpperLongBuffer[i] = avgLong + stdevLong;
      LowerLongBuffer[i] = -UpperLongBuffer[i];

      UpperLong2Buffer[i] = UpperLongBuffer[i] * 2;
      LowerLong2Buffer[i] = -UpperLong2Buffer[i];

      ZeroLineBuffer[i] = 0;

      int cloudColor = PositiveLongBuffer[i] > NegativeLongBuffer[i] ? bullColor : bearColor;
      //PlotIndexSetInteger(0,PLOT_LINE_COLOR,clrLime);
      //PlotIndexSetInteger(1,PLOT_LINE_COLOR,clrRed);
      //PlotIndexSetInteger(2,PLOT_LINE_COLOR,2,cloudColor);
      //PlotIndexSetInteger(2,PLOT_LINE_COLOR,3,cloudColor);
      //PlotIndexSetInteger(2,PLOT_LINE_COLOR,2,cloudColor);
      //PlotIndexSetInteger(2,PLOT_LINE_COLOR,3,cloudColor);

      // Paint Candlesticks
      bool weakBull = PositiveLongBuffer[i] > NegativeLongBuffer[i] && PositiveShortBuffer[i] < NegativeShortBuffer[i];
      bool weakBear = NegativeLongBuffer[i] > PositiveLongBuffer[i] && NegativeShortBuffer[i] < PositiveShortBuffer[i];
      bool strongBull = PositiveLongBuffer[i] > NegativeLongBuffer[i] && PositiveShortBuffer[i] > NegativeShortBuffer[i];
      bool strongBear = NegativeLongBuffer[i] > PositiveLongBuffer[i] && NegativeShortBuffer[i] > PositiveShortBuffer[i];

      if (weakBull) {
         BarColorBuffer[i] = 0.0;
      } else if (weakBear) {
         BarColorBuffer[i] = 1.0;
      } else if (strongBull) {
         BarColorBuffer[i] = 2.0;
      } else if (strongBear) {
         BarColorBuffer[i] = 3.0;
      }
   }
//--- return value of prev_calculated for next call
   return(rates_total);
  }
//+------------------------------------------------------------------+
//| Calculate Standard Deviation                                     |
//+------------------------------------------------------------------+
double StdDevFunc(const double &series[],const double &ma_series,const int position,const int stdevPeriod)
  {
   if (position < stdevPeriod) {
      return 0;
   }

   double dev=0.0;

   for (int i=0; i<stdevPeriod; i++) {
      dev+=MathPow(series[position-i]-ma_series,2.0);
   }

   dev=MathSqrt(dev/stdevPeriod);

   return(dev);
  }
//+------------------------------------------------------------------+