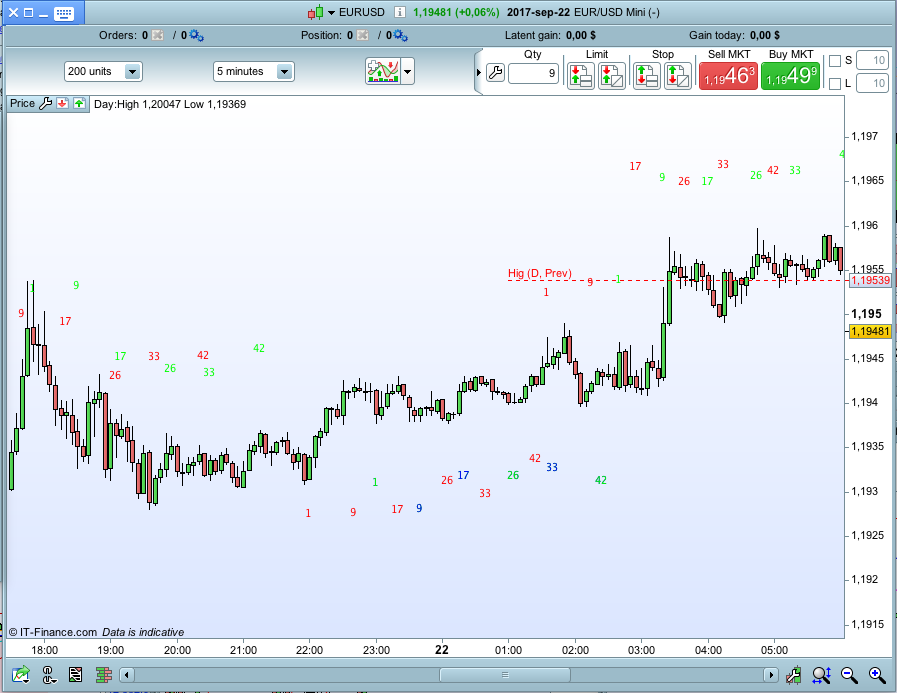
This indicator is based on Ichimoku number theory. It marks a SwingLow/SwingHigh defined by a special fractal-pattern and the following fractals of count 9, 17, 26, 33 and 42 which according to Ichimoku number theory are interesting levels where a reversal might take place.
The indicator marks additional 2 SwingHighs/SwingLows and there following fractals according number theory within the first 42 bars after the 1st SwingHigh/SwingLow.
42 bars after the initial SwingHigh/SwingLow the logic is reversed and the indicators marks the opposite (if it marked SwingHighs before, it will switch to marking SwingLows and vice versa).
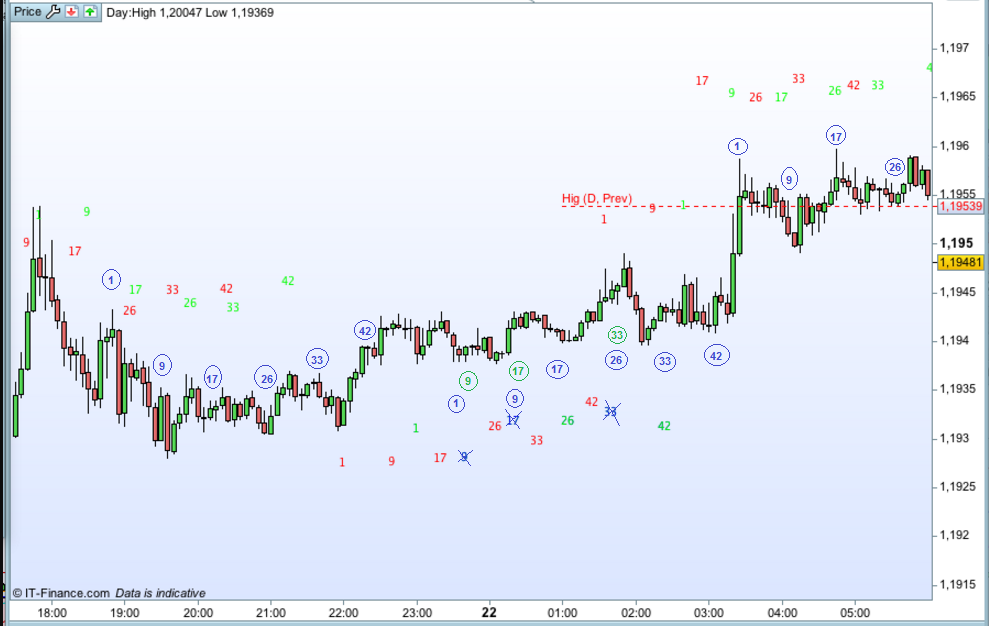
Excellent job Despair, your screenshot had some numbers and sometimes the 3rd number series omitted though?
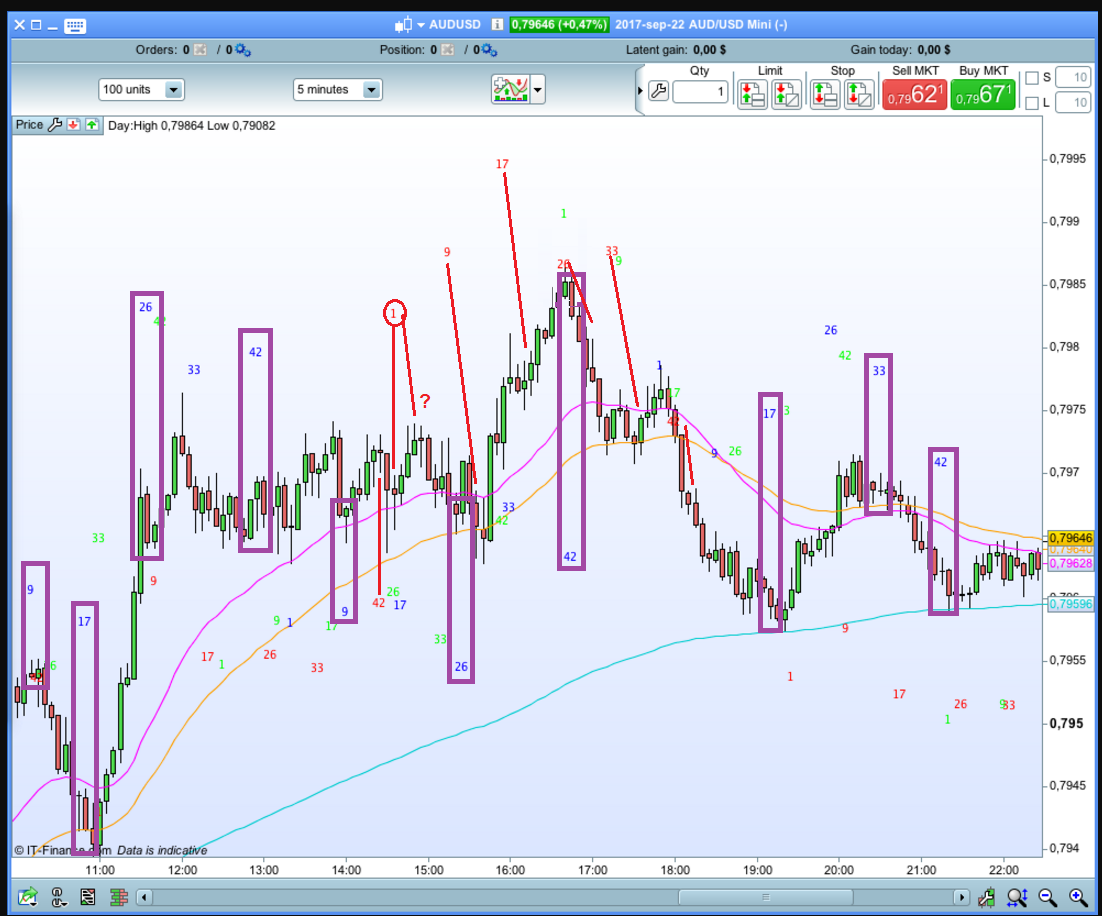
I have added the missing numbers encircled in the attached screenshot. Can you maybe just have a look…
It is important that all 3 sets are always completed up to the number 42, as it is usually in my experience the 3rd set (blue in your case) that is the most indicative of the three.
There is something wrong, you are right. I will correct that. Sorry for this. I should have checked more closely.
No problem Despair happens to the best of us.
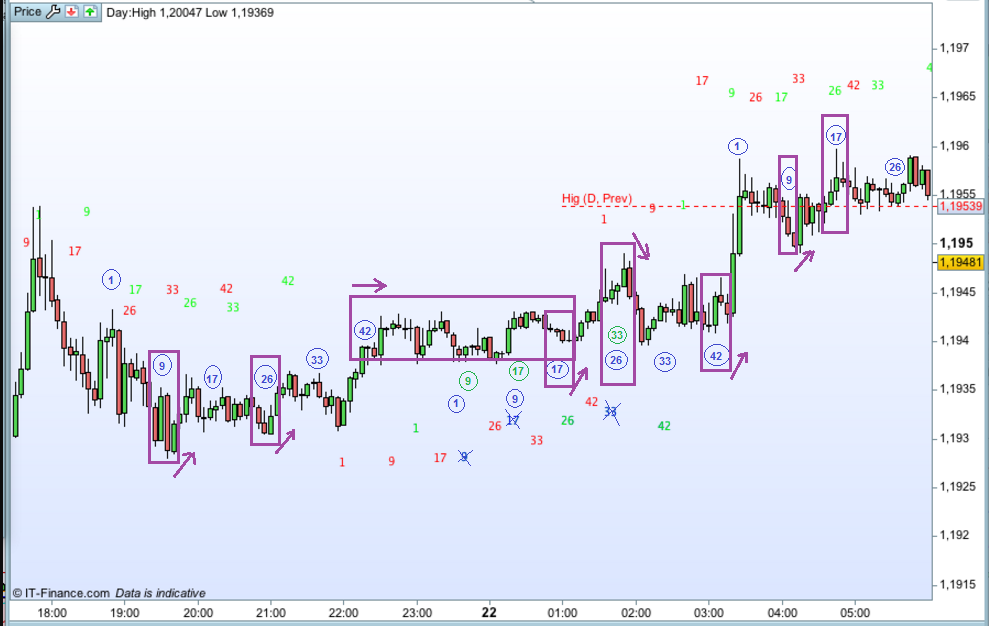
Attached is a screenshot with some observations based on the final blue number series.
Maybe we should highlight the numbers of the 3rd (blue series) with an arrow between the number and the bar high/low.
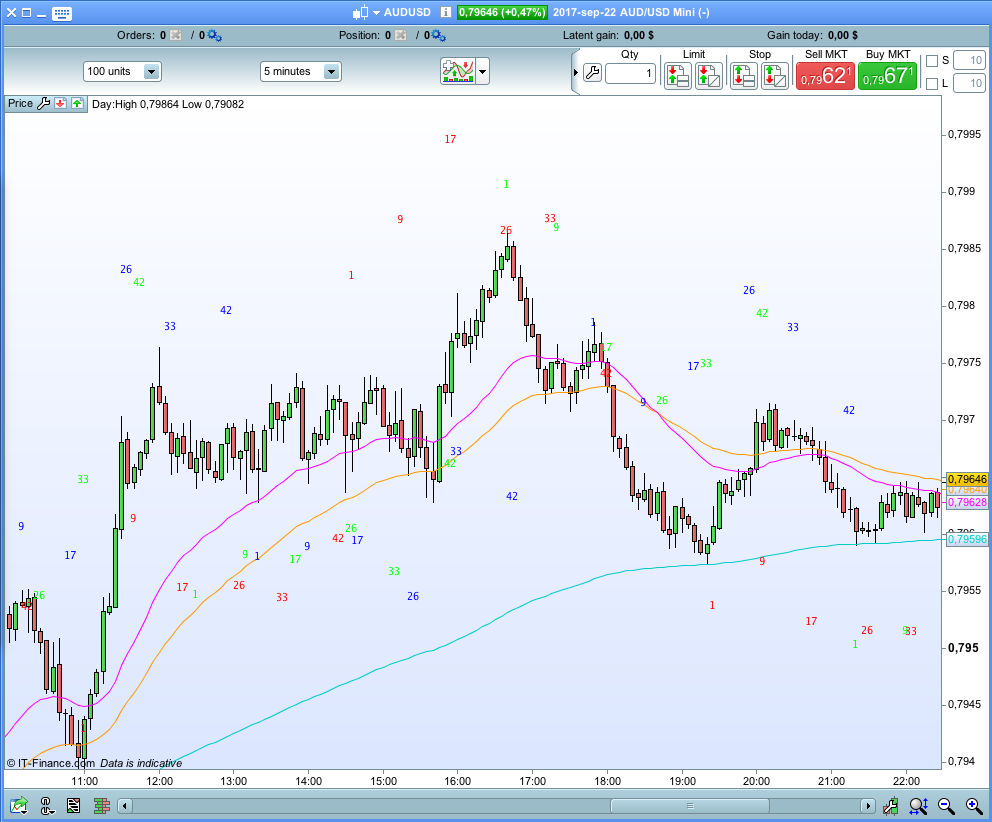
I’m still trying to figure out how to make use of number theory to add or reduce risk, but so far I have definitely found there is something a bit more than coincidence that cannot be ignored.
This indicator is but the tip of the iceberg for a complete Ichimoku strategy, apparently, this needs to be combined with Ichimoku Price, Wave and Time Theory to really ‘get it’
Goichi Hosada (architech of Ichimoku) once said that “Of the 10,000 or so people who are practicing and trading ichimoku, only about 10 really understand it.”
Here comes the corrected version. I hope I didn’t miss anything more.
@Nicolas: Please use this corrected version for the library. Sorry for submitting something faulty. 🙁
Please elaborate on this arrows. Where shall the arrows point? I think there is only an arrow up and an arrow done. Just drew arrows point diagonal or horizontal. 🙂
Do you want on each blue Swinghigh an arrow down and an arrow down for Swinglows?
That is correct, for blue number above candles a down arrow closer to the high and for blue numbers below candles an up arrow closer to the low.
Attached another annotated screenshot showing the significance of the blue number sets. You’d have to agree its very interesting!
Also maybe just note the position of that first swing high, appears to be over the swing low not swing high for some reason.
I will fix the arrows little later, just want to go out for little jogging (must move and can’t only sit all day in front of the monitor.
And shit you are right again. This SwingHigh are little of track – I will fix that too. :-S
Think I found your error on line 72, you draw the number at barindex -4 -4 instead of only barindex -4
//Identify the 1st swing high

if not swinghigh and highnext then
If high[4] > highest[4](high) and high[4] > highest[4](high)[5]  Then
SwingHigh = high[4] //(4 lower highs on left and 4 lower highs on right)
Endif
elsif swinghigh>0 then
i=i+1
IF i=1 or i=9 or i=17 or i=26 or i=33 or i=42 then
drawtext("#i#",barindex-4-4,high+pipsize*10) coloured(255,0,0)
Please try the attached version and look if all numbers are at the right place. The arrows I fix after my jogging round.
…and here the version with arrows. But now I go jogging! 😉
After digging some more I found some other issues (coders life I suppose);
- The red numbers are all shifted right by 1 bar (managed to correct this by offsetting to barindex-5 and not -4)
- It appears there are instances where the blue swing high series in some cases are missing, but mostly it is there :/
1.) I was thinking the same but I wanted to stick to your code for finding the. Then I’m wondering why it is not the same for the blue and green series but we simply correct the red one and are happy about the others. 😛
2.) There is no blue (3rd) series if there isn’t a 3rd fractal within 42 bars after the very first one (this was your rule). Can this be the reason?
I appreciate your time spent on this so far. With regards to point 2, I will work through some examples tomorrow to be sure.
What is your feeling about this indicator? Possibly worth something in your opinion?
I will spend some time tomorrow working through some charts trying to figure out a way to read good quality signals of it.
I think it was like i suggested for number 2. I checked and it was only in a prolonged downtrend that no third series of highswings was shown. Anyway, you may double check.
You contribute a lot to the forum so I’m happy to help you where I can and Yes, I agree this indicator shows potential which should be investigated further.