Hello forum,
I want to code a very simple screener but obviously it’s not so easy as I thought. I want to screen for stocks where the last two bars where above their VWAP.
I tried it this way but it doesn’t work:
timeframe(default)
VWAP = SUMMATION[intradaybarindex](volume*typicalprice)/SUMMATION[intradaybarindex](volume)
testsignal = low[1]>VWAP[1] and low[2]>VWAP[2]

SCREENER [testsignal]
I am sure that VWAP[1] is not the correct way to get the VWAP of the last bar but I don’t know how to get this value.
Thank you for any help!
VWAP[1] is actually the correct way to get the previous bar VWAP value. But, are you looking for an intraday VWAP? On what timeframe do you launch this screener? (the “default” one).
Yes, I am working with 15 minutes intraday charts.
By the way, is it possible to check all bars/VWAP-values of the day within a loop in the screener? For example I want to find all stocks at 19:00 where all 15 minutes bars were below their VWAP.
Good example today was GOOGL.
The below screener will return all shares that has met this condition:
_ last 19:00 bar Close was below the VWAP
period=max(1,intradaybarindex)
VWAP = SUMMATION[period](volume*typicalprice)/SUMMATION[period](volume)

if time=190000 then
if close<vwap then
testsignal=1
else
testsignal=0
endif
endif


SCREENER [testsignal]
I am not sure if you can really use SUMMATION in this case. In the programming manual I read that SUMMATION calculates from the right to the left but to calculate the intraday VWAP I must start at the first bar of the day. So I made this version and it seems to work pretty fine. But I will test it today when the US markets open.
timeframe(daily)
minvol=average[100](volume*close)>10000000

timeframe(default)
v1=0
v2=0
vwap=0
closeabovevwap=0

for i=intradaybarindex downto 1 do
v1=v1+typicalprice[i]*volume[i]
v2=v2+volume[i]
vwap=v1/v2
if close[i]>vwap then
closeabovevwap=1
endif
next

SCREENER [minvol and closeabovevwap=0]
What do you think?
You can use SUMMATION, but it needs a period of at least 1, or it fails to make the calculation, and that’s what happened in your first version. Look at how I calculate period at first line of my code, it prevents the period to be less than 1. SUMMATION is also less intensive for the platform engine than FOR/NEXT loop.
I don’t want to disagree but SUMMATION doesn’t seem to work correctly in this case. It is necessary that the calculation of the VWAP is made from the left to the right and SUMMATION doesn’t work this way. This small example shows that the calculation begins at the very current bar:
timeframe(15 minutes)
vol=SUMMATION[3](volume)

SCREENER [vol>0](vol)
The result is the cumulative volume of the last three bars. That means the VWAP calculation with SUMMATION would be started at the very last bar and end with the first bar of the day.
Sorry if I don’t understand clearly what you mean but, making addition of values starting from the first one or by the last one should give the same result?
(copy/paste from other web sources):
There are five steps in calculating VWAP:
1. Calculate the Typical Price for the period. [(High + Low + Close)/3)]
2. Multiply the Typical Price by the period Volume (Typical Price x Volume)
3. Create a Cumulative Total of Typical Price. Cumulative(Typical Price x Volume)
4. Create a Cumulative Total of Volume. Cumulative(Volume)
5. Divide the Cumulative Totals.
VWAP = Cumulative(Typical Price x Volume) / Cumulative(Volume)
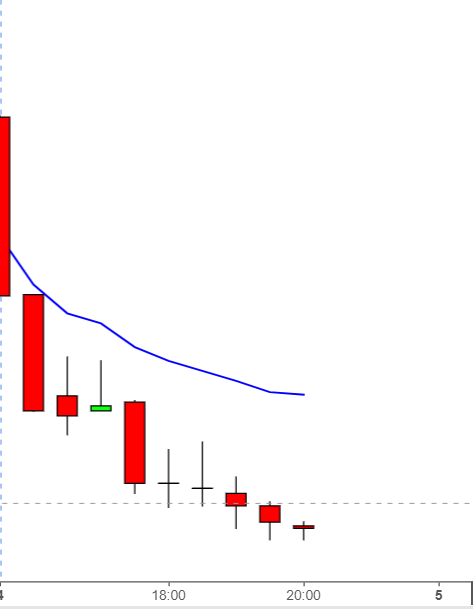
[attachment file=82046]
We can take IBM as an example. The indicator shows a VWAP for the very last 15-minute-bar of 151.40545.
If you start the calculation from the right side it’s the typical price (151.26666) muliplied with the period’s volume divided with the total traded shares. So the calculation would be:
(151.26666*613719)/613719 = 151.26666
You see that the result is different from the correct VWAP of 151.40545. Therefore it’s necessary to start the calculation with the very first bar of the day.
Would you agree?
I just noticed where the logic problem is with SUMMATION is!
You divide by the total volume BUT of course only by the total volume at that time. Only the very last period is divided by the total volume of that day. Therefore it is so important to start with the very first bar of the day. The cumulative volume becomes larger and this is the reason why the VWAP is more sensitive at the beginning and flattens out at the end of the day.
Only the very last period is divided by the total volume of that day.
Nope. All periods are divided by the total volume of the day at their points. The summation periods is automatically increased with the “intradaybarindex”, so each bar make the same calculation but with a different period.
The reason why the VWAP is more and more flattened is because the calculation period is increasing along the day, so the price is more and more weighted by the exchanged Volumes and therefore the real market mean is formed.
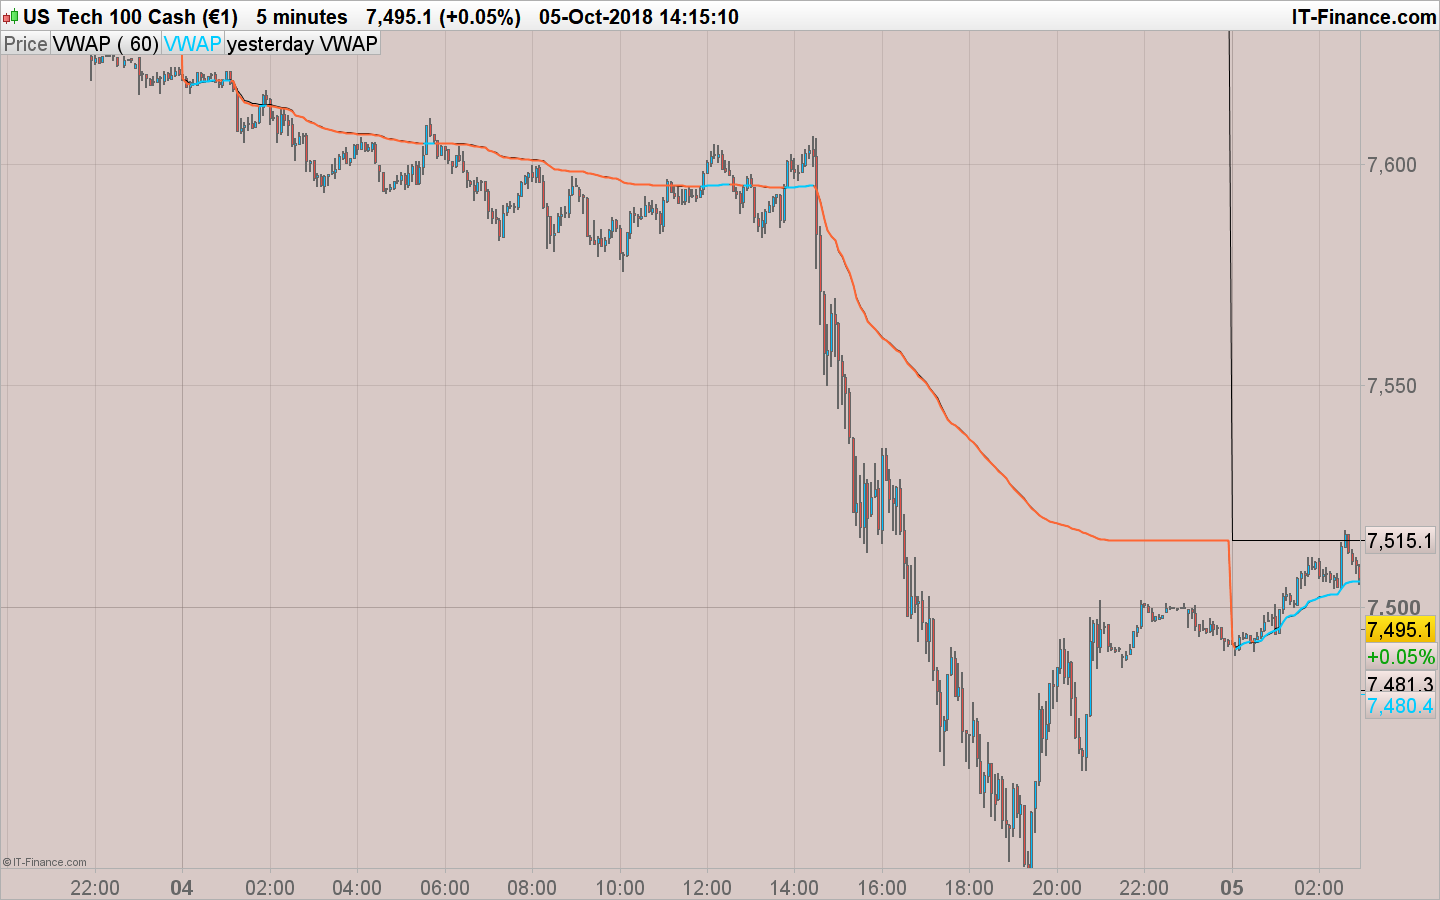
Look at the attached picture, the embedded platform VWAP (black line) is the same as the one I gave the formula above (orange/blue color depending of its slope).
I am sure that you are way better than me in programming but I still don’t get this in my mind… 🙂
Just made some test-screening and most of the results are wrong. I don’t know if it’s the formula or if it’s a syntax problem.
Could you please have a last look at this code? I promise not to bother you with that topic anymore… 🙂
timeframe(5 minutes)
period = max(1, intradaybarindex)
VWAP = SUMMATION[period](volume*typicalprice)/SUMMATION[period](volume)
testsignal = open[1]>VWAP[1] and close[1]<VWAP[1]

SCREENER [testsignal]
A lot of these results do not fit to the chart I see. Please have a look yourself. Thanks!!
PS. This code works perfect:
timeframe(5 minutes)
v1=0
v2=0
vwap=0

for i=intradaybarindex downto 1 do
v1=v1+typicalprice[i]*volume[i]
v2=v2+volume[i]
vwap=v1/v2
if i=1 then
vwap1=vwap
endif
next

SCREENER [open[1]>vwap1 and close[1]<vwap1]